

Key Insights
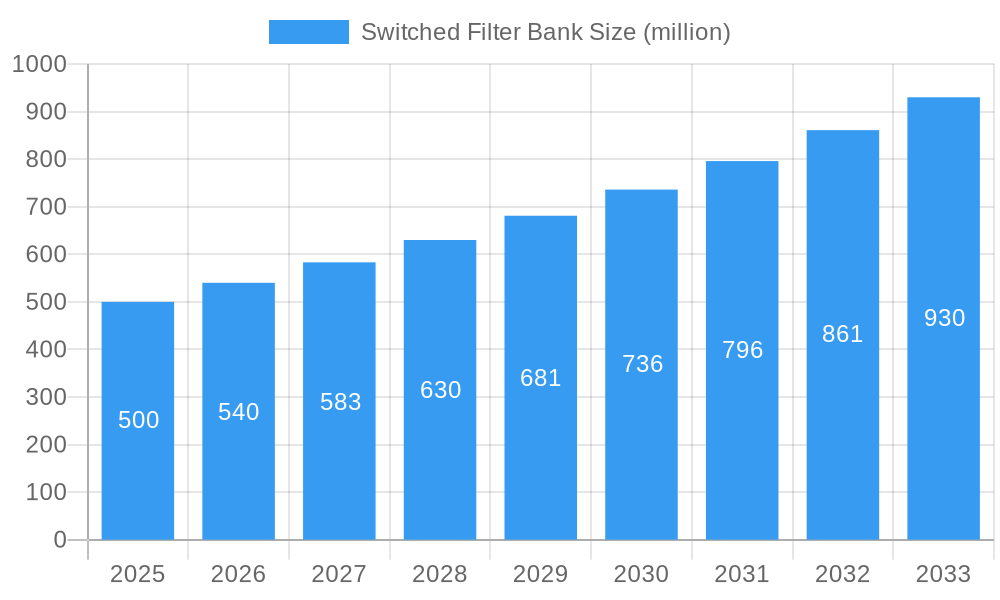
The Switched Filter Bank market is experiencing robust growth, driven by increasing demand for high-frequency applications in various sectors, including telecommunications, aerospace, and defense. The market, estimated at $500 million in 2025, is projected to grow at a Compound Annual Growth Rate (CAGR) of 8% from 2025 to 2033, reaching approximately $950 million by the end of the forecast period. This expansion is fueled by several key factors. The rising adoption of 5G and other advanced wireless technologies necessitates high-performance filtering solutions, creating a strong demand for switched filter banks. Moreover, the miniaturization trend in electronics and the need for improved signal processing capabilities in radar systems and other defense applications are contributing significantly to market growth. Technological advancements, such as the development of advanced filter designs and improved manufacturing processes, further enhance the market’s potential. While potential supply chain constraints and fluctuations in raw material costs pose some challenges, the overall market outlook remains positive.
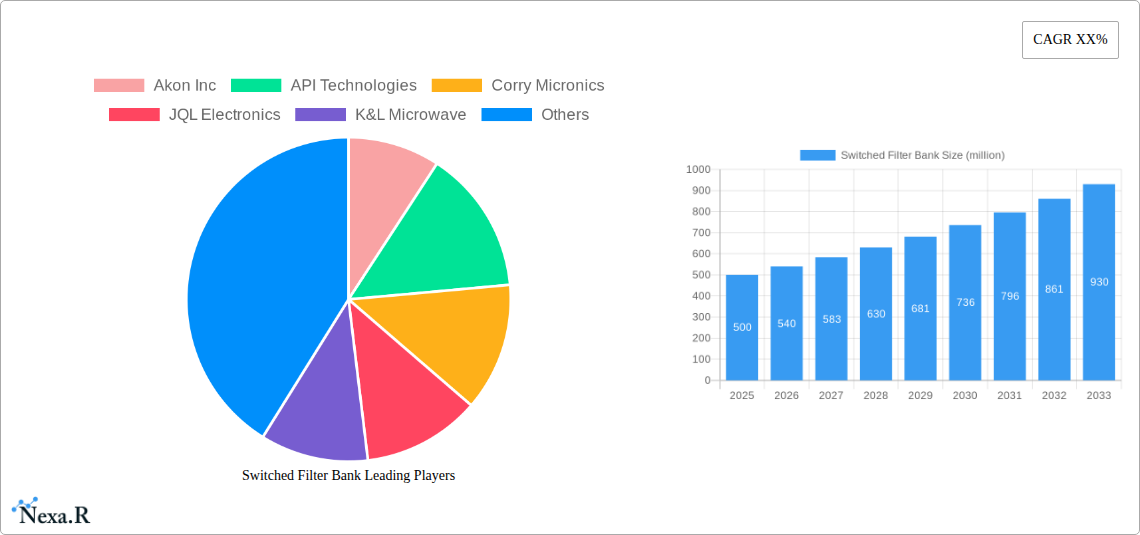
Switched Filter Bank Market Size (In Million)
The competitive landscape is marked by a blend of established players and emerging companies. Key market participants, including Akon Inc, API Technologies, Corry Micronics, JQL Electronics, K&L Microwave, Kratos, Lark Engineering, Lorch Microwave, Mercury Systems, Networks International Corporation, Planar Monolithics Industries, Q Microwave, Teledyne RF & Microwave, and TRAK Microwave Corporation, are actively involved in developing and delivering innovative switched filter bank solutions. These companies are focusing on product differentiation through superior performance, compact designs, and advanced functionalities. The market is also witnessing increasing mergers and acquisitions, partnerships, and collaborations, aimed at expanding product portfolios and gaining market share. Geographic expansion into developing economies presents considerable growth opportunities. Competition is likely to intensify further, driven by technological innovation and a focus on meeting the evolving demands of a rapidly growing market.
Switched Filter Bank Company Market Share
Switched Filter Bank Market Report: 2019-2033
This comprehensive report provides a detailed analysis of the Switched Filter Bank market, encompassing market dynamics, growth trends, regional analysis, competitive landscape, and future outlook. The study period covers 2019-2033, with 2025 as the base and estimated year. The report caters to industry professionals, investors, and strategic decision-makers seeking in-depth insights into this dynamic market. Our analysis leverages extensive primary and secondary research to deliver actionable intelligence for informed business strategies. The global Switched Filter Bank market is projected to reach xx million units by 2033, driven by significant growth in the parent market of [Parent Market Name, e.g., RF and Microwave Components] and child market of [Child Market Name, e.g., 5G Infrastructure].
Switched Filter Bank Market Dynamics & Structure
The Switched Filter Bank market is characterized by moderate concentration, with several key players holding significant market share. Technological innovation, particularly in areas like higher frequency operation and improved signal processing capabilities, are key drivers. Stringent regulatory frameworks governing RF emissions influence product design and adoption. Competitive substitutes, such as software-defined radios, pose a challenge, but the advantages of Switched Filter Banks in terms of performance and cost-effectiveness sustain market demand. The market's end-user demographics span diverse sectors, including telecommunications, defense, aerospace, and industrial automation. M&A activity has been relatively modest, with xx deals recorded in the historical period (2019-2024), mostly focusing on smaller companies.
- Market Concentration: Moderately concentrated, with top 5 players holding approximately 60% market share in 2024.
- Technological Innovation: Advancements in materials science and design methodologies are driving miniaturization and improved performance.
- Regulatory Landscape: Compliance with international and regional standards shapes product development and certification processes.
- Competitive Substitutes: Software-defined radios are emerging as potential competitors, but Switched Filter Banks retain advantages in specific applications.
- End-User Demographics: Telecommunications (40%), Defense (30%), Aerospace (15%), Industrial Automation (15%).
- M&A Activity: xx deals completed between 2019 and 2024, with an average deal size of xx million units.
Switched Filter Bank Growth Trends & Insights
The Switched Filter Bank market exhibited a CAGR of xx% during the historical period (2019-2024), reaching xx million units in 2024. This growth is primarily attributed to increasing demand from the telecommunications sector, particularly driven by 5G infrastructure deployment. Technological disruptions, like the adoption of advanced filter technologies, have improved performance and broadened applications. Consumer behavior shifts towards higher data rates and improved connectivity continue fueling market expansion. We project a CAGR of xx% for the forecast period (2025-2033), with market penetration expected to reach xx% by 2033 in the key segments.
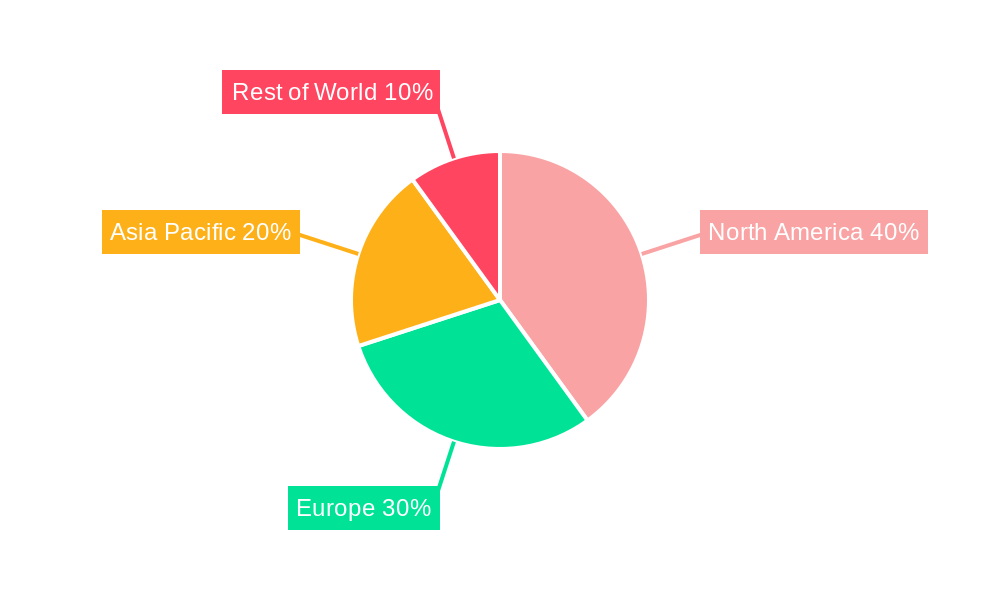
Dominant Regions, Countries, or Segments in Switched Filter Bank
North America currently dominates the Switched Filter Bank market, holding approximately 45% market share in 2024, fueled by strong demand from the defense and aerospace sectors and a robust technological ecosystem. Asia-Pacific is projected to experience the fastest growth, with a CAGR of xx% during the forecast period, driven by rapid 5G infrastructure development and increasing industrial automation. Europe holds a stable market share, while other regions exhibit slower growth.
- North America: Strong government spending on defense and aerospace, coupled with a mature technological base, fuels market dominance.
- Asia-Pacific: Rapid 5G rollout and growing industrialization are key drivers of market expansion.
- Europe: A stable market with consistent demand across various sectors.
- Other Regions: Slower growth due to limited technological advancements and infrastructure development.
Switched Filter Bank Product Landscape
Switched Filter Banks are available in various configurations, including surface mount devices (SMDs), through-hole devices, and integrated circuits (ICs). Recent innovations have focused on miniaturization, improved frequency selectivity, and reduced power consumption. Key performance metrics include insertion loss, return loss, and switching speed. Unique selling propositions often revolve around high performance at a specific frequency range or superior integration capabilities.
Key Drivers, Barriers & Challenges in Switched Filter Bank
Key Drivers:
- Increasing demand from the telecommunications industry for high-performance filtering solutions in 5G infrastructure.
- Technological advancements leading to miniaturization, enhanced performance, and reduced costs.
- Growth in the aerospace and defense sectors, requiring high-reliability and high-performance components.
Key Barriers & Challenges:
- High production costs associated with advanced materials and manufacturing processes.
- Supply chain disruptions impacting component availability and lead times.
- Stringent regulatory requirements and certification processes for specific applications. These regulations add to the total cost and time-to-market.
Emerging Opportunities in Switched Filter Bank
- Expansion into new applications, such as satellite communications, automotive radar, and medical imaging.
- Development of highly integrated and miniaturized Switched Filter Banks for use in wearable devices.
- Customization of Switched Filter Banks to meet specific customer needs, focusing on niche applications.
Growth Accelerators in the Switched Filter Bank Industry
Technological breakthroughs in materials science and integrated circuit design are key growth catalysts. Strategic partnerships between component manufacturers and system integrators are also driving market expansion. Moreover, the increasing demand for higher bandwidth and improved signal integrity in diverse applications continues to fuel market growth.
Key Players Shaping the Switched Filter Bank Market
- Akon Inc
- API Technologies
- Corry Micronics
- JQL Electronics
- K&L Microwave
- Kratos
- Lark Engineering
- Lorch Microwave
- Mercury Systems
- Networks International Corporation
- Planar Monolithics Industries
- Q Microwave
- Teledyne RF & Microwave
- TRAK Microwave Corporation
Notable Milestones in Switched Filter Bank Sector
- 2020-Q4: Introduction of a new, highly integrated Switched Filter Bank by Akon Inc.
- 2021-Q2: Mercury Systems acquired a smaller competitor, expanding their product portfolio.
- 2022-Q3: API Technologies announced a new manufacturing facility dedicated to Switched Filter Bank production.
- 2023-Q1: Significant investment in R&D by Teledyne RF & Microwave led to a breakthrough in high-frequency filter technology.
In-Depth Switched Filter Bank Market Outlook
The Switched Filter Bank market is poised for continued growth, driven by technological advancements, increased demand across diverse applications, and strategic investments by key players. Opportunities exist in exploring new markets, optimizing supply chains, and developing innovative product features. The market's future prospects remain strong, with significant potential for expansion in both established and emerging regions.
Switched Filter Bank Segmentation
-
1. Application
- 1.1. Airborne
- 1.2. Shipboard
- 1.3. Space
- 1.4. Ground
-
2. Types
- 2.1. 2-5 channels
- 2.2. 5-7 channels
- 2.3. Above 7 channels
Switched Filter Bank Segmentation By Geography
-
1. North America
- 1.1. United States
- 1.2. Canada
- 1.3. Mexico
-
2. South America
- 2.1. Brazil
- 2.2. Argentina
- 2.3. Rest of South America
-
3. Europe
- 3.1. United Kingdom
- 3.2. Germany
- 3.3. France
- 3.4. Italy
- 3.5. Spain
- 3.6. Russia
- 3.7. Benelux
- 3.8. Nordics
- 3.9. Rest of Europe
-
4. Middle East & Africa
- 4.1. Turkey
- 4.2. Israel
- 4.3. GCC
- 4.4. North Africa
- 4.5. South Africa
- 4.6. Rest of Middle East & Africa
-
5. Asia Pacific
- 5.1. China
- 5.2. India
- 5.3. Japan
- 5.4. South Korea
- 5.5. ASEAN
- 5.6. Oceania
- 5.7. Rest of Asia Pacific
Switched Filter Bank Regional Market Share
Geographic Coverage of Switched Filter Bank
Switched Filter Bank REPORT HIGHLIGHTS
| Aspects | Details |
|---|---|
| Study Period | 2020-2034 |
| Base Year | 2025 |
| Estimated Year | 2026 |
| Forecast Period | 2026-2034 |
| Historical Period | 2020-2025 |
| Growth Rate | CAGR of 6.3% from 2020-2034 |
| Segmentation |
|
Table of Contents
- 1. Introduction
- 1.1. Research Scope
- 1.2. Market Segmentation
- 1.3. Research Methodology
- 1.4. Definitions and Assumptions
- 2. Executive Summary
- 2.1. Introduction
- 3. Market Dynamics
- 3.1. Introduction
- 3.2. Market Drivers
- 3.3. Market Restrains
- 3.4. Market Trends
- 4. Market Factor Analysis
- 4.1. Porters Five Forces
- 4.2. Supply/Value Chain
- 4.3. PESTEL analysis
- 4.4. Market Entropy
- 4.5. Patent/Trademark Analysis
- 5. Global Switched Filter Bank Analysis, Insights and Forecast, 2020-2032
- 5.1. Market Analysis, Insights and Forecast - by Application
- 5.1.1. Airborne
- 5.1.2. Shipboard
- 5.1.3. Space
- 5.1.4. Ground
- 5.2. Market Analysis, Insights and Forecast - by Types
- 5.2.1. 2-5 channels
- 5.2.2. 5-7 channels
- 5.2.3. Above 7 channels
- 5.3. Market Analysis, Insights and Forecast - by Region
- 5.3.1. North America
- 5.3.2. South America
- 5.3.3. Europe
- 5.3.4. Middle East & Africa
- 5.3.5. Asia Pacific
- 5.1. Market Analysis, Insights and Forecast - by Application
- 6. North America Switched Filter Bank Analysis, Insights and Forecast, 2020-2032
- 6.1. Market Analysis, Insights and Forecast - by Application
- 6.1.1. Airborne
- 6.1.2. Shipboard
- 6.1.3. Space
- 6.1.4. Ground
- 6.2. Market Analysis, Insights and Forecast - by Types
- 6.2.1. 2-5 channels
- 6.2.2. 5-7 channels
- 6.2.3. Above 7 channels
- 6.1. Market Analysis, Insights and Forecast - by Application
- 7. South America Switched Filter Bank Analysis, Insights and Forecast, 2020-2032
- 7.1. Market Analysis, Insights and Forecast - by Application
- 7.1.1. Airborne
- 7.1.2. Shipboard
- 7.1.3. Space
- 7.1.4. Ground
- 7.2. Market Analysis, Insights and Forecast - by Types
- 7.2.1. 2-5 channels
- 7.2.2. 5-7 channels
- 7.2.3. Above 7 channels
- 7.1. Market Analysis, Insights and Forecast - by Application
- 8. Europe Switched Filter Bank Analysis, Insights and Forecast, 2020-2032
- 8.1. Market Analysis, Insights and Forecast - by Application
- 8.1.1. Airborne
- 8.1.2. Shipboard
- 8.1.3. Space
- 8.1.4. Ground
- 8.2. Market Analysis, Insights and Forecast - by Types
- 8.2.1. 2-5 channels
- 8.2.2. 5-7 channels
- 8.2.3. Above 7 channels
- 8.1. Market Analysis, Insights and Forecast - by Application
- 9. Middle East & Africa Switched Filter Bank Analysis, Insights and Forecast, 2020-2032
- 9.1. Market Analysis, Insights and Forecast - by Application
- 9.1.1. Airborne
- 9.1.2. Shipboard
- 9.1.3. Space
- 9.1.4. Ground
- 9.2. Market Analysis, Insights and Forecast - by Types
- 9.2.1. 2-5 channels
- 9.2.2. 5-7 channels
- 9.2.3. Above 7 channels
- 9.1. Market Analysis, Insights and Forecast - by Application
- 10. Asia Pacific Switched Filter Bank Analysis, Insights and Forecast, 2020-2032
- 10.1. Market Analysis, Insights and Forecast - by Application
- 10.1.1. Airborne
- 10.1.2. Shipboard
- 10.1.3. Space
- 10.1.4. Ground
- 10.2. Market Analysis, Insights and Forecast - by Types
- 10.2.1. 2-5 channels
- 10.2.2. 5-7 channels
- 10.2.3. Above 7 channels
- 10.1. Market Analysis, Insights and Forecast - by Application
- 11. Competitive Analysis
- 11.1. Global Market Share Analysis 2025
- 11.2. Company Profiles
- 11.2.1 Akon Inc
- 11.2.1.1. Overview
- 11.2.1.2. Products
- 11.2.1.3. SWOT Analysis
- 11.2.1.4. Recent Developments
- 11.2.1.5. Financials (Based on Availability)
- 11.2.2 API Technologies
- 11.2.2.1. Overview
- 11.2.2.2. Products
- 11.2.2.3. SWOT Analysis
- 11.2.2.4. Recent Developments
- 11.2.2.5. Financials (Based on Availability)
- 11.2.3 Corry Micronics
- 11.2.3.1. Overview
- 11.2.3.2. Products
- 11.2.3.3. SWOT Analysis
- 11.2.3.4. Recent Developments
- 11.2.3.5. Financials (Based on Availability)
- 11.2.4 JQL Electronics
- 11.2.4.1. Overview
- 11.2.4.2. Products
- 11.2.4.3. SWOT Analysis
- 11.2.4.4. Recent Developments
- 11.2.4.5. Financials (Based on Availability)
- 11.2.5 K&L Microwave
- 11.2.5.1. Overview
- 11.2.5.2. Products
- 11.2.5.3. SWOT Analysis
- 11.2.5.4. Recent Developments
- 11.2.5.5. Financials (Based on Availability)
- 11.2.6 Kratos
- 11.2.6.1. Overview
- 11.2.6.2. Products
- 11.2.6.3. SWOT Analysis
- 11.2.6.4. Recent Developments
- 11.2.6.5. Financials (Based on Availability)
- 11.2.7 Lark Engineering
- 11.2.7.1. Overview
- 11.2.7.2. Products
- 11.2.7.3. SWOT Analysis
- 11.2.7.4. Recent Developments
- 11.2.7.5. Financials (Based on Availability)
- 11.2.8 Lorch Microwave
- 11.2.8.1. Overview
- 11.2.8.2. Products
- 11.2.8.3. SWOT Analysis
- 11.2.8.4. Recent Developments
- 11.2.8.5. Financials (Based on Availability)
- 11.2.9 Mercury Systems
- 11.2.9.1. Overview
- 11.2.9.2. Products
- 11.2.9.3. SWOT Analysis
- 11.2.9.4. Recent Developments
- 11.2.9.5. Financials (Based on Availability)
- 11.2.10 Networks International Corporation
- 11.2.10.1. Overview
- 11.2.10.2. Products
- 11.2.10.3. SWOT Analysis
- 11.2.10.4. Recent Developments
- 11.2.10.5. Financials (Based on Availability)
- 11.2.11 Planar Monolithics Industries
- 11.2.11.1. Overview
- 11.2.11.2. Products
- 11.2.11.3. SWOT Analysis
- 11.2.11.4. Recent Developments
- 11.2.11.5. Financials (Based on Availability)
- 11.2.12 Q Microwave
- 11.2.12.1. Overview
- 11.2.12.2. Products
- 11.2.12.3. SWOT Analysis
- 11.2.12.4. Recent Developments
- 11.2.12.5. Financials (Based on Availability)
- 11.2.13 Teledyne RF & Microwave
- 11.2.13.1. Overview
- 11.2.13.2. Products
- 11.2.13.3. SWOT Analysis
- 11.2.13.4. Recent Developments
- 11.2.13.5. Financials (Based on Availability)
- 11.2.14 TRAK Microwave Corporation
- 11.2.14.1. Overview
- 11.2.14.2. Products
- 11.2.14.3. SWOT Analysis
- 11.2.14.4. Recent Developments
- 11.2.14.5. Financials (Based on Availability)
- 11.2.1 Akon Inc
List of Figures
- Figure 1: Global Switched Filter Bank Revenue Breakdown (undefined, %) by Region 2025 & 2033
- Figure 2: North America Switched Filter Bank Revenue (undefined), by Application 2025 & 2033
- Figure 3: North America Switched Filter Bank Revenue Share (%), by Application 2025 & 2033
- Figure 4: North America Switched Filter Bank Revenue (undefined), by Types 2025 & 2033
- Figure 5: North America Switched Filter Bank Revenue Share (%), by Types 2025 & 2033
- Figure 6: North America Switched Filter Bank Revenue (undefined), by Country 2025 & 2033
- Figure 7: North America Switched Filter Bank Revenue Share (%), by Country 2025 & 2033
- Figure 8: South America Switched Filter Bank Revenue (undefined), by Application 2025 & 2033
- Figure 9: South America Switched Filter Bank Revenue Share (%), by Application 2025 & 2033
- Figure 10: South America Switched Filter Bank Revenue (undefined), by Types 2025 & 2033
- Figure 11: South America Switched Filter Bank Revenue Share (%), by Types 2025 & 2033
- Figure 12: South America Switched Filter Bank Revenue (undefined), by Country 2025 & 2033
- Figure 13: South America Switched Filter Bank Revenue Share (%), by Country 2025 & 2033
- Figure 14: Europe Switched Filter Bank Revenue (undefined), by Application 2025 & 2033
- Figure 15: Europe Switched Filter Bank Revenue Share (%), by Application 2025 & 2033
- Figure 16: Europe Switched Filter Bank Revenue (undefined), by Types 2025 & 2033
- Figure 17: Europe Switched Filter Bank Revenue Share (%), by Types 2025 & 2033
- Figure 18: Europe Switched Filter Bank Revenue (undefined), by Country 2025 & 2033
- Figure 19: Europe Switched Filter Bank Revenue Share (%), by Country 2025 & 2033
- Figure 20: Middle East & Africa Switched Filter Bank Revenue (undefined), by Application 2025 & 2033
- Figure 21: Middle East & Africa Switched Filter Bank Revenue Share (%), by Application 2025 & 2033
- Figure 22: Middle East & Africa Switched Filter Bank Revenue (undefined), by Types 2025 & 2033
- Figure 23: Middle East & Africa Switched Filter Bank Revenue Share (%), by Types 2025 & 2033
- Figure 24: Middle East & Africa Switched Filter Bank Revenue (undefined), by Country 2025 & 2033
- Figure 25: Middle East & Africa Switched Filter Bank Revenue Share (%), by Country 2025 & 2033
- Figure 26: Asia Pacific Switched Filter Bank Revenue (undefined), by Application 2025 & 2033
- Figure 27: Asia Pacific Switched Filter Bank Revenue Share (%), by Application 2025 & 2033
- Figure 28: Asia Pacific Switched Filter Bank Revenue (undefined), by Types 2025 & 2033
- Figure 29: Asia Pacific Switched Filter Bank Revenue Share (%), by Types 2025 & 2033
- Figure 30: Asia Pacific Switched Filter Bank Revenue (undefined), by Country 2025 & 2033
- Figure 31: Asia Pacific Switched Filter Bank Revenue Share (%), by Country 2025 & 2033
List of Tables
- Table 1: Global Switched Filter Bank Revenue undefined Forecast, by Application 2020 & 2033
- Table 2: Global Switched Filter Bank Revenue undefined Forecast, by Types 2020 & 2033
- Table 3: Global Switched Filter Bank Revenue undefined Forecast, by Region 2020 & 2033
- Table 4: Global Switched Filter Bank Revenue undefined Forecast, by Application 2020 & 2033
- Table 5: Global Switched Filter Bank Revenue undefined Forecast, by Types 2020 & 2033
- Table 6: Global Switched Filter Bank Revenue undefined Forecast, by Country 2020 & 2033
- Table 7: United States Switched Filter Bank Revenue (undefined) Forecast, by Application 2020 & 2033
- Table 8: Canada Switched Filter Bank Revenue (undefined) Forecast, by Application 2020 & 2033
- Table 9: Mexico Switched Filter Bank Revenue (undefined) Forecast, by Application 2020 & 2033
- Table 10: Global Switched Filter Bank Revenue undefined Forecast, by Application 2020 & 2033
- Table 11: Global Switched Filter Bank Revenue undefined Forecast, by Types 2020 & 2033
- Table 12: Global Switched Filter Bank Revenue undefined Forecast, by Country 2020 & 2033
- Table 13: Brazil Switched Filter Bank Revenue (undefined) Forecast, by Application 2020 & 2033
- Table 14: Argentina Switched Filter Bank Revenue (undefined) Forecast, by Application 2020 & 2033
- Table 15: Rest of South America Switched Filter Bank Revenue (undefined) Forecast, by Application 2020 & 2033
- Table 16: Global Switched Filter Bank Revenue undefined Forecast, by Application 2020 & 2033
- Table 17: Global Switched Filter Bank Revenue undefined Forecast, by Types 2020 & 2033
- Table 18: Global Switched Filter Bank Revenue undefined Forecast, by Country 2020 & 2033
- Table 19: United Kingdom Switched Filter Bank Revenue (undefined) Forecast, by Application 2020 & 2033
- Table 20: Germany Switched Filter Bank Revenue (undefined) Forecast, by Application 2020 & 2033
- Table 21: France Switched Filter Bank Revenue (undefined) Forecast, by Application 2020 & 2033
- Table 22: Italy Switched Filter Bank Revenue (undefined) Forecast, by Application 2020 & 2033
- Table 23: Spain Switched Filter Bank Revenue (undefined) Forecast, by Application 2020 & 2033
- Table 24: Russia Switched Filter Bank Revenue (undefined) Forecast, by Application 2020 & 2033
- Table 25: Benelux Switched Filter Bank Revenue (undefined) Forecast, by Application 2020 & 2033
- Table 26: Nordics Switched Filter Bank Revenue (undefined) Forecast, by Application 2020 & 2033
- Table 27: Rest of Europe Switched Filter Bank Revenue (undefined) Forecast, by Application 2020 & 2033
- Table 28: Global Switched Filter Bank Revenue undefined Forecast, by Application 2020 & 2033
- Table 29: Global Switched Filter Bank Revenue undefined Forecast, by Types 2020 & 2033
- Table 30: Global Switched Filter Bank Revenue undefined Forecast, by Country 2020 & 2033
- Table 31: Turkey Switched Filter Bank Revenue (undefined) Forecast, by Application 2020 & 2033
- Table 32: Israel Switched Filter Bank Revenue (undefined) Forecast, by Application 2020 & 2033
- Table 33: GCC Switched Filter Bank Revenue (undefined) Forecast, by Application 2020 & 2033
- Table 34: North Africa Switched Filter Bank Revenue (undefined) Forecast, by Application 2020 & 2033
- Table 35: South Africa Switched Filter Bank Revenue (undefined) Forecast, by Application 2020 & 2033
- Table 36: Rest of Middle East & Africa Switched Filter Bank Revenue (undefined) Forecast, by Application 2020 & 2033
- Table 37: Global Switched Filter Bank Revenue undefined Forecast, by Application 2020 & 2033
- Table 38: Global Switched Filter Bank Revenue undefined Forecast, by Types 2020 & 2033
- Table 39: Global Switched Filter Bank Revenue undefined Forecast, by Country 2020 & 2033
- Table 40: China Switched Filter Bank Revenue (undefined) Forecast, by Application 2020 & 2033
- Table 41: India Switched Filter Bank Revenue (undefined) Forecast, by Application 2020 & 2033
- Table 42: Japan Switched Filter Bank Revenue (undefined) Forecast, by Application 2020 & 2033
- Table 43: South Korea Switched Filter Bank Revenue (undefined) Forecast, by Application 2020 & 2033
- Table 44: ASEAN Switched Filter Bank Revenue (undefined) Forecast, by Application 2020 & 2033
- Table 45: Oceania Switched Filter Bank Revenue (undefined) Forecast, by Application 2020 & 2033
- Table 46: Rest of Asia Pacific Switched Filter Bank Revenue (undefined) Forecast, by Application 2020 & 2033
Frequently Asked Questions
1. What is the projected Compound Annual Growth Rate (CAGR) of the Switched Filter Bank?
The projected CAGR is approximately 6.3%.
2. Which companies are prominent players in the Switched Filter Bank?
Key companies in the market include Akon Inc, API Technologies, Corry Micronics, JQL Electronics, K&L Microwave, Kratos, Lark Engineering, Lorch Microwave, Mercury Systems, Networks International Corporation, Planar Monolithics Industries, Q Microwave, Teledyne RF & Microwave, TRAK Microwave Corporation.
3. What are the main segments of the Switched Filter Bank?
The market segments include Application, Types.
4. Can you provide details about the market size?
The market size is estimated to be USD XXX N/A as of 2022.
5. What are some drivers contributing to market growth?
N/A
6. What are the notable trends driving market growth?
N/A
7. Are there any restraints impacting market growth?
N/A
8. Can you provide examples of recent developments in the market?
N/A
9. What pricing options are available for accessing the report?
Pricing options include single-user, multi-user, and enterprise licenses priced at USD 2900.00, USD 4350.00, and USD 5800.00 respectively.
10. Is the market size provided in terms of value or volume?
The market size is provided in terms of value, measured in N/A.
11. Are there any specific market keywords associated with the report?
Yes, the market keyword associated with the report is "Switched Filter Bank," which aids in identifying and referencing the specific market segment covered.
12. How do I determine which pricing option suits my needs best?
The pricing options vary based on user requirements and access needs. Individual users may opt for single-user licenses, while businesses requiring broader access may choose multi-user or enterprise licenses for cost-effective access to the report.
13. Are there any additional resources or data provided in the Switched Filter Bank report?
While the report offers comprehensive insights, it's advisable to review the specific contents or supplementary materials provided to ascertain if additional resources or data are available.
14. How can I stay updated on further developments or reports in the Switched Filter Bank?
To stay informed about further developments, trends, and reports in the Switched Filter Bank, consider subscribing to industry newsletters, following relevant companies and organizations, or regularly checking reputable industry news sources and publications.
Methodology
Step 1 - Identification of Relevant Samples Size from Population Database


Step 2 - Approaches for Defining Global Market Size (Value, Volume* & Price*)

Note*: In applicable scenarios
Step 3 - Data Sources
Primary Research
- Web Analytics
- Survey Reports
- Research Institute
- Latest Research Reports
- Opinion Leaders
Secondary Research
- Annual Reports
- White Paper
- Latest Press Release
- Industry Association
- Paid Database
- Investor Presentations

Step 4 - Data Triangulation
Involves using different sources of information in order to increase the validity of a study
These sources are likely to be stakeholders in a program - participants, other researchers, program staff, other community members, and so on.
Then we put all data in single framework & apply various statistical tools to find out the dynamic on the market.
During the analysis stage, feedback from the stakeholder groups would be compared to determine areas of agreement as well as areas of divergence