

Key Insights
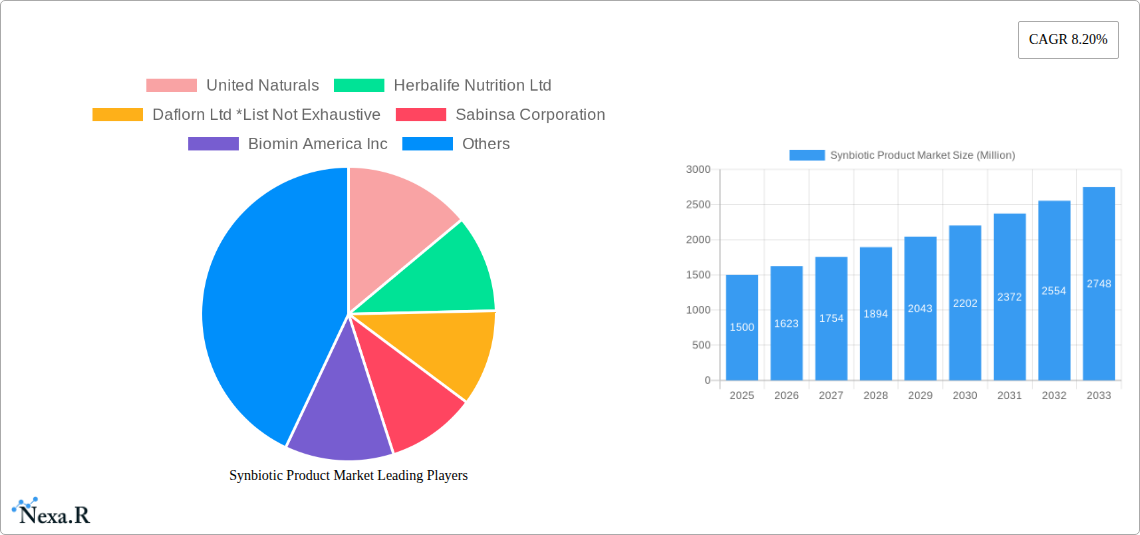
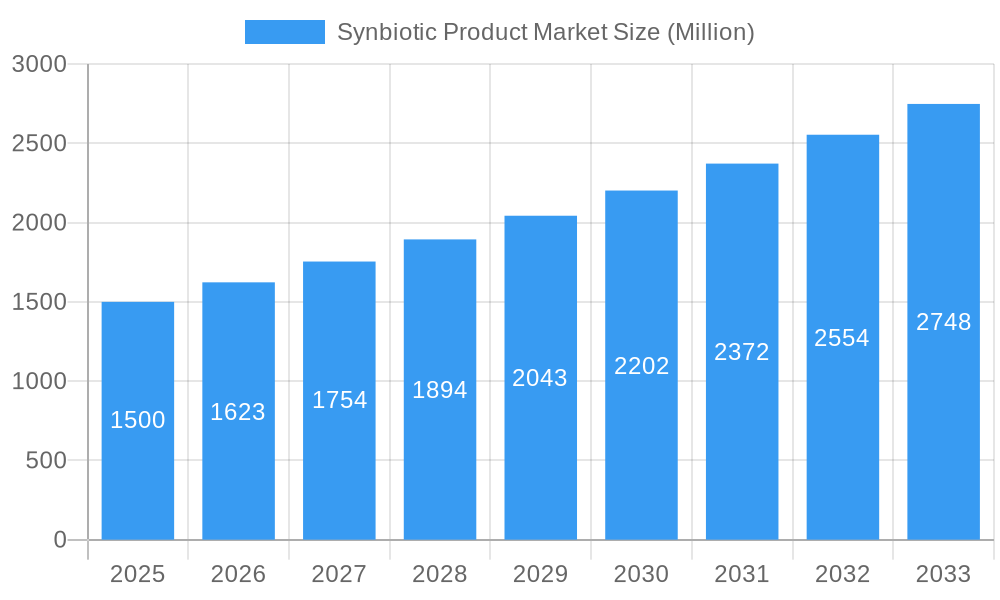
The synbiotic product market, encompassing food and beverages, dietary supplements, animal feed, and other applications, is experiencing robust growth, projected to maintain a compound annual growth rate (CAGR) of 8.20% from 2025 to 2033. This expansion is driven by several key factors. Increasing consumer awareness of gut health and its connection to overall well-being fuels demand for products containing beneficial bacteria and prebiotics. The rising prevalence of digestive disorders and the increasing adoption of preventative healthcare measures further contribute to market growth. Furthermore, the expanding research and development efforts focused on understanding the precise mechanisms of synbiotic action and their applications in various health conditions are creating innovative product formulations and enhancing market appeal. The distribution landscape is diversified, with pharmacies/health stores, supermarkets/hypermarkets, and online retail stores playing significant roles. Major players like United Naturals, Herbalife Nutrition Ltd, and others are strategically investing in research, product diversification, and global expansion to capitalize on this thriving market.
Synbiotic Product Market Market Size (In Billion)
The market segmentation reveals a significant share held by the food and beverage sector, driven by the growing preference for functional foods and beverages that offer health benefits. Dietary supplements also represent a substantial market segment, benefiting from the increased demand for targeted health solutions. Geographical analysis indicates significant market potential across North America and Europe, fueled by high consumer disposable income and strong awareness of health and wellness. However, the Asia-Pacific region is emerging as a high-growth area, driven by rapidly changing lifestyles and rising health consciousness. Competitive dynamics involve established players and emerging innovative companies, leading to a dynamic landscape with continuous product development and strategic partnerships to capture market share. While regulatory hurdles and potential fluctuations in raw material prices pose some challenges, the overall market outlook remains exceptionally positive, driven by strong consumer demand and supportive industry trends.
Synbiotic Product Market Company Market Share
Synbiotic Product Market: A Comprehensive Market Report (2019-2033)
This comprehensive report provides an in-depth analysis of the global synbiotic product market, encompassing its dynamics, growth trends, regional performance, and competitive landscape. The study period covers 2019-2033, with 2025 serving as the base and estimated year. The report is crucial for industry professionals, investors, and researchers seeking a holistic understanding of this burgeoning market. The parent market is the broader probiotic and prebiotic market, while the child market focuses specifically on synbiotic products, encompassing food and beverages, dietary supplements, animal feed, and more. The market is projected to reach xx Million units by 2033.
Synbiotic Product Market Dynamics & Structure
This section analyzes the market's competitive intensity, technological advancements, regulatory landscape, and other influencing factors. The report delves into market concentration, revealing the market share held by key players and assessing the level of competition. Technological innovation, including advancements in formulation and delivery systems, is examined alongside its impact on market growth. Regulatory frameworks and their effect on product development and market access are thoroughly explored. The report also considers substitute products and their competitive threat, analyzing consumer preferences and their influence on market demand. Finally, mergers and acquisitions (M&A) activity within the industry is assessed, quantifying deal volumes and analyzing their implications for market structure.
- Market Concentration: xx% held by top 5 players in 2024.
- Technological Innovation Drivers: Improved encapsulation technologies, targeted delivery systems.
- Regulatory Frameworks: Varying regulations across different geographies impacting market entry.
- Competitive Product Substitutes: Individual probiotic and prebiotic products.
- End-user Demographics: Growing health-conscious population driving demand.
- M&A Trends: xx M&A deals recorded between 2019 and 2024.
Synbiotic Product Market Growth Trends & Insights
This section provides a detailed analysis of the synbiotic product market's growth trajectory, utilizing various data points and methodologies to provide a comprehensive understanding. The report meticulously tracks the evolution of market size from 2019 to 2024, projecting future growth until 2033. Adoption rates across various segments are analyzed, highlighting factors driving or hindering market penetration. Technological disruptions and their impact on market dynamics are explored, focusing on innovations influencing product development and consumer preferences. The report also examines shifts in consumer behavior, analyzing factors like increasing health awareness and changing dietary habits that contribute to market growth. Key metrics, such as the Compound Annual Growth Rate (CAGR) and market penetration rates, are presented to offer deep insights into market performance.
Dominant Regions, Countries, or Segments in Synbiotic Product Market
This section pinpoints the leading regions, countries, and segments within the synbiotic product market, explaining the factors driving their dominance. The analysis focuses on both the By Product Type segments (Food and Beverage, Dietary Supplements, Animal Feed, Others) and the By Distribution Channel segments (Pharmacies/Health Stores, Supermarkets/Hypermarkets, Convenience Stores, Online Retail Stores, Others). Key drivers are identified using bullet points and analyzed using paragraphs which describe the market share and growth potential of each segment and region.
- North America is projected to dominate due to high consumer awareness and strong regulatory support.
- Europe exhibits significant growth potential owing to increasing demand for functional foods.
- Dietary Supplements segment holds the largest market share due to its targeted health benefits.
- Pharmacies/Health Stores are the leading distribution channel owing to consumer trust and product expertise.
- Key Drivers in specific regions are analyzed - Economic policies encouraging health & wellness, strong retail infrastructure.
Synbiotic Product Market Product Landscape
This section describes the innovative synbiotic products available in the market, highlighting their unique selling propositions (USPs) and technological advancements. It will analyze the various applications of synbiotic products and their performance metrics. The improvements in strain selection, formulation, and delivery methods are covered.
Key Drivers, Barriers & Challenges in Synbiotic Product Market
This section outlines the key drivers propelling the synbiotic product market's growth and significant challenges hindering its expansion.
Key Drivers:
- Increasing consumer awareness of gut health benefits.
- Growing demand for functional foods and dietary supplements.
- Technological advancements in synbiotic formulation and delivery.
Key Challenges:
- Stringent regulatory requirements for synbiotic product approval.
- High research and development costs associated with synbiotic strain development.
- Competition from other functional food and supplement categories.
Emerging Opportunities in Synbiotic Product Market
This section highlights promising avenues for growth in the synbiotic product market. Untapped markets, particularly in developing economies, present considerable opportunities. Innovative applications, such as personalized synbiotics tailored to individual gut microbiomes, represent significant future potential. Evolving consumer preferences towards natural and organic products create opportunities for companies offering sustainably sourced and produced synbiotics.
Growth Accelerators in the Synbiotic Product Market Industry
Technological breakthroughs in strain identification and formulation, enabling the development of highly effective and targeted synbiotics, will accelerate market growth. Strategic partnerships between research institutions, ingredient suppliers, and manufacturers will facilitate innovation and market expansion. Expanding into untapped markets, both geographically and in terms of product applications (e.g., animal health), will drive long-term growth.
Key Players Shaping the Synbiotic Product Market Market
- United Naturals
- Herbalife Nutrition Ltd
- Daflorn Ltd
- Sabinsa Corporation
- Biomin America Inc
- Yakult Honsha Co Inc
- Seed Health Inc
- Probiotical SpA
- Chobani Global Holdings LLC
- Pfizer Inc
Notable Milestones in Synbiotic Product Market Sector
- 2021: Launch of a novel synbiotic product with enhanced stability and efficacy by Company X.
- 2022: Acquisition of a leading synbiotic ingredient supplier by a major food and beverage company.
- 2023: Publication of key clinical trial results demonstrating the effectiveness of a new synbiotic product for gut health.
In-Depth Synbiotic Product Market Market Outlook
The synbiotic product market exhibits strong future potential, driven by sustained consumer interest in gut health, technological innovation, and expansion into new markets. Strategic partnerships and investments in research and development will further propel market growth, leading to the development of personalized and highly effective synbiotic solutions. The market is poised for significant expansion, presenting lucrative opportunities for companies strategically positioned to capitalize on these trends.
Synbiotic Product Market Segmentation
-
1. Product Type
-
1.1. Food and Beverage
- 1.1.1. Dairy
- 1.1.2. Beverages
- 1.1.3. Infant Foods
- 1.1.4. Others
- 1.2. Dietary Supplements
- 1.3. Animal Feed
-
1.1. Food and Beverage
-
2. Distribution Channel
- 2.1. Pharmacies/ Health Stores
- 2.2. Supermarkets/ Hypermarkets
- 2.3. Convenience Stores
- 2.4. Online Retail Stores
- 2.5. Others
Synbiotic Product Market Segmentation By Geography
-
1. North America
- 1.1. United States
- 1.2. Canada
- 1.3. Mexico
- 1.4. Rest of North America
-
2. Europe
- 2.1. United Kingdom
- 2.2. Germany
- 2.3. France
- 2.4. Russia
- 2.5. Italy
- 2.6. Spain
- 2.7. Rest of Europe
-
3. Asia Pacific
- 3.1. India
- 3.2. China
- 3.3. Japan
- 3.4. Australia
- 3.5. Rest of Asia Pacific
-
4. South America
- 4.1. Brazil
- 4.2. Argentina
- 4.3. Rest of South America
-
5. Middle East and Africa
- 5.1. Saudi Arabia
- 5.2. South Africa
- 5.3. Rest of Middle East and Africa
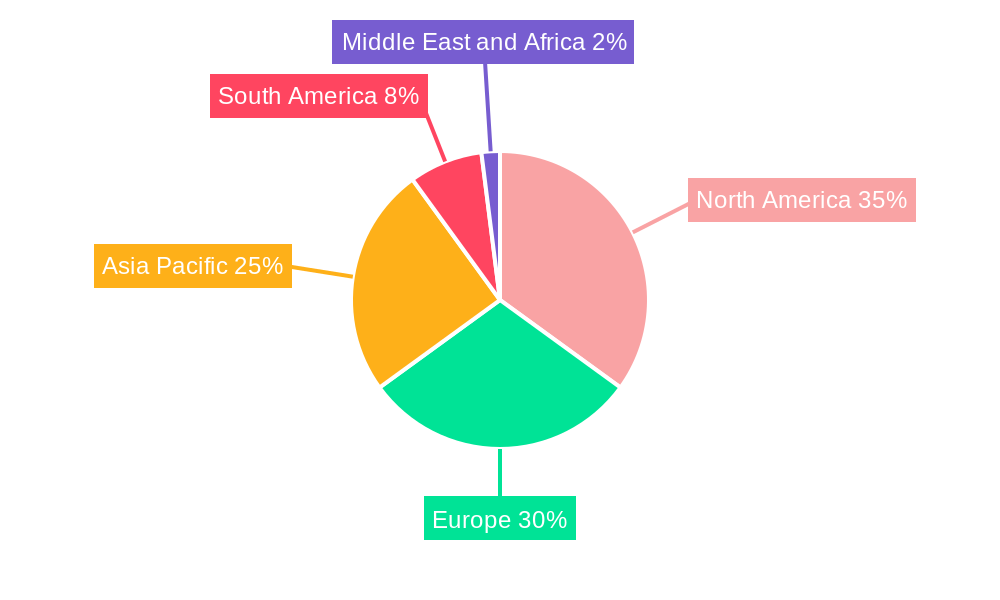
Synbiotic Product Market Regional Market Share
Geographic Coverage of Synbiotic Product Market
Synbiotic Product Market REPORT HIGHLIGHTS
| Aspects | Details |
|---|---|
| Study Period | 2020-2034 |
| Base Year | 2025 |
| Estimated Year | 2026 |
| Forecast Period | 2026-2034 |
| Historical Period | 2020-2025 |
| Growth Rate | CAGR of 8.2% from 2020-2034 |
| Segmentation |
|
Table of Contents
- 1. Introduction
- 1.1. Research Scope
- 1.2. Market Segmentation
- 1.3. Research Objective
- 1.4. Definitions and Assumptions
- 2. Executive Summary
- 2.1. Market Snapshot
- 3. Market Dynamics
- 3.1. Market Drivers
- 3.2. Market Restrains
- 3.3. Market Trends
- 3.4. Market Opportunities
- 4. Market Factor Analysis
- 4.1. Porters Five Forces
- 4.1.1. Bargaining Power of Suppliers
- 4.1.2. Bargaining Power of Buyers
- 4.1.3. Threat of New Entrants
- 4.1.4. Threat of Substitutes
- 4.1.5. Competitive Rivalry
- 4.2. PESTEL analysis
- 4.3. BCG Analysis
- 4.3.1. Stars (High Growth, High Market Share)
- 4.3.2. Cash Cows (Low Growth, High Market Share)
- 4.3.3. Question Mark (High Growth, Low Market Share)
- 4.3.4. Dogs (Low Growth, Low Market Share)
- 4.4. Ansoff Matrix Analysis
- 4.5. Supply Chain Analysis
- 4.6. Regulatory Landscape
- 4.7. Current Market Potential and Opportunity Assessment (TAM–SAM–SOM Framework)
- 4.8. NRP Analyst Note
- 4.1. Porters Five Forces
- 5. Market Analysis, Insights and Forecast 2021-2033
- 5.1. Market Analysis, Insights and Forecast - by Product Type
- 5.1.1. Food and Beverage
- 5.1.1.1. Dairy
- 5.1.1.2. Beverages
- 5.1.1.3. Infant Foods
- 5.1.1.4. Others
- 5.1.2. Dietary Supplements
- 5.1.3. Animal Feed
- 5.1.1. Food and Beverage
- 5.2. Market Analysis, Insights and Forecast - by Distribution Channel
- 5.2.1. Pharmacies/ Health Stores
- 5.2.2. Supermarkets/ Hypermarkets
- 5.2.3. Convenience Stores
- 5.2.4. Online Retail Stores
- 5.2.5. Others
- 5.3. Market Analysis, Insights and Forecast - by Region
- 5.3.1. North America
- 5.3.2. Europe
- 5.3.3. Asia Pacific
- 5.3.4. South America
- 5.3.5. Middle East and Africa
- 5.1. Market Analysis, Insights and Forecast - by Product Type
- 6. Global Synbiotic Product Market Analysis, Insights and Forecast, 2021-2033
- 6.1. Market Analysis, Insights and Forecast - by Product Type
- 6.1.1. Food and Beverage
- 6.1.1.1. Dairy
- 6.1.1.2. Beverages
- 6.1.1.3. Infant Foods
- 6.1.1.4. Others
- 6.1.2. Dietary Supplements
- 6.1.3. Animal Feed
- 6.1.1. Food and Beverage
- 6.2. Market Analysis, Insights and Forecast - by Distribution Channel
- 6.2.1. Pharmacies/ Health Stores
- 6.2.2. Supermarkets/ Hypermarkets
- 6.2.3. Convenience Stores
- 6.2.4. Online Retail Stores
- 6.2.5. Others
- 6.1. Market Analysis, Insights and Forecast - by Product Type
- 7. North America Synbiotic Product Market Analysis, Insights and Forecast, 2020-2032
- 7.1. Market Analysis, Insights and Forecast - by Product Type
- 7.1.1. Food and Beverage
- 7.1.1.1. Dairy
- 7.1.1.2. Beverages
- 7.1.1.3. Infant Foods
- 7.1.1.4. Others
- 7.1.2. Dietary Supplements
- 7.1.3. Animal Feed
- 7.1.1. Food and Beverage
- 7.2. Market Analysis, Insights and Forecast - by Distribution Channel
- 7.2.1. Pharmacies/ Health Stores
- 7.2.2. Supermarkets/ Hypermarkets
- 7.2.3. Convenience Stores
- 7.2.4. Online Retail Stores
- 7.2.5. Others
- 7.1. Market Analysis, Insights and Forecast - by Product Type
- 8. Europe Synbiotic Product Market Analysis, Insights and Forecast, 2020-2032
- 8.1. Market Analysis, Insights and Forecast - by Product Type
- 8.1.1. Food and Beverage
- 8.1.1.1. Dairy
- 8.1.1.2. Beverages
- 8.1.1.3. Infant Foods
- 8.1.1.4. Others
- 8.1.2. Dietary Supplements
- 8.1.3. Animal Feed
- 8.1.1. Food and Beverage
- 8.2. Market Analysis, Insights and Forecast - by Distribution Channel
- 8.2.1. Pharmacies/ Health Stores
- 8.2.2. Supermarkets/ Hypermarkets
- 8.2.3. Convenience Stores
- 8.2.4. Online Retail Stores
- 8.2.5. Others
- 8.1. Market Analysis, Insights and Forecast - by Product Type
- 9. Asia Pacific Synbiotic Product Market Analysis, Insights and Forecast, 2020-2032
- 9.1. Market Analysis, Insights and Forecast - by Product Type
- 9.1.1. Food and Beverage
- 9.1.1.1. Dairy
- 9.1.1.2. Beverages
- 9.1.1.3. Infant Foods
- 9.1.1.4. Others
- 9.1.2. Dietary Supplements
- 9.1.3. Animal Feed
- 9.1.1. Food and Beverage
- 9.2. Market Analysis, Insights and Forecast - by Distribution Channel
- 9.2.1. Pharmacies/ Health Stores
- 9.2.2. Supermarkets/ Hypermarkets
- 9.2.3. Convenience Stores
- 9.2.4. Online Retail Stores
- 9.2.5. Others
- 9.1. Market Analysis, Insights and Forecast - by Product Type
- 10. South America Synbiotic Product Market Analysis, Insights and Forecast, 2020-2032
- 10.1. Market Analysis, Insights and Forecast - by Product Type
- 10.1.1. Food and Beverage
- 10.1.1.1. Dairy
- 10.1.1.2. Beverages
- 10.1.1.3. Infant Foods
- 10.1.1.4. Others
- 10.1.2. Dietary Supplements
- 10.1.3. Animal Feed
- 10.1.1. Food and Beverage
- 10.2. Market Analysis, Insights and Forecast - by Distribution Channel
- 10.2.1. Pharmacies/ Health Stores
- 10.2.2. Supermarkets/ Hypermarkets
- 10.2.3. Convenience Stores
- 10.2.4. Online Retail Stores
- 10.2.5. Others
- 10.1. Market Analysis, Insights and Forecast - by Product Type
- 11. Middle East and Africa Synbiotic Product Market Analysis, Insights and Forecast, 2020-2032
- 11.1. Market Analysis, Insights and Forecast - by Product Type
- 11.1.1. Food and Beverage
- 11.1.1.1. Dairy
- 11.1.1.2. Beverages
- 11.1.1.3. Infant Foods
- 11.1.1.4. Others
- 11.1.2. Dietary Supplements
- 11.1.3. Animal Feed
- 11.1.1. Food and Beverage
- 11.2. Market Analysis, Insights and Forecast - by Distribution Channel
- 11.2.1. Pharmacies/ Health Stores
- 11.2.2. Supermarkets/ Hypermarkets
- 11.2.3. Convenience Stores
- 11.2.4. Online Retail Stores
- 11.2.5. Others
- 11.1. Market Analysis, Insights and Forecast - by Product Type
- 12. Competitive Analysis
- 12.1. Company Profiles
- 12.1.1 United Naturals
- 12.1.1.1. Company Overview
- 12.1.1.2. Products
- 12.1.1.3. Company Financials
- 12.1.1.4. SWOT Analysis
- 12.1.2 Herbalife Nutrition Ltd
- 12.1.2.1. Company Overview
- 12.1.2.2. Products
- 12.1.2.3. Company Financials
- 12.1.2.4. SWOT Analysis
- 12.1.3 Daflorn Ltd *List Not Exhaustive
- 12.1.3.1. Company Overview
- 12.1.3.2. Products
- 12.1.3.3. Company Financials
- 12.1.3.4. SWOT Analysis
- 12.1.4 Sabinsa Corporation
- 12.1.4.1. Company Overview
- 12.1.4.2. Products
- 12.1.4.3. Company Financials
- 12.1.4.4. SWOT Analysis
- 12.1.5 Biomin America Inc
- 12.1.5.1. Company Overview
- 12.1.5.2. Products
- 12.1.5.3. Company Financials
- 12.1.5.4. SWOT Analysis
- 12.1.6 Yakult Honsha Co Inc
- 12.1.6.1. Company Overview
- 12.1.6.2. Products
- 12.1.6.3. Company Financials
- 12.1.6.4. SWOT Analysis
- 12.1.7 Seed Health Inc
- 12.1.7.1. Company Overview
- 12.1.7.2. Products
- 12.1.7.3. Company Financials
- 12.1.7.4. SWOT Analysis
- 12.1.8 Probiotical SpA
- 12.1.8.1. Company Overview
- 12.1.8.2. Products
- 12.1.8.3. Company Financials
- 12.1.8.4. SWOT Analysis
- 12.1.9 Chobani Global Holdings LLC
- 12.1.9.1. Company Overview
- 12.1.9.2. Products
- 12.1.9.3. Company Financials
- 12.1.9.4. SWOT Analysis
- 12.1.10 Pfizer Inc
- 12.1.10.1. Company Overview
- 12.1.10.2. Products
- 12.1.10.3. Company Financials
- 12.1.10.4. SWOT Analysis
- 12.1.1 United Naturals
- 12.2. Market Entropy
- 12.2.1 Company's Key Areas Served
- 12.2.2 Recent Developments
- 12.3. Company Market Share Analysis 2025
- 12.3.1 Top 5 Companies Market Share Analysis
- 12.3.2 Top 3 Companies Market Share Analysis
- 12.4. List of Potential Customers
- 13. Research Methodology
List of Figures
- Figure 1: Global Synbiotic Product Market Revenue Breakdown (billion, %) by Region 2025 & 2033
- Figure 2: North America Synbiotic Product Market Revenue (billion), by Product Type 2025 & 2033
- Figure 3: North America Synbiotic Product Market Revenue Share (%), by Product Type 2025 & 2033
- Figure 4: North America Synbiotic Product Market Revenue (billion), by Distribution Channel 2025 & 2033
- Figure 5: North America Synbiotic Product Market Revenue Share (%), by Distribution Channel 2025 & 2033
- Figure 6: North America Synbiotic Product Market Revenue (billion), by Country 2025 & 2033
- Figure 7: North America Synbiotic Product Market Revenue Share (%), by Country 2025 & 2033
- Figure 8: Europe Synbiotic Product Market Revenue (billion), by Product Type 2025 & 2033
- Figure 9: Europe Synbiotic Product Market Revenue Share (%), by Product Type 2025 & 2033
- Figure 10: Europe Synbiotic Product Market Revenue (billion), by Distribution Channel 2025 & 2033
- Figure 11: Europe Synbiotic Product Market Revenue Share (%), by Distribution Channel 2025 & 2033
- Figure 12: Europe Synbiotic Product Market Revenue (billion), by Country 2025 & 2033
- Figure 13: Europe Synbiotic Product Market Revenue Share (%), by Country 2025 & 2033
- Figure 14: Asia Pacific Synbiotic Product Market Revenue (billion), by Product Type 2025 & 2033
- Figure 15: Asia Pacific Synbiotic Product Market Revenue Share (%), by Product Type 2025 & 2033
- Figure 16: Asia Pacific Synbiotic Product Market Revenue (billion), by Distribution Channel 2025 & 2033
- Figure 17: Asia Pacific Synbiotic Product Market Revenue Share (%), by Distribution Channel 2025 & 2033
- Figure 18: Asia Pacific Synbiotic Product Market Revenue (billion), by Country 2025 & 2033
- Figure 19: Asia Pacific Synbiotic Product Market Revenue Share (%), by Country 2025 & 2033
- Figure 20: South America Synbiotic Product Market Revenue (billion), by Product Type 2025 & 2033
- Figure 21: South America Synbiotic Product Market Revenue Share (%), by Product Type 2025 & 2033
- Figure 22: South America Synbiotic Product Market Revenue (billion), by Distribution Channel 2025 & 2033
- Figure 23: South America Synbiotic Product Market Revenue Share (%), by Distribution Channel 2025 & 2033
- Figure 24: South America Synbiotic Product Market Revenue (billion), by Country 2025 & 2033
- Figure 25: South America Synbiotic Product Market Revenue Share (%), by Country 2025 & 2033
- Figure 26: Middle East and Africa Synbiotic Product Market Revenue (billion), by Product Type 2025 & 2033
- Figure 27: Middle East and Africa Synbiotic Product Market Revenue Share (%), by Product Type 2025 & 2033
- Figure 28: Middle East and Africa Synbiotic Product Market Revenue (billion), by Distribution Channel 2025 & 2033
- Figure 29: Middle East and Africa Synbiotic Product Market Revenue Share (%), by Distribution Channel 2025 & 2033
- Figure 30: Middle East and Africa Synbiotic Product Market Revenue (billion), by Country 2025 & 2033
- Figure 31: Middle East and Africa Synbiotic Product Market Revenue Share (%), by Country 2025 & 2033
List of Tables
- Table 1: Global Synbiotic Product Market Revenue billion Forecast, by Product Type 2020 & 2033
- Table 2: Global Synbiotic Product Market Revenue billion Forecast, by Distribution Channel 2020 & 2033
- Table 3: Global Synbiotic Product Market Revenue billion Forecast, by Region 2020 & 2033
- Table 4: Global Synbiotic Product Market Revenue billion Forecast, by Product Type 2020 & 2033
- Table 5: Global Synbiotic Product Market Revenue billion Forecast, by Distribution Channel 2020 & 2033
- Table 6: Global Synbiotic Product Market Revenue billion Forecast, by Country 2020 & 2033
- Table 7: United States Synbiotic Product Market Revenue (billion) Forecast, by Application 2020 & 2033
- Table 8: Canada Synbiotic Product Market Revenue (billion) Forecast, by Application 2020 & 2033
- Table 9: Mexico Synbiotic Product Market Revenue (billion) Forecast, by Application 2020 & 2033
- Table 10: Rest of North America Synbiotic Product Market Revenue (billion) Forecast, by Application 2020 & 2033
- Table 11: Global Synbiotic Product Market Revenue billion Forecast, by Product Type 2020 & 2033
- Table 12: Global Synbiotic Product Market Revenue billion Forecast, by Distribution Channel 2020 & 2033
- Table 13: Global Synbiotic Product Market Revenue billion Forecast, by Country 2020 & 2033
- Table 14: United Kingdom Synbiotic Product Market Revenue (billion) Forecast, by Application 2020 & 2033
- Table 15: Germany Synbiotic Product Market Revenue (billion) Forecast, by Application 2020 & 2033
- Table 16: France Synbiotic Product Market Revenue (billion) Forecast, by Application 2020 & 2033
- Table 17: Russia Synbiotic Product Market Revenue (billion) Forecast, by Application 2020 & 2033
- Table 18: Italy Synbiotic Product Market Revenue (billion) Forecast, by Application 2020 & 2033
- Table 19: Spain Synbiotic Product Market Revenue (billion) Forecast, by Application 2020 & 2033
- Table 20: Rest of Europe Synbiotic Product Market Revenue (billion) Forecast, by Application 2020 & 2033
- Table 21: Global Synbiotic Product Market Revenue billion Forecast, by Product Type 2020 & 2033
- Table 22: Global Synbiotic Product Market Revenue billion Forecast, by Distribution Channel 2020 & 2033
- Table 23: Global Synbiotic Product Market Revenue billion Forecast, by Country 2020 & 2033
- Table 24: India Synbiotic Product Market Revenue (billion) Forecast, by Application 2020 & 2033
- Table 25: China Synbiotic Product Market Revenue (billion) Forecast, by Application 2020 & 2033
- Table 26: Japan Synbiotic Product Market Revenue (billion) Forecast, by Application 2020 & 2033
- Table 27: Australia Synbiotic Product Market Revenue (billion) Forecast, by Application 2020 & 2033
- Table 28: Rest of Asia Pacific Synbiotic Product Market Revenue (billion) Forecast, by Application 2020 & 2033
- Table 29: Global Synbiotic Product Market Revenue billion Forecast, by Product Type 2020 & 2033
- Table 30: Global Synbiotic Product Market Revenue billion Forecast, by Distribution Channel 2020 & 2033
- Table 31: Global Synbiotic Product Market Revenue billion Forecast, by Country 2020 & 2033
- Table 32: Brazil Synbiotic Product Market Revenue (billion) Forecast, by Application 2020 & 2033
- Table 33: Argentina Synbiotic Product Market Revenue (billion) Forecast, by Application 2020 & 2033
- Table 34: Rest of South America Synbiotic Product Market Revenue (billion) Forecast, by Application 2020 & 2033
- Table 35: Global Synbiotic Product Market Revenue billion Forecast, by Product Type 2020 & 2033
- Table 36: Global Synbiotic Product Market Revenue billion Forecast, by Distribution Channel 2020 & 2033
- Table 37: Global Synbiotic Product Market Revenue billion Forecast, by Country 2020 & 2033
- Table 38: Saudi Arabia Synbiotic Product Market Revenue (billion) Forecast, by Application 2020 & 2033
- Table 39: South Africa Synbiotic Product Market Revenue (billion) Forecast, by Application 2020 & 2033
- Table 40: Rest of Middle East and Africa Synbiotic Product Market Revenue (billion) Forecast, by Application 2020 & 2033
Frequently Asked Questions
1. What is the projected Compound Annual Growth Rate (CAGR) of the Synbiotic Product Market?
The projected CAGR is approximately 8.2%.
2. Which companies are prominent players in the Synbiotic Product Market?
Key companies in the market include United Naturals, Herbalife Nutrition Ltd, Daflorn Ltd *List Not Exhaustive, Sabinsa Corporation, Biomin America Inc, Yakult Honsha Co Inc, Seed Health Inc, Probiotical SpA, Chobani Global Holdings LLC, Pfizer Inc.
3. What are the main segments of the Synbiotic Product Market?
The market segments include Product Type, Distribution Channel.
4. Can you provide details about the market size?
The market size is estimated to be USD 14.78 billion as of 2022.
5. What are some drivers contributing to market growth?
Increasing Demand for Protein-Rich Food; Increasing Demand for Plant-Based and Organic Ingredients.
6. What are the notable trends driving market growth?
Rising Demand For Probiotics And Prebiotics as Functional Food.
7. Are there any restraints impacting market growth?
Presence of Alternative Proteins.
8. Can you provide examples of recent developments in the market?
N/A
9. What pricing options are available for accessing the report?
Pricing options include single-user, multi-user, and enterprise licenses priced at USD 4750, USD 5250, and USD 8750 respectively.
10. Is the market size provided in terms of value or volume?
The market size is provided in terms of value, measured in billion.
11. Are there any specific market keywords associated with the report?
Yes, the market keyword associated with the report is "Synbiotic Product Market," which aids in identifying and referencing the specific market segment covered.
12. How do I determine which pricing option suits my needs best?
The pricing options vary based on user requirements and access needs. Individual users may opt for single-user licenses, while businesses requiring broader access may choose multi-user or enterprise licenses for cost-effective access to the report.
13. Are there any additional resources or data provided in the Synbiotic Product Market report?
While the report offers comprehensive insights, it's advisable to review the specific contents or supplementary materials provided to ascertain if additional resources or data are available.
14. How can I stay updated on further developments or reports in the Synbiotic Product Market?
To stay informed about further developments, trends, and reports in the Synbiotic Product Market, consider subscribing to industry newsletters, following relevant companies and organizations, or regularly checking reputable industry news sources and publications.
Methodology
Step 1 - Identification of Relevant Samples Size from Population Database


Step 2 - Approaches for Defining Global Market Size (Value, Volume* & Price*)

Note*: In applicable scenarios
Step 3 - Data Sources
Primary Research
- Web Analytics
- Survey Reports
- Research Institute
- Latest Research Reports
- Opinion Leaders
Secondary Research
- Annual Reports
- White Paper
- Latest Press Release
- Industry Association
- Paid Database
- Investor Presentations

Step 4 - Data Triangulation
Involves using different sources of information in order to increase the validity of a study
These sources are likely to be stakeholders in a program - participants, other researchers, program staff, other community members, and so on.
Then we put all data in single framework & apply various statistical tools to find out the dynamic on the market.
During the analysis stage, feedback from the stakeholder groups would be compared to determine areas of agreement as well as areas of divergence