

Key Insights
The global whipping cream market is forecast to reach a market size of $12.75 billion by 2025, exhibiting a Compound Annual Growth Rate (CAGR) of 9.86% from 2025 to 2033. Growth is propelled by increasing consumer demand for premium food products, a rise in home baking, and the growing popularity of dairy-free alternatives. The expansion of the foodservice sector further bolsters demand for whipping cream as a versatile culinary ingredient. Advancements in processing and packaging enhance product convenience and shelf-life, broadening consumer appeal.
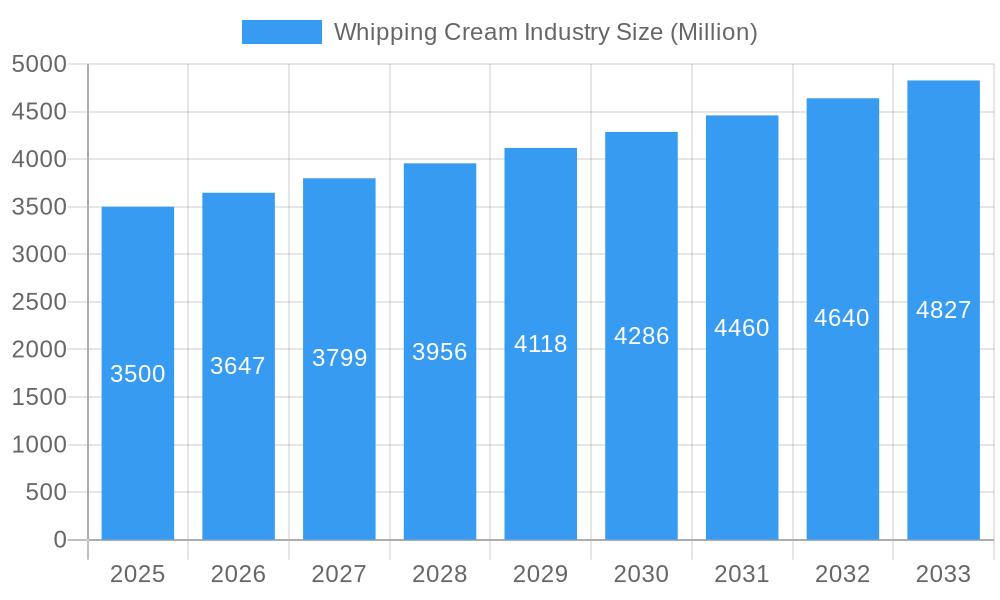
Whipping Cream Industry Market Size (In Billion)
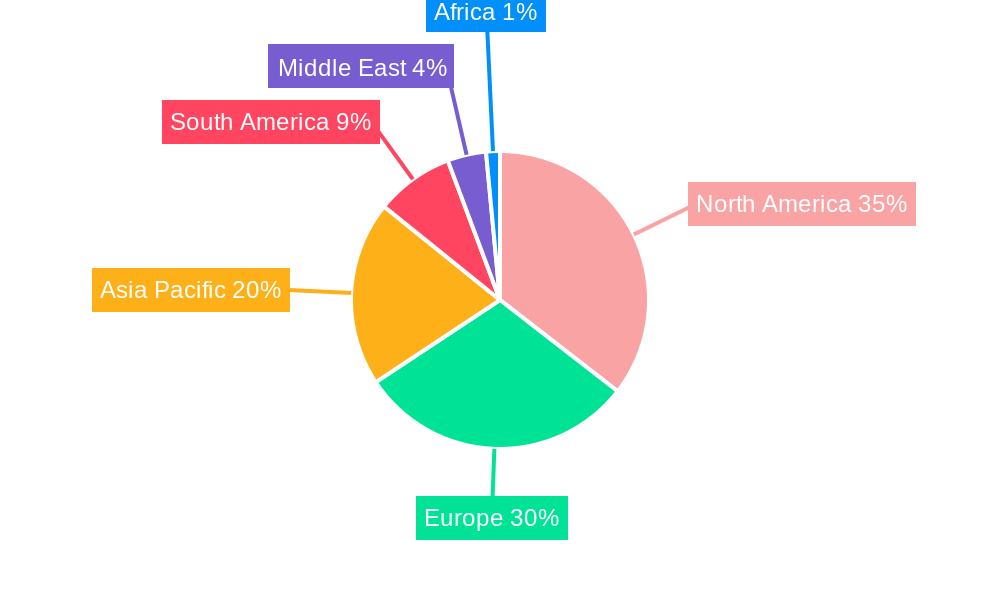
Market segmentation highlights strong demand for both dairy-based and non-dairy whipping creams, addressing diverse dietary needs. Supermarkets/hypermarkets dominate distribution, with online channels experiencing rapid growth. North America and Europe lead market share, while the Asia Pacific region presents significant growth potential due to rising disposable incomes and Western culinary trend adoption. Leading players are strategically expanding product portfolios and global presence.
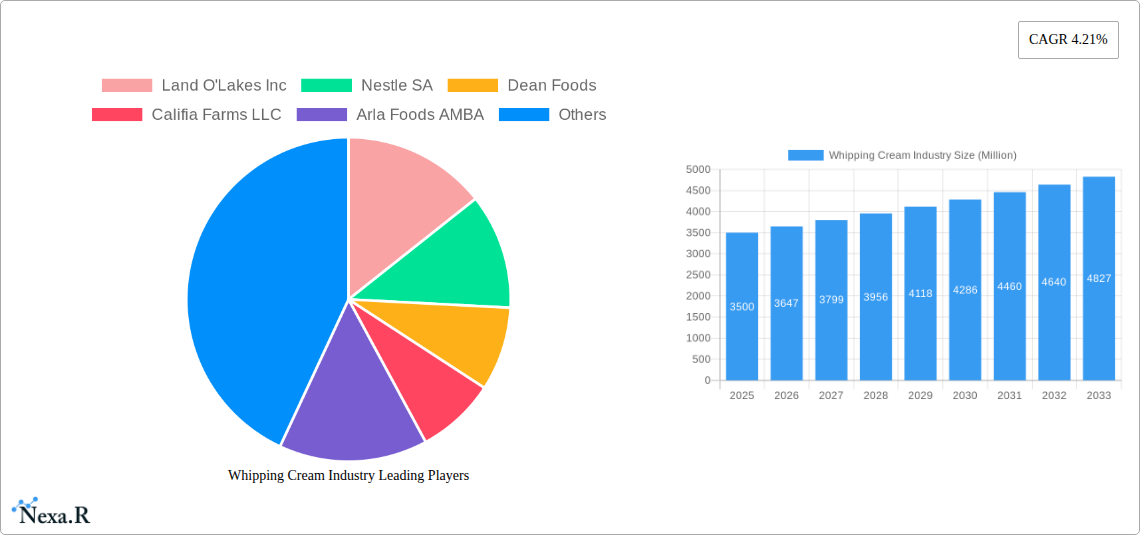
Whipping Cream Industry Company Market Share
Gain strategic insights into the global whipping cream market, driven by evolving consumer preferences for dairy and plant-based alternatives. This report offers comprehensive analysis of market size, growth, and competitive landscapes, examining the dairy product parent market and the expanding plant-based cream child market. Understand key trends, technological advancements, and regional dynamics to inform strategic decision-making.
Whipping Cream Industry Market Dynamics & Structure
The whipping cream industry is characterized by a moderate to high market concentration, with leading players like Land O'Lakes Inc., Nestle SA, and Dean Foods holding significant shares in the dairy-based whipping cream segment. Technological innovation is primarily driven by the demand for improved shelf-life, enhanced whipping stability, and the development of vegan whipping cream and plant-based whipping cream alternatives, as evidenced by the launches from Califia Farms LLC and Oatly. Regulatory frameworks concerning food safety, labeling, and ingredient sourcing play a crucial role in shaping product development and market entry. Competitive product substitutes, ranging from traditional dairy creams to a growing array of non-dairy creamers and specialized whippable plant-based creams, are intensifying competition. End-user demographics are diverse, encompassing home bakers, professional chefs, and consumers seeking convenient dessert solutions. Merger and acquisition (M&A) trends are observed as larger dairy cooperatives and food conglomerates seek to expand their portfolios into the burgeoning plant-based cream market.
- Market Concentration: Dominated by a few key players in the dairy segment, with increasing fragmentation in the non-dairy sector.
- Technological Innovation: Focus on stability, shelf-life, and the development of plant-based alternatives.
- Regulatory Frameworks: Compliance with food safety standards and evolving labeling requirements for vegan whipping cream.
- Competitive Substitutes: Growing threat from a wide range of plant-based alternatives.
- End-User Demographics: Home consumers, professional kitchens, and the foodservice industry.
- M&A Trends: Consolidation and strategic acquisitions to tap into the non-dairy whipping cream market.
Whipping Cream Industry Growth Trends & Insights
The whipping cream industry is poised for robust growth, driven by a confluence of factors shaping market size and adoption rates. The global market is projected to witness a Compound Annual Growth Rate (CAGR) of approximately 5.2% from 2025 to 2033, with a market size estimated at $9,850 million units in the base year 2025. This expansion is fueled by increasing disposable incomes, a growing demand for convenience food products, and a significant shift in consumer preferences towards healthier and more sustainable options. Technological disruptions are actively reshaping the product landscape, particularly the advent and rapid adoption of non-dairy whipping cream and plant-based whipping cream. Products like Califia Farms' heavy whip cream and Oatly's whippable vegan cream exemplify this innovation, catering to the rising vegan and flexitarian population.
Consumer behavior is demonstrably shifting. The health-conscious segment is increasingly seeking dairy-free options, perceiving them as lighter and more digestible. Simultaneously, the culinary world is embracing plant-based whipping cream for its versatility in both sweet and savory applications, often without compromising on texture or taste. This has led to increased market penetration of these alternatives, challenging the dominance of traditional dairy-based products. The online retail channel is emerging as a significant growth driver, offering wider accessibility and a broader selection of niche and specialty whipping creams. Furthermore, the trend towards at-home baking and dessert preparation, amplified during recent global events, continues to sustain demand for whipping creams across all categories. The parent market (dairy whipping cream) is expected to maintain steady growth, while the child market (non-dairy whipping cream) will exhibit higher growth rates due to its novelty and alignment with current consumer trends.
Dominant Regions, Countries, or Segments in Whipping Cream Industry
The Supermarkets/Hypermarkets distribution channel is currently the dominant segment within the whipping cream industry, accounting for an estimated 45% of the global market share in 2025. This dominance is attributed to the extensive reach and accessibility of these retail formats, catering to a broad spectrum of consumers seeking both dairy-based whipping cream and the increasingly available non-dairy whipping cream. North America, particularly the United States and Canada, stands out as the leading region, driven by high per capita consumption of dairy products, a well-established foodservice sector, and a rapidly growing consumer base for plant-based alternatives.
- Dominant Distribution Channel: Supermarkets/Hypermarkets are the primary sales avenue due to widespread availability and consumer shopping habits.
- Market Share: Projected to hold over 45% of the global market by 2025.
- Key Drivers: Convenience, product variety, and promotional activities.
- Leading Region: North America exhibits significant market leadership.
- Market Share: Estimated to capture over 35% of the global whipping cream market by 2025.
- Key Drivers: High consumer spending, strong dairy industry, and early adoption of plant-based trends.
- Dominant Segment (Type): Dairy-based whipping cream continues to hold a significant share, but the non-dairy-based whipping cream segment is experiencing accelerated growth.
- Dairy-based: Strong consumer loyalty and established culinary applications.
- Non-dairy-based: Rapidly expanding due to veganism, lactose intolerance, and environmental concerns, representing a significant growth opportunity.
- Growth Potential in Online Stores: The Online Stores segment is exhibiting the highest growth potential, projected to expand at a CAGR of 7.8% during the forecast period (2025-2033), driven by e-commerce penetration and demand for specialized products.
Whipping Cream Industry Product Landscape
The whipping cream industry is witnessing a surge in product innovation, focusing on enhanced functionality and diverse ingredient bases. Beyond traditional dairy, advancements in non-dairy whipping cream formulations are creating exciting possibilities. Products like coconut-based, oat-based, and soy-based whipping creams offer comparable whipping textures and stability, making them ideal for vegan and dairy-free culinary applications. Key applications span from home baking and dessert embellishments to professional pastry arts and savory dishes. Performance metrics such as whipping volume, stability, and flavor profile are critical differentiators, with new formulations aiming to achieve superior results.
Key Drivers, Barriers & Challenges in Whipping Cream Industry
Key Drivers:
- Growing demand for convenience foods and desserts: Simplifies meal preparation and enhances culinary experiences.
- Increasing consumer preference for plant-based and vegan options: Driven by health, ethical, and environmental concerns, fueling the non-dairy whipping cream market.
- Rising disposable incomes: Enables greater purchasing power for premium and specialty products.
- Technological advancements in formulation and processing: Improving shelf-life, whipping quality, and flavor profiles for both dairy and non-dairy options.
Barriers & Challenges:
- Price volatility of raw materials (e.g., dairy fat, plant-based oils): Impacts production costs and final product pricing.
- Supply chain disruptions: Affecting ingredient availability and timely delivery of finished goods.
- Intense competition from established brands and new entrants: Particularly in the rapidly growing plant-based cream segment.
- Consumer perception and acceptance of non-dairy alternatives: Some consumers may still favor the taste and texture of traditional dairy whipping cream.
- Regulatory hurdles and labeling requirements for new ingredients: Navigating complex food safety and labeling standards.
Emerging Opportunities in Whipping Cream Industry
Emerging opportunities in the whipping cream industry lie in the continued innovation of plant-based whipping cream products tailored to specific dietary needs and preferences, such as allergen-free formulations. The expansion into emerging economies with a growing middle class and increasing adoption of Western culinary trends presents a significant untapped market. Furthermore, the development of "clean label" whipping creams, free from artificial ingredients and preservatives, aligns with a growing consumer demand for healthier and more natural products. The foodservice sector, particularly cafes and bakeries, offers potential for customized product development and partnerships.
Growth Accelerators in the Whipping Cream Industry Industry
Growth acceleration in the whipping cream industry is primarily being driven by significant technological breakthroughs in plant-based ingredient processing, allowing for the creation of high-performing vegan whipping creams that rival dairy counterparts. Strategic partnerships between ingredient suppliers and major food manufacturers are crucial for scaling production and distribution of these innovative products. Market expansion strategies targeting health-conscious consumers, flexitarians, and individuals with lactose intolerance are proving highly effective. The increasing availability of these alternatives through online retail channels is also a key accelerator, making them more accessible to a wider audience.
Key Players Shaping the Whipping Cream Industry Market
- Land O'Lakes Inc.
- Nestle SA
- Dean Foods
- Califia Farms LLC
- Arla Foods AMBA
- The Tatua Co-operative Dairy Company Limited
- Conagra Brands Inc
- FrieslandCampina
- Fonterra Co-operative Group
- Gay Lea Foods Co-operative Ltd
Notable Milestones in Whipping Cream Industry Sector
- November 2022: Califia Farms launched a heavy whip cream. It is a plant-based substitute for heavy whipping cream, which is used for whipping, cooking, and baking. The product is claimed to be unflavored and unsweetened and made from coconut oil and plant-based and dairy-free ingredients. It is also gluten-free, non-GMO certified, vegan, and kosher.
- January 2021: Oatly launched a "whippable" vegan cream. The product is claimed to have an 88% lower climate footprint than its dairy counterparts.
In-Depth Whipping Cream Industry Market Outlook
The future outlook for the whipping cream industry is overwhelmingly positive, with sustained growth anticipated from both the traditional dairy and the rapidly expanding non-dairy whipping cream segments. Key growth accelerators include ongoing innovation in plant-based formulations, addressing evolving dietary trends and sustainability concerns. Strategic alliances between ingredient developers and major food manufacturers will be critical in scaling production and ensuring widespread availability. The increasing adoption of e-commerce platforms will further democratize access to a diverse range of whipping cream products, catering to niche markets and specialized consumer needs. The industry is well-positioned to capitalize on the enduring demand for convenient and indulgent food experiences, with plant-based alternatives playing an increasingly pivotal role in shaping market dynamics and capturing new consumer demographics.
Whipping Cream Industry Segmentation
-
1. Type
- 1.1. Dairy-based
- 1.2. Non-Dairy-based
-
2. Distribution Channel
- 2.1. Supermarkets/Hypermarkets
- 2.2. Convenience Stores
- 2.3. Specialist Retailer
- 2.4. Online Stores
- 2.5. Other Distribution Channels
Whipping Cream Industry Segmentation By Geography
-
1. North America
- 1.1. United States
- 1.2. Canada
- 1.3. Mexico
- 1.4. Rest of North America
-
2. Europe
- 2.1. United Kingdom
- 2.2. Germany
- 2.3. Spain
- 2.4. France
- 2.5. Italy
- 2.6. Russia
- 2.7. Rest of Europe
-
3. Asia Pacific
- 3.1. China
- 3.2. Japan
- 3.3. India
- 3.4. Australia
- 3.5. Rest of Asia Pacific
-
4. South America
- 4.1. Brazil
- 4.2. Argentina
- 4.3. Rest of South America
- 5. Middle East
-
6. United Arab Emirates
- 6.1. South Africa
- 6.2. Rest of Middle East
Whipping Cream Industry Regional Market Share
Geographic Coverage of Whipping Cream Industry
Whipping Cream Industry REPORT HIGHLIGHTS
| Aspects | Details |
|---|---|
| Study Period | 2020-2034 |
| Base Year | 2025 |
| Estimated Year | 2026 |
| Forecast Period | 2026-2034 |
| Historical Period | 2020-2025 |
| Growth Rate | CAGR of 9.86% from 2020-2034 |
| Segmentation |
|
Table of Contents
- 1. Introduction
- 1.1. Research Scope
- 1.2. Market Segmentation
- 1.3. Research Methodology
- 1.4. Definitions and Assumptions
- 2. Executive Summary
- 2.1. Introduction
- 3. Market Dynamics
- 3.1. Introduction
- 3.2. Market Drivers
- 3.2.1. Rising Demand for Convenient Snacking Options; Increase in Demand for New and Innovative Flavored Meat Snacks
- 3.3. Market Restrains
- 3.3.1. Fluctuations in the Price of Raw Materials
- 3.4. Market Trends
- 3.4.1. Non-dairy based Whipping Cream Fueling Market Demand
- 4. Market Factor Analysis
- 4.1. Porters Five Forces
- 4.2. Supply/Value Chain
- 4.3. PESTEL analysis
- 4.4. Market Entropy
- 4.5. Patent/Trademark Analysis
- 5. Global Whipping Cream Industry Analysis, Insights and Forecast, 2020-2032
- 5.1. Market Analysis, Insights and Forecast - by Type
- 5.1.1. Dairy-based
- 5.1.2. Non-Dairy-based
- 5.2. Market Analysis, Insights and Forecast - by Distribution Channel
- 5.2.1. Supermarkets/Hypermarkets
- 5.2.2. Convenience Stores
- 5.2.3. Specialist Retailer
- 5.2.4. Online Stores
- 5.2.5. Other Distribution Channels
- 5.3. Market Analysis, Insights and Forecast - by Region
- 5.3.1. North America
- 5.3.2. Europe
- 5.3.3. Asia Pacific
- 5.3.4. South America
- 5.3.5. Middle East
- 5.3.6. United Arab Emirates
- 5.1. Market Analysis, Insights and Forecast - by Type
- 6. North America Whipping Cream Industry Analysis, Insights and Forecast, 2020-2032
- 6.1. Market Analysis, Insights and Forecast - by Type
- 6.1.1. Dairy-based
- 6.1.2. Non-Dairy-based
- 6.2. Market Analysis, Insights and Forecast - by Distribution Channel
- 6.2.1. Supermarkets/Hypermarkets
- 6.2.2. Convenience Stores
- 6.2.3. Specialist Retailer
- 6.2.4. Online Stores
- 6.2.5. Other Distribution Channels
- 6.1. Market Analysis, Insights and Forecast - by Type
- 7. Europe Whipping Cream Industry Analysis, Insights and Forecast, 2020-2032
- 7.1. Market Analysis, Insights and Forecast - by Type
- 7.1.1. Dairy-based
- 7.1.2. Non-Dairy-based
- 7.2. Market Analysis, Insights and Forecast - by Distribution Channel
- 7.2.1. Supermarkets/Hypermarkets
- 7.2.2. Convenience Stores
- 7.2.3. Specialist Retailer
- 7.2.4. Online Stores
- 7.2.5. Other Distribution Channels
- 7.1. Market Analysis, Insights and Forecast - by Type
- 8. Asia Pacific Whipping Cream Industry Analysis, Insights and Forecast, 2020-2032
- 8.1. Market Analysis, Insights and Forecast - by Type
- 8.1.1. Dairy-based
- 8.1.2. Non-Dairy-based
- 8.2. Market Analysis, Insights and Forecast - by Distribution Channel
- 8.2.1. Supermarkets/Hypermarkets
- 8.2.2. Convenience Stores
- 8.2.3. Specialist Retailer
- 8.2.4. Online Stores
- 8.2.5. Other Distribution Channels
- 8.1. Market Analysis, Insights and Forecast - by Type
- 9. South America Whipping Cream Industry Analysis, Insights and Forecast, 2020-2032
- 9.1. Market Analysis, Insights and Forecast - by Type
- 9.1.1. Dairy-based
- 9.1.2. Non-Dairy-based
- 9.2. Market Analysis, Insights and Forecast - by Distribution Channel
- 9.2.1. Supermarkets/Hypermarkets
- 9.2.2. Convenience Stores
- 9.2.3. Specialist Retailer
- 9.2.4. Online Stores
- 9.2.5. Other Distribution Channels
- 9.1. Market Analysis, Insights and Forecast - by Type
- 10. Middle East Whipping Cream Industry Analysis, Insights and Forecast, 2020-2032
- 10.1. Market Analysis, Insights and Forecast - by Type
- 10.1.1. Dairy-based
- 10.1.2. Non-Dairy-based
- 10.2. Market Analysis, Insights and Forecast - by Distribution Channel
- 10.2.1. Supermarkets/Hypermarkets
- 10.2.2. Convenience Stores
- 10.2.3. Specialist Retailer
- 10.2.4. Online Stores
- 10.2.5. Other Distribution Channels
- 10.1. Market Analysis, Insights and Forecast - by Type
- 11. United Arab Emirates Whipping Cream Industry Analysis, Insights and Forecast, 2020-2032
- 11.1. Market Analysis, Insights and Forecast - by Type
- 11.1.1. Dairy-based
- 11.1.2. Non-Dairy-based
- 11.2. Market Analysis, Insights and Forecast - by Distribution Channel
- 11.2.1. Supermarkets/Hypermarkets
- 11.2.2. Convenience Stores
- 11.2.3. Specialist Retailer
- 11.2.4. Online Stores
- 11.2.5. Other Distribution Channels
- 11.1. Market Analysis, Insights and Forecast - by Type
- 12. Competitive Analysis
- 12.1. Global Market Share Analysis 2025
- 12.2. Company Profiles
- 12.2.1 Land O'Lakes Inc
- 12.2.1.1. Overview
- 12.2.1.2. Products
- 12.2.1.3. SWOT Analysis
- 12.2.1.4. Recent Developments
- 12.2.1.5. Financials (Based on Availability)
- 12.2.2 Nestle SA
- 12.2.2.1. Overview
- 12.2.2.2. Products
- 12.2.2.3. SWOT Analysis
- 12.2.2.4. Recent Developments
- 12.2.2.5. Financials (Based on Availability)
- 12.2.3 Dean Foods
- 12.2.3.1. Overview
- 12.2.3.2. Products
- 12.2.3.3. SWOT Analysis
- 12.2.3.4. Recent Developments
- 12.2.3.5. Financials (Based on Availability)
- 12.2.4 Califia Farms LLC
- 12.2.4.1. Overview
- 12.2.4.2. Products
- 12.2.4.3. SWOT Analysis
- 12.2.4.4. Recent Developments
- 12.2.4.5. Financials (Based on Availability)
- 12.2.5 Arla Foods AMBA
- 12.2.5.1. Overview
- 12.2.5.2. Products
- 12.2.5.3. SWOT Analysis
- 12.2.5.4. Recent Developments
- 12.2.5.5. Financials (Based on Availability)
- 12.2.6 The Tatua Co-operative Dairy Company Limited
- 12.2.6.1. Overview
- 12.2.6.2. Products
- 12.2.6.3. SWOT Analysis
- 12.2.6.4. Recent Developments
- 12.2.6.5. Financials (Based on Availability)
- 12.2.7 Conagra Brands Inc
- 12.2.7.1. Overview
- 12.2.7.2. Products
- 12.2.7.3. SWOT Analysis
- 12.2.7.4. Recent Developments
- 12.2.7.5. Financials (Based on Availability)
- 12.2.8 FrieslandCampina*List Not Exhaustive
- 12.2.8.1. Overview
- 12.2.8.2. Products
- 12.2.8.3. SWOT Analysis
- 12.2.8.4. Recent Developments
- 12.2.8.5. Financials (Based on Availability)
- 12.2.9 Fonterra Co-operative Group
- 12.2.9.1. Overview
- 12.2.9.2. Products
- 12.2.9.3. SWOT Analysis
- 12.2.9.4. Recent Developments
- 12.2.9.5. Financials (Based on Availability)
- 12.2.10 Gay Lea Foods Co-operative Ltd
- 12.2.10.1. Overview
- 12.2.10.2. Products
- 12.2.10.3. SWOT Analysis
- 12.2.10.4. Recent Developments
- 12.2.10.5. Financials (Based on Availability)
- 12.2.1 Land O'Lakes Inc
List of Figures
- Figure 1: Global Whipping Cream Industry Revenue Breakdown (billion, %) by Region 2025 & 2033
- Figure 2: North America Whipping Cream Industry Revenue (billion), by Type 2025 & 2033
- Figure 3: North America Whipping Cream Industry Revenue Share (%), by Type 2025 & 2033
- Figure 4: North America Whipping Cream Industry Revenue (billion), by Distribution Channel 2025 & 2033
- Figure 5: North America Whipping Cream Industry Revenue Share (%), by Distribution Channel 2025 & 2033
- Figure 6: North America Whipping Cream Industry Revenue (billion), by Country 2025 & 2033
- Figure 7: North America Whipping Cream Industry Revenue Share (%), by Country 2025 & 2033
- Figure 8: Europe Whipping Cream Industry Revenue (billion), by Type 2025 & 2033
- Figure 9: Europe Whipping Cream Industry Revenue Share (%), by Type 2025 & 2033
- Figure 10: Europe Whipping Cream Industry Revenue (billion), by Distribution Channel 2025 & 2033
- Figure 11: Europe Whipping Cream Industry Revenue Share (%), by Distribution Channel 2025 & 2033
- Figure 12: Europe Whipping Cream Industry Revenue (billion), by Country 2025 & 2033
- Figure 13: Europe Whipping Cream Industry Revenue Share (%), by Country 2025 & 2033
- Figure 14: Asia Pacific Whipping Cream Industry Revenue (billion), by Type 2025 & 2033
- Figure 15: Asia Pacific Whipping Cream Industry Revenue Share (%), by Type 2025 & 2033
- Figure 16: Asia Pacific Whipping Cream Industry Revenue (billion), by Distribution Channel 2025 & 2033
- Figure 17: Asia Pacific Whipping Cream Industry Revenue Share (%), by Distribution Channel 2025 & 2033
- Figure 18: Asia Pacific Whipping Cream Industry Revenue (billion), by Country 2025 & 2033
- Figure 19: Asia Pacific Whipping Cream Industry Revenue Share (%), by Country 2025 & 2033
- Figure 20: South America Whipping Cream Industry Revenue (billion), by Type 2025 & 2033
- Figure 21: South America Whipping Cream Industry Revenue Share (%), by Type 2025 & 2033
- Figure 22: South America Whipping Cream Industry Revenue (billion), by Distribution Channel 2025 & 2033
- Figure 23: South America Whipping Cream Industry Revenue Share (%), by Distribution Channel 2025 & 2033
- Figure 24: South America Whipping Cream Industry Revenue (billion), by Country 2025 & 2033
- Figure 25: South America Whipping Cream Industry Revenue Share (%), by Country 2025 & 2033
- Figure 26: Middle East Whipping Cream Industry Revenue (billion), by Type 2025 & 2033
- Figure 27: Middle East Whipping Cream Industry Revenue Share (%), by Type 2025 & 2033
- Figure 28: Middle East Whipping Cream Industry Revenue (billion), by Distribution Channel 2025 & 2033
- Figure 29: Middle East Whipping Cream Industry Revenue Share (%), by Distribution Channel 2025 & 2033
- Figure 30: Middle East Whipping Cream Industry Revenue (billion), by Country 2025 & 2033
- Figure 31: Middle East Whipping Cream Industry Revenue Share (%), by Country 2025 & 2033
- Figure 32: United Arab Emirates Whipping Cream Industry Revenue (billion), by Type 2025 & 2033
- Figure 33: United Arab Emirates Whipping Cream Industry Revenue Share (%), by Type 2025 & 2033
- Figure 34: United Arab Emirates Whipping Cream Industry Revenue (billion), by Distribution Channel 2025 & 2033
- Figure 35: United Arab Emirates Whipping Cream Industry Revenue Share (%), by Distribution Channel 2025 & 2033
- Figure 36: United Arab Emirates Whipping Cream Industry Revenue (billion), by Country 2025 & 2033
- Figure 37: United Arab Emirates Whipping Cream Industry Revenue Share (%), by Country 2025 & 2033
List of Tables
- Table 1: Global Whipping Cream Industry Revenue billion Forecast, by Type 2020 & 2033
- Table 2: Global Whipping Cream Industry Revenue billion Forecast, by Distribution Channel 2020 & 2033
- Table 3: Global Whipping Cream Industry Revenue billion Forecast, by Region 2020 & 2033
- Table 4: Global Whipping Cream Industry Revenue billion Forecast, by Type 2020 & 2033
- Table 5: Global Whipping Cream Industry Revenue billion Forecast, by Distribution Channel 2020 & 2033
- Table 6: Global Whipping Cream Industry Revenue billion Forecast, by Country 2020 & 2033
- Table 7: United States Whipping Cream Industry Revenue (billion) Forecast, by Application 2020 & 2033
- Table 8: Canada Whipping Cream Industry Revenue (billion) Forecast, by Application 2020 & 2033
- Table 9: Mexico Whipping Cream Industry Revenue (billion) Forecast, by Application 2020 & 2033
- Table 10: Rest of North America Whipping Cream Industry Revenue (billion) Forecast, by Application 2020 & 2033
- Table 11: Global Whipping Cream Industry Revenue billion Forecast, by Type 2020 & 2033
- Table 12: Global Whipping Cream Industry Revenue billion Forecast, by Distribution Channel 2020 & 2033
- Table 13: Global Whipping Cream Industry Revenue billion Forecast, by Country 2020 & 2033
- Table 14: United Kingdom Whipping Cream Industry Revenue (billion) Forecast, by Application 2020 & 2033
- Table 15: Germany Whipping Cream Industry Revenue (billion) Forecast, by Application 2020 & 2033
- Table 16: Spain Whipping Cream Industry Revenue (billion) Forecast, by Application 2020 & 2033
- Table 17: France Whipping Cream Industry Revenue (billion) Forecast, by Application 2020 & 2033
- Table 18: Italy Whipping Cream Industry Revenue (billion) Forecast, by Application 2020 & 2033
- Table 19: Russia Whipping Cream Industry Revenue (billion) Forecast, by Application 2020 & 2033
- Table 20: Rest of Europe Whipping Cream Industry Revenue (billion) Forecast, by Application 2020 & 2033
- Table 21: Global Whipping Cream Industry Revenue billion Forecast, by Type 2020 & 2033
- Table 22: Global Whipping Cream Industry Revenue billion Forecast, by Distribution Channel 2020 & 2033
- Table 23: Global Whipping Cream Industry Revenue billion Forecast, by Country 2020 & 2033
- Table 24: China Whipping Cream Industry Revenue (billion) Forecast, by Application 2020 & 2033
- Table 25: Japan Whipping Cream Industry Revenue (billion) Forecast, by Application 2020 & 2033
- Table 26: India Whipping Cream Industry Revenue (billion) Forecast, by Application 2020 & 2033
- Table 27: Australia Whipping Cream Industry Revenue (billion) Forecast, by Application 2020 & 2033
- Table 28: Rest of Asia Pacific Whipping Cream Industry Revenue (billion) Forecast, by Application 2020 & 2033
- Table 29: Global Whipping Cream Industry Revenue billion Forecast, by Type 2020 & 2033
- Table 30: Global Whipping Cream Industry Revenue billion Forecast, by Distribution Channel 2020 & 2033
- Table 31: Global Whipping Cream Industry Revenue billion Forecast, by Country 2020 & 2033
- Table 32: Brazil Whipping Cream Industry Revenue (billion) Forecast, by Application 2020 & 2033
- Table 33: Argentina Whipping Cream Industry Revenue (billion) Forecast, by Application 2020 & 2033
- Table 34: Rest of South America Whipping Cream Industry Revenue (billion) Forecast, by Application 2020 & 2033
- Table 35: Global Whipping Cream Industry Revenue billion Forecast, by Type 2020 & 2033
- Table 36: Global Whipping Cream Industry Revenue billion Forecast, by Distribution Channel 2020 & 2033
- Table 37: Global Whipping Cream Industry Revenue billion Forecast, by Country 2020 & 2033
- Table 38: Global Whipping Cream Industry Revenue billion Forecast, by Type 2020 & 2033
- Table 39: Global Whipping Cream Industry Revenue billion Forecast, by Distribution Channel 2020 & 2033
- Table 40: Global Whipping Cream Industry Revenue billion Forecast, by Country 2020 & 2033
- Table 41: South Africa Whipping Cream Industry Revenue (billion) Forecast, by Application 2020 & 2033
- Table 42: Rest of Middle East Whipping Cream Industry Revenue (billion) Forecast, by Application 2020 & 2033
Frequently Asked Questions
1. What is the projected Compound Annual Growth Rate (CAGR) of the Whipping Cream Industry?
The projected CAGR is approximately 9.86%.
2. Which companies are prominent players in the Whipping Cream Industry?
Key companies in the market include Land O'Lakes Inc, Nestle SA, Dean Foods, Califia Farms LLC, Arla Foods AMBA, The Tatua Co-operative Dairy Company Limited, Conagra Brands Inc, FrieslandCampina*List Not Exhaustive, Fonterra Co-operative Group, Gay Lea Foods Co-operative Ltd.
3. What are the main segments of the Whipping Cream Industry?
The market segments include Type, Distribution Channel.
4. Can you provide details about the market size?
The market size is estimated to be USD 12.75 billion as of 2022.
5. What are some drivers contributing to market growth?
Rising Demand for Convenient Snacking Options; Increase in Demand for New and Innovative Flavored Meat Snacks.
6. What are the notable trends driving market growth?
Non-dairy based Whipping Cream Fueling Market Demand.
7. Are there any restraints impacting market growth?
Fluctuations in the Price of Raw Materials.
8. Can you provide examples of recent developments in the market?
November 2022: California Farms launched a heavy whip cream. It is a plant-based substitute for heavy whipping cream, which is used for whipping, cooking, and baking. The product is claimed to be unflavored and unsweetened and made from coconut oil and plant-based and dairy-free ingredients. It is also gluten-free, non-GMO certified, vegan, and kosher.
9. What pricing options are available for accessing the report?
Pricing options include single-user, multi-user, and enterprise licenses priced at USD 4750, USD 5250, and USD 8750 respectively.
10. Is the market size provided in terms of value or volume?
The market size is provided in terms of value, measured in billion.
11. Are there any specific market keywords associated with the report?
Yes, the market keyword associated with the report is "Whipping Cream Industry," which aids in identifying and referencing the specific market segment covered.
12. How do I determine which pricing option suits my needs best?
The pricing options vary based on user requirements and access needs. Individual users may opt for single-user licenses, while businesses requiring broader access may choose multi-user or enterprise licenses for cost-effective access to the report.
13. Are there any additional resources or data provided in the Whipping Cream Industry report?
While the report offers comprehensive insights, it's advisable to review the specific contents or supplementary materials provided to ascertain if additional resources or data are available.
14. How can I stay updated on further developments or reports in the Whipping Cream Industry?
To stay informed about further developments, trends, and reports in the Whipping Cream Industry, consider subscribing to industry newsletters, following relevant companies and organizations, or regularly checking reputable industry news sources and publications.
Methodology
Step 1 - Identification of Relevant Samples Size from Population Database


Step 2 - Approaches for Defining Global Market Size (Value, Volume* & Price*)

Note*: In applicable scenarios
Step 3 - Data Sources
Primary Research
- Web Analytics
- Survey Reports
- Research Institute
- Latest Research Reports
- Opinion Leaders
Secondary Research
- Annual Reports
- White Paper
- Latest Press Release
- Industry Association
- Paid Database
- Investor Presentations

Step 4 - Data Triangulation
Involves using different sources of information in order to increase the validity of a study
These sources are likely to be stakeholders in a program - participants, other researchers, program staff, other community members, and so on.
Then we put all data in single framework & apply various statistical tools to find out the dynamic on the market.
During the analysis stage, feedback from the stakeholder groups would be compared to determine areas of agreement as well as areas of divergence