

Key Insights
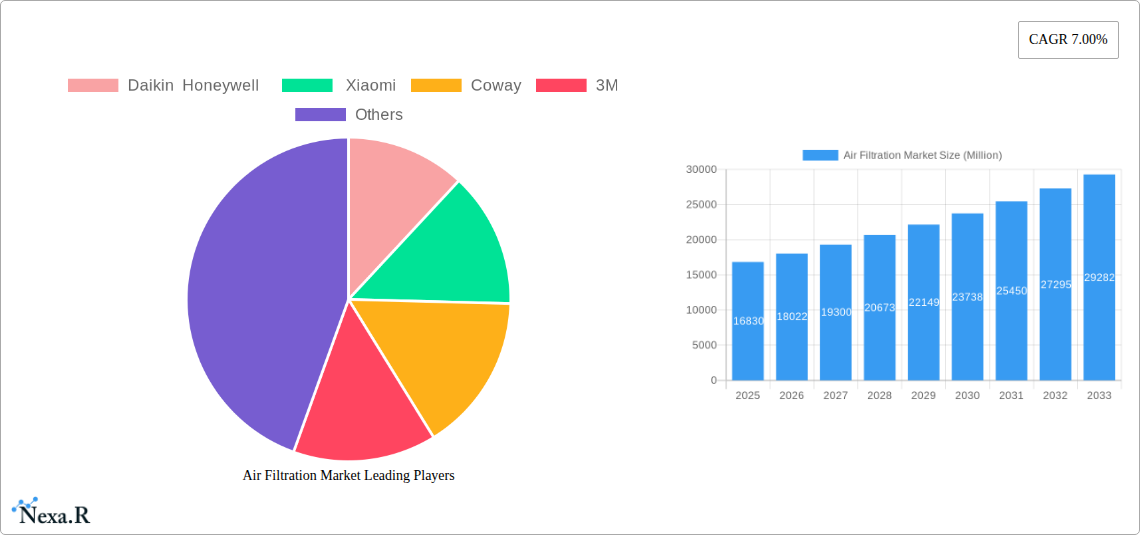
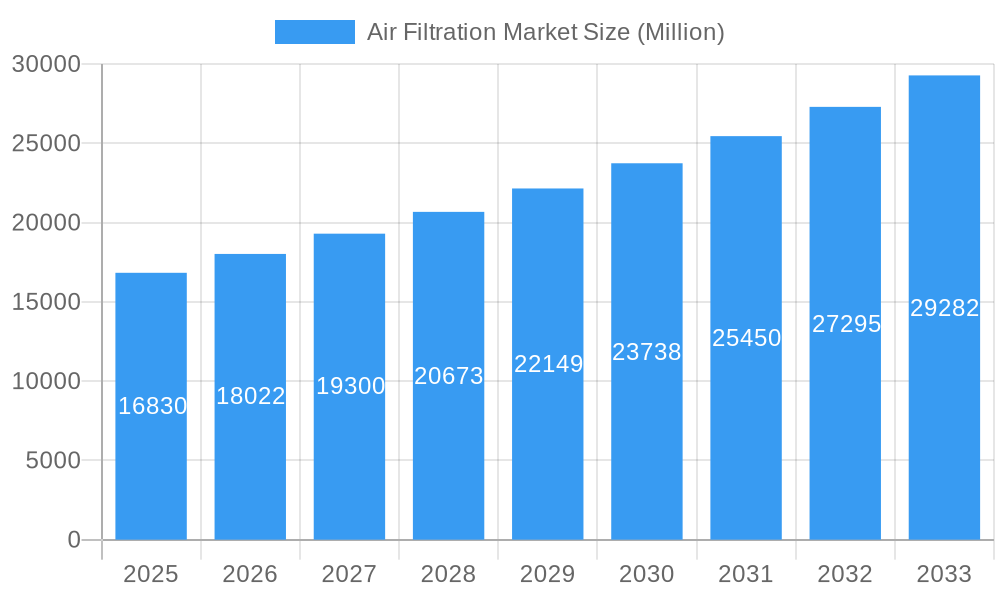
The global air filtration market, valued at $16.83 billion in 2025, is projected to experience robust growth, driven by a compound annual growth rate (CAGR) of 7.00% from 2025 to 2033. This expansion is fueled by several key factors. Increasing urbanization and industrialization lead to higher air pollution levels, boosting demand for effective air purification solutions in both residential and commercial settings. Growing awareness of respiratory health issues and allergies further contributes to consumer adoption of air filtration systems. Technological advancements, such as the development of more efficient HEPA filters and innovative electrostatic precipitators, are enhancing the performance and appeal of these products. Furthermore, the integration of smart home technology and the increasing availability of affordable air purifiers are expanding market accessibility. The market segmentation reveals a strong preference for HEPA filtration technology within the filtration technology segment, while the stand-alone type dominates the product type segment, indicating a significant share of consumer demand. The residential sector accounts for a substantial market share driven by rising disposable incomes and increased awareness of indoor air quality.
Air Filtration Market Market Size (In Billion)
However, market growth faces certain restraints. High initial investment costs associated with advanced filtration systems can restrict accessibility, particularly in developing economies. Furthermore, the energy consumption of some air filtration technologies, especially those requiring continuous operation, could present a concern for consumers and businesses prioritizing energy efficiency. The effectiveness of various filtration technologies also varies depending on the specific pollutants, requiring consumers to carefully consider their specific needs. Nevertheless, ongoing innovation in energy-efficient technologies, coupled with supportive government regulations aimed at improving air quality, is expected to mitigate these challenges and sustain market growth throughout the forecast period. The market's geographic distribution shows strong presence in North America and Europe due to existing infrastructure and environmental regulations, but Asia Pacific is also expected to become a significant contributor to growth in the coming years due to rapid urbanization and economic development.
Air Filtration Market Company Market Share
Air Filtration Market Report: 2019-2033
This comprehensive report provides a detailed analysis of the Air Filtration Market, encompassing its dynamics, growth trends, regional dominance, product landscape, key players, and future outlook. The study period spans from 2019 to 2033, with 2025 serving as the base and estimated year. The report segments the market by filtration technology (HEPA, electrostatic precipitators, ionizers, ozone generators, etc.), type (stand-alone, in-duct), and end-user (residential, commercial, industrial), offering a granular understanding of this vital industry. The market size is projected to reach xx Million units by 2033.
Air Filtration Market Dynamics & Structure
The Air Filtration Market is characterized by moderate concentration, with key players like Daikin, Honeywell, Xiaomi, Coway, and 3M holding significant market share. Technological innovation, particularly in HEPA filtration and smart functionalities, is a major growth driver. Stringent environmental regulations in several regions are also pushing market expansion. Competitive substitutes include natural ventilation systems, but the rising awareness of indoor air quality (IAQ) and increasing occurrences of respiratory illnesses are boosting demand for air filtration solutions. The market is witnessing a rise in M&A activities, with an estimated xx number of deals recorded between 2019 and 2024, primarily driven by companies aiming to expand their product portfolios and geographical reach. End-user demographics show a growing preference for advanced features like smart connectivity and app control, particularly in residential and commercial segments.
- Market Concentration: Moderately concentrated, with top 5 players holding xx% market share in 2024.
- Technological Innovation: Focus on energy efficiency, smart features, and improved filtration capabilities.
- Regulatory Framework: Stringent IAQ regulations driving demand in developed markets.
- Competitive Substitutes: Natural ventilation systems pose a mild competitive threat.
- M&A Activity: xx deals recorded between 2019-2024, indicative of market consolidation.
- Innovation Barriers: High R&D costs and stringent regulatory approvals.
Air Filtration Market Growth Trends & Insights
The Air Filtration Market experienced robust growth during the historical period (2019-2024), with a CAGR of xx%. This growth is projected to continue during the forecast period (2025-2033), albeit at a slightly moderated pace, reaching a CAGR of xx%. This growth is fueled by rising urbanization, increasing disposable incomes in emerging economies, and heightened awareness regarding IAQ issues. Technological disruptions, such as the introduction of IoT-enabled air purifiers and advancements in filtration technologies, are further stimulating market adoption. Consumer behavior is shifting towards premium products with advanced features and longer lifespans. Market penetration remains relatively low in several developing regions, presenting significant untapped potential.
Dominant Regions, Countries, or Segments in Air Filtration Market
North America and Asia-Pacific are the dominant regions, accounting for xx% and xx% of the global market share in 2024, respectively. Within these regions, China and the United States are the leading national markets due to high consumer awareness, stringent environmental regulations, and large populations in urban centers. The HEPA filtration technology segment dominates the market due to its high efficiency in removing particulate matter. The residential segment holds the largest market share, driven by increasing disposable incomes and a growing preference for clean indoor air.
Key Drivers:
- Stringent environmental regulations (e.g., China's air quality standards).
- Rising disposable incomes in emerging economies.
- Growing awareness of IAQ and health benefits.
- Government initiatives promoting energy efficiency.
Dominance Factors: High consumer awareness, strong regulatory support, and established distribution networks.
Air Filtration Market Product Landscape
The Air Filtration Market showcases a diverse range of products, from basic stand-alone units to sophisticated in-duct systems featuring smart connectivity and advanced filtration technologies. Recent innovations include smaller, more energy-efficient designs, improved filtration performance, and integration with smart home ecosystems. Key selling propositions include enhanced purification capabilities, quiet operation, and user-friendly interfaces. The market is witnessing a trend towards multi-functional air purifiers, incorporating features like humidification and deodorization.
Key Drivers, Barriers & Challenges in Air Filtration Market
Key Drivers: Growing concerns over air pollution, rising disposable incomes, and technological advancements in filtration technologies are the major growth drivers. Government regulations supporting energy-efficient appliances also play a role.
Challenges & Restraints: High initial costs of advanced air purifiers, supply chain disruptions impacting component availability, and intense competition among established players pose significant challenges. Stringent regulatory requirements related to product safety and energy efficiency also increase barriers to entry.
Emerging Opportunities in Air Filtration Market
Untapped markets in developing economies, demand for specialized air purifiers for specific allergens (e.g., pet dander, pollen), and integration of air purifiers with smart home technologies offer substantial growth opportunities. The increasing focus on creating sustainable and energy-efficient air purifiers presents another avenue for innovation and market penetration.
Growth Accelerators in the Air Filtration Market Industry
Technological advancements in filtration technologies, strategic partnerships between manufacturers and distributors, and expansion into new geographical markets are key growth accelerators. The growing adoption of IoT-enabled air purifiers and the development of more sustainable solutions are also boosting market growth.
Notable Milestones in Air Filtration Market Sector
- March 2023: Xiaomi Corp. launched the MIJIA full-effect air purifier, boasting a 12,500 liters/minute air volume and 99% virus removal capacity.
- March 2023: Blueair launched the Blue Pure Max, a quiet, robust air purifier capable of cleaning a 1,524 sq ft room in 30 minutes.
In-Depth Air Filtration Market Market Outlook
The Air Filtration Market is poised for sustained growth over the forecast period, driven by a confluence of factors including rising environmental awareness, technological advancements, and increasing disposable incomes globally. Strategic partnerships and investments in R&D will be crucial for companies seeking to capitalize on the emerging opportunities in this dynamic sector. The market’s potential lies in addressing specific needs through customized solutions and expanding into untapped markets.
Air Filtration Market Segmentation
-
1. Filtration Technology
- 1.1. High-efficiency Particulate Air (HEPA)
- 1.2. Other Fi
-
2. Type
- 2.1. Stand-alone
- 2.2. In-duct
-
3. End User
- 3.1. Residential
- 3.2. Commercial
- 3.3. Industrial
Air Filtration Market Segmentation By Geography
-
1. North America
- 1.1. United States
- 1.2. Canada
- 1.3. Rest of North America
-
2. Europe
- 2.1. United Kingdom
- 2.2. Germany
- 2.3. Spain
- 2.4. NORDIC
- 2.5. Russia
- 2.6. Turkey
- 2.7. Italy
- 2.8. Rest of Europe
-
3. Asia Pacific
- 3.1. China
- 3.2. India
- 3.3. Japan
- 3.4. Malaysia
- 3.5. Thailand
- 3.6. Indonesia
- 3.7. Vietnam
- 3.8. Rest of Asia Pacific
-
4. South America
- 4.1. Brazil
- 4.2. Argentina
- 4.3. Colombia
- 4.4. Rest of South America
-
5. Middle East and Africa
- 5.1. United Arab Emirates
- 5.2. Saudi Arabia
- 5.3. South Africa
- 5.4. Nigeria
- 5.5. Qatar
- 5.6. Egypt
- 5.7. Rest of Middle East and Africa
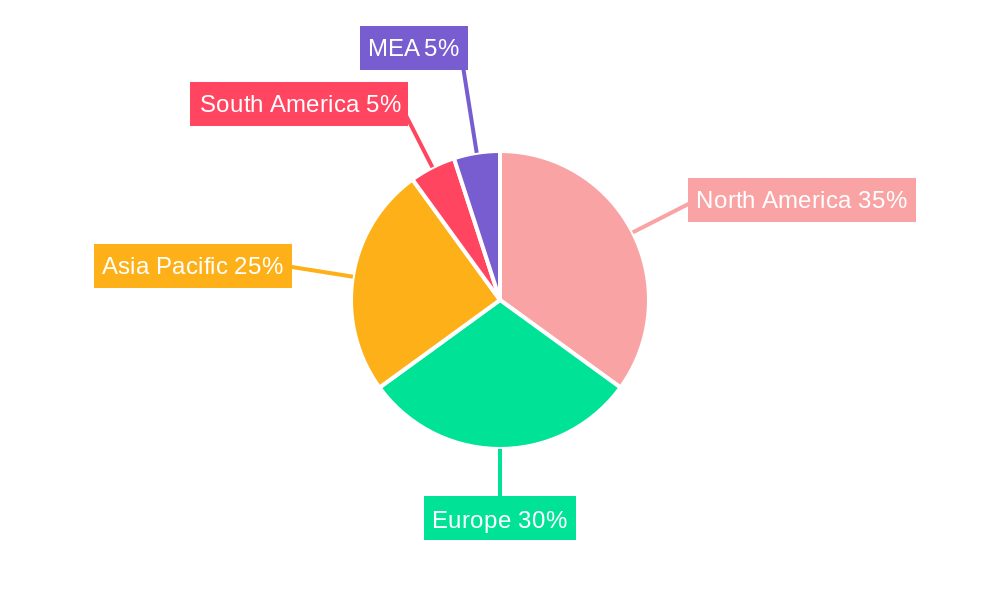
Air Filtration Market Regional Market Share
Geographic Coverage of Air Filtration Market
Air Filtration Market REPORT HIGHLIGHTS
| Aspects | Details |
|---|---|
| Study Period | 2020-2034 |
| Base Year | 2025 |
| Estimated Year | 2026 |
| Forecast Period | 2026-2034 |
| Historical Period | 2020-2025 |
| Growth Rate | CAGR of 7.00% from 2020-2034 |
| Segmentation |
|
Table of Contents
- 1. Introduction
- 1.1. Research Scope
- 1.2. Market Segmentation
- 1.3. Research Objective
- 1.4. Definitions and Assumptions
- 2. Executive Summary
- 2.1. Market Snapshot
- 3. Market Dynamics
- 3.1. Market Drivers
- 3.2. Market Restrains
- 3.3. Market Trends
- 3.4. Market Opportunities
- 4. Market Factor Analysis
- 4.1. Porters Five Forces
- 4.1.1. Bargaining Power of Suppliers
- 4.1.2. Bargaining Power of Buyers
- 4.1.3. Threat of New Entrants
- 4.1.4. Threat of Substitutes
- 4.1.5. Competitive Rivalry
- 4.2. PESTEL analysis
- 4.3. BCG Analysis
- 4.3.1. Stars (High Growth, High Market Share)
- 4.3.2. Cash Cows (Low Growth, High Market Share)
- 4.3.3. Question Mark (High Growth, Low Market Share)
- 4.3.4. Dogs (Low Growth, Low Market Share)
- 4.4. Ansoff Matrix Analysis
- 4.5. Supply Chain Analysis
- 4.6. Regulatory Landscape
- 4.7. Current Market Potential and Opportunity Assessment (TAM–SAM–SOM Framework)
- 4.8. NRP Analyst Note
- 4.1. Porters Five Forces
- 5. Market Analysis, Insights and Forecast 2021-2033
- 5.1. Market Analysis, Insights and Forecast - by Filtration Technology
- 5.1.1. High-efficiency Particulate Air (HEPA)
- 5.1.2. Other Fi
- 5.2. Market Analysis, Insights and Forecast - by Type
- 5.2.1. Stand-alone
- 5.2.2. In-duct
- 5.3. Market Analysis, Insights and Forecast - by End User
- 5.3.1. Residential
- 5.3.2. Commercial
- 5.3.3. Industrial
- 5.4. Market Analysis, Insights and Forecast - by Region
- 5.4.1. North America
- 5.4.2. Europe
- 5.4.3. Asia Pacific
- 5.4.4. South America
- 5.4.5. Middle East and Africa
- 5.1. Market Analysis, Insights and Forecast - by Filtration Technology
- 6. Global Air Filtration Market Analysis, Insights and Forecast, 2021-2033
- 6.1. Market Analysis, Insights and Forecast - by Filtration Technology
- 6.1.1. High-efficiency Particulate Air (HEPA)
- 6.1.2. Other Fi
- 6.2. Market Analysis, Insights and Forecast - by Type
- 6.2.1. Stand-alone
- 6.2.2. In-duct
- 6.3. Market Analysis, Insights and Forecast - by End User
- 6.3.1. Residential
- 6.3.2. Commercial
- 6.3.3. Industrial
- 6.1. Market Analysis, Insights and Forecast - by Filtration Technology
- 7. North America Air Filtration Market Analysis, Insights and Forecast, 2020-2032
- 7.1. Market Analysis, Insights and Forecast - by Filtration Technology
- 7.1.1. High-efficiency Particulate Air (HEPA)
- 7.1.2. Other Fi
- 7.2. Market Analysis, Insights and Forecast - by Type
- 7.2.1. Stand-alone
- 7.2.2. In-duct
- 7.3. Market Analysis, Insights and Forecast - by End User
- 7.3.1. Residential
- 7.3.2. Commercial
- 7.3.3. Industrial
- 7.1. Market Analysis, Insights and Forecast - by Filtration Technology
- 8. Europe Air Filtration Market Analysis, Insights and Forecast, 2020-2032
- 8.1. Market Analysis, Insights and Forecast - by Filtration Technology
- 8.1.1. High-efficiency Particulate Air (HEPA)
- 8.1.2. Other Fi
- 8.2. Market Analysis, Insights and Forecast - by Type
- 8.2.1. Stand-alone
- 8.2.2. In-duct
- 8.3. Market Analysis, Insights and Forecast - by End User
- 8.3.1. Residential
- 8.3.2. Commercial
- 8.3.3. Industrial
- 8.1. Market Analysis, Insights and Forecast - by Filtration Technology
- 9. Asia Pacific Air Filtration Market Analysis, Insights and Forecast, 2020-2032
- 9.1. Market Analysis, Insights and Forecast - by Filtration Technology
- 9.1.1. High-efficiency Particulate Air (HEPA)
- 9.1.2. Other Fi
- 9.2. Market Analysis, Insights and Forecast - by Type
- 9.2.1. Stand-alone
- 9.2.2. In-duct
- 9.3. Market Analysis, Insights and Forecast - by End User
- 9.3.1. Residential
- 9.3.2. Commercial
- 9.3.3. Industrial
- 9.1. Market Analysis, Insights and Forecast - by Filtration Technology
- 10. South America Air Filtration Market Analysis, Insights and Forecast, 2020-2032
- 10.1. Market Analysis, Insights and Forecast - by Filtration Technology
- 10.1.1. High-efficiency Particulate Air (HEPA)
- 10.1.2. Other Fi
- 10.2. Market Analysis, Insights and Forecast - by Type
- 10.2.1. Stand-alone
- 10.2.2. In-duct
- 10.3. Market Analysis, Insights and Forecast - by End User
- 10.3.1. Residential
- 10.3.2. Commercial
- 10.3.3. Industrial
- 10.1. Market Analysis, Insights and Forecast - by Filtration Technology
- 11. Middle East and Africa Air Filtration Market Analysis, Insights and Forecast, 2020-2032
- 11.1. Market Analysis, Insights and Forecast - by Filtration Technology
- 11.1.1. High-efficiency Particulate Air (HEPA)
- 11.1.2. Other Fi
- 11.2. Market Analysis, Insights and Forecast - by Type
- 11.2.1. Stand-alone
- 11.2.2. In-duct
- 11.3. Market Analysis, Insights and Forecast - by End User
- 11.3.1. Residential
- 11.3.2. Commercial
- 11.3.3. Industrial
- 11.1. Market Analysis, Insights and Forecast - by Filtration Technology
- 12. Competitive Analysis
- 12.1. Company Profiles
- 12.1.1 Daikin Honeywell
- 12.1.1.1. Company Overview
- 12.1.1.2. Products
- 12.1.1.3. Company Financials
- 12.1.1.4. SWOT Analysis
- 12.1.2 Xiaomi
- 12.1.2.1. Company Overview
- 12.1.2.2. Products
- 12.1.2.3. Company Financials
- 12.1.2.4. SWOT Analysis
- 12.1.3 Coway
- 12.1.3.1. Company Overview
- 12.1.3.2. Products
- 12.1.3.3. Company Financials
- 12.1.3.4. SWOT Analysis
- 12.1.4 3M
- 12.1.4.1. Company Overview
- 12.1.4.2. Products
- 12.1.4.3. Company Financials
- 12.1.4.4. SWOT Analysis
- 12.1.1 Daikin Honeywell
- 12.2. Market Entropy
- 12.2.1 Company's Key Areas Served
- 12.2.2 Recent Developments
- 12.3. Company Market Share Analysis 2025
- 12.3.1 Top 5 Companies Market Share Analysis
- 12.3.2 Top 3 Companies Market Share Analysis
- 12.4. List of Potential Customers
- 13. Research Methodology
List of Figures
- Figure 1: Global Air Filtration Market Revenue Breakdown (Million, %) by Region 2025 & 2033
- Figure 2: Global Air Filtration Market Volume Breakdown (K Unit, %) by Region 2025 & 2033
- Figure 3: North America Air Filtration Market Revenue (Million), by Filtration Technology 2025 & 2033
- Figure 4: North America Air Filtration Market Volume (K Unit), by Filtration Technology 2025 & 2033
- Figure 5: North America Air Filtration Market Revenue Share (%), by Filtration Technology 2025 & 2033
- Figure 6: North America Air Filtration Market Volume Share (%), by Filtration Technology 2025 & 2033
- Figure 7: North America Air Filtration Market Revenue (Million), by Type 2025 & 2033
- Figure 8: North America Air Filtration Market Volume (K Unit), by Type 2025 & 2033
- Figure 9: North America Air Filtration Market Revenue Share (%), by Type 2025 & 2033
- Figure 10: North America Air Filtration Market Volume Share (%), by Type 2025 & 2033
- Figure 11: North America Air Filtration Market Revenue (Million), by End User 2025 & 2033
- Figure 12: North America Air Filtration Market Volume (K Unit), by End User 2025 & 2033
- Figure 13: North America Air Filtration Market Revenue Share (%), by End User 2025 & 2033
- Figure 14: North America Air Filtration Market Volume Share (%), by End User 2025 & 2033
- Figure 15: North America Air Filtration Market Revenue (Million), by Country 2025 & 2033
- Figure 16: North America Air Filtration Market Volume (K Unit), by Country 2025 & 2033
- Figure 17: North America Air Filtration Market Revenue Share (%), by Country 2025 & 2033
- Figure 18: North America Air Filtration Market Volume Share (%), by Country 2025 & 2033
- Figure 19: Europe Air Filtration Market Revenue (Million), by Filtration Technology 2025 & 2033
- Figure 20: Europe Air Filtration Market Volume (K Unit), by Filtration Technology 2025 & 2033
- Figure 21: Europe Air Filtration Market Revenue Share (%), by Filtration Technology 2025 & 2033
- Figure 22: Europe Air Filtration Market Volume Share (%), by Filtration Technology 2025 & 2033
- Figure 23: Europe Air Filtration Market Revenue (Million), by Type 2025 & 2033
- Figure 24: Europe Air Filtration Market Volume (K Unit), by Type 2025 & 2033
- Figure 25: Europe Air Filtration Market Revenue Share (%), by Type 2025 & 2033
- Figure 26: Europe Air Filtration Market Volume Share (%), by Type 2025 & 2033
- Figure 27: Europe Air Filtration Market Revenue (Million), by End User 2025 & 2033
- Figure 28: Europe Air Filtration Market Volume (K Unit), by End User 2025 & 2033
- Figure 29: Europe Air Filtration Market Revenue Share (%), by End User 2025 & 2033
- Figure 30: Europe Air Filtration Market Volume Share (%), by End User 2025 & 2033
- Figure 31: Europe Air Filtration Market Revenue (Million), by Country 2025 & 2033
- Figure 32: Europe Air Filtration Market Volume (K Unit), by Country 2025 & 2033
- Figure 33: Europe Air Filtration Market Revenue Share (%), by Country 2025 & 2033
- Figure 34: Europe Air Filtration Market Volume Share (%), by Country 2025 & 2033
- Figure 35: Asia Pacific Air Filtration Market Revenue (Million), by Filtration Technology 2025 & 2033
- Figure 36: Asia Pacific Air Filtration Market Volume (K Unit), by Filtration Technology 2025 & 2033
- Figure 37: Asia Pacific Air Filtration Market Revenue Share (%), by Filtration Technology 2025 & 2033
- Figure 38: Asia Pacific Air Filtration Market Volume Share (%), by Filtration Technology 2025 & 2033
- Figure 39: Asia Pacific Air Filtration Market Revenue (Million), by Type 2025 & 2033
- Figure 40: Asia Pacific Air Filtration Market Volume (K Unit), by Type 2025 & 2033
- Figure 41: Asia Pacific Air Filtration Market Revenue Share (%), by Type 2025 & 2033
- Figure 42: Asia Pacific Air Filtration Market Volume Share (%), by Type 2025 & 2033
- Figure 43: Asia Pacific Air Filtration Market Revenue (Million), by End User 2025 & 2033
- Figure 44: Asia Pacific Air Filtration Market Volume (K Unit), by End User 2025 & 2033
- Figure 45: Asia Pacific Air Filtration Market Revenue Share (%), by End User 2025 & 2033
- Figure 46: Asia Pacific Air Filtration Market Volume Share (%), by End User 2025 & 2033
- Figure 47: Asia Pacific Air Filtration Market Revenue (Million), by Country 2025 & 2033
- Figure 48: Asia Pacific Air Filtration Market Volume (K Unit), by Country 2025 & 2033
- Figure 49: Asia Pacific Air Filtration Market Revenue Share (%), by Country 2025 & 2033
- Figure 50: Asia Pacific Air Filtration Market Volume Share (%), by Country 2025 & 2033
- Figure 51: South America Air Filtration Market Revenue (Million), by Filtration Technology 2025 & 2033
- Figure 52: South America Air Filtration Market Volume (K Unit), by Filtration Technology 2025 & 2033
- Figure 53: South America Air Filtration Market Revenue Share (%), by Filtration Technology 2025 & 2033
- Figure 54: South America Air Filtration Market Volume Share (%), by Filtration Technology 2025 & 2033
- Figure 55: South America Air Filtration Market Revenue (Million), by Type 2025 & 2033
- Figure 56: South America Air Filtration Market Volume (K Unit), by Type 2025 & 2033
- Figure 57: South America Air Filtration Market Revenue Share (%), by Type 2025 & 2033
- Figure 58: South America Air Filtration Market Volume Share (%), by Type 2025 & 2033
- Figure 59: South America Air Filtration Market Revenue (Million), by End User 2025 & 2033
- Figure 60: South America Air Filtration Market Volume (K Unit), by End User 2025 & 2033
- Figure 61: South America Air Filtration Market Revenue Share (%), by End User 2025 & 2033
- Figure 62: South America Air Filtration Market Volume Share (%), by End User 2025 & 2033
- Figure 63: South America Air Filtration Market Revenue (Million), by Country 2025 & 2033
- Figure 64: South America Air Filtration Market Volume (K Unit), by Country 2025 & 2033
- Figure 65: South America Air Filtration Market Revenue Share (%), by Country 2025 & 2033
- Figure 66: South America Air Filtration Market Volume Share (%), by Country 2025 & 2033
- Figure 67: Middle East and Africa Air Filtration Market Revenue (Million), by Filtration Technology 2025 & 2033
- Figure 68: Middle East and Africa Air Filtration Market Volume (K Unit), by Filtration Technology 2025 & 2033
- Figure 69: Middle East and Africa Air Filtration Market Revenue Share (%), by Filtration Technology 2025 & 2033
- Figure 70: Middle East and Africa Air Filtration Market Volume Share (%), by Filtration Technology 2025 & 2033
- Figure 71: Middle East and Africa Air Filtration Market Revenue (Million), by Type 2025 & 2033
- Figure 72: Middle East and Africa Air Filtration Market Volume (K Unit), by Type 2025 & 2033
- Figure 73: Middle East and Africa Air Filtration Market Revenue Share (%), by Type 2025 & 2033
- Figure 74: Middle East and Africa Air Filtration Market Volume Share (%), by Type 2025 & 2033
- Figure 75: Middle East and Africa Air Filtration Market Revenue (Million), by End User 2025 & 2033
- Figure 76: Middle East and Africa Air Filtration Market Volume (K Unit), by End User 2025 & 2033
- Figure 77: Middle East and Africa Air Filtration Market Revenue Share (%), by End User 2025 & 2033
- Figure 78: Middle East and Africa Air Filtration Market Volume Share (%), by End User 2025 & 2033
- Figure 79: Middle East and Africa Air Filtration Market Revenue (Million), by Country 2025 & 2033
- Figure 80: Middle East and Africa Air Filtration Market Volume (K Unit), by Country 2025 & 2033
- Figure 81: Middle East and Africa Air Filtration Market Revenue Share (%), by Country 2025 & 2033
- Figure 82: Middle East and Africa Air Filtration Market Volume Share (%), by Country 2025 & 2033
List of Tables
- Table 1: Global Air Filtration Market Revenue Million Forecast, by Filtration Technology 2020 & 2033
- Table 2: Global Air Filtration Market Volume K Unit Forecast, by Filtration Technology 2020 & 2033
- Table 3: Global Air Filtration Market Revenue Million Forecast, by Type 2020 & 2033
- Table 4: Global Air Filtration Market Volume K Unit Forecast, by Type 2020 & 2033
- Table 5: Global Air Filtration Market Revenue Million Forecast, by End User 2020 & 2033
- Table 6: Global Air Filtration Market Volume K Unit Forecast, by End User 2020 & 2033
- Table 7: Global Air Filtration Market Revenue Million Forecast, by Region 2020 & 2033
- Table 8: Global Air Filtration Market Volume K Unit Forecast, by Region 2020 & 2033
- Table 9: Global Air Filtration Market Revenue Million Forecast, by Filtration Technology 2020 & 2033
- Table 10: Global Air Filtration Market Volume K Unit Forecast, by Filtration Technology 2020 & 2033
- Table 11: Global Air Filtration Market Revenue Million Forecast, by Type 2020 & 2033
- Table 12: Global Air Filtration Market Volume K Unit Forecast, by Type 2020 & 2033
- Table 13: Global Air Filtration Market Revenue Million Forecast, by End User 2020 & 2033
- Table 14: Global Air Filtration Market Volume K Unit Forecast, by End User 2020 & 2033
- Table 15: Global Air Filtration Market Revenue Million Forecast, by Country 2020 & 2033
- Table 16: Global Air Filtration Market Volume K Unit Forecast, by Country 2020 & 2033
- Table 17: United States Air Filtration Market Revenue (Million) Forecast, by Application 2020 & 2033
- Table 18: United States Air Filtration Market Volume (K Unit) Forecast, by Application 2020 & 2033
- Table 19: Canada Air Filtration Market Revenue (Million) Forecast, by Application 2020 & 2033
- Table 20: Canada Air Filtration Market Volume (K Unit) Forecast, by Application 2020 & 2033
- Table 21: Rest of North America Air Filtration Market Revenue (Million) Forecast, by Application 2020 & 2033
- Table 22: Rest of North America Air Filtration Market Volume (K Unit) Forecast, by Application 2020 & 2033
- Table 23: Global Air Filtration Market Revenue Million Forecast, by Filtration Technology 2020 & 2033
- Table 24: Global Air Filtration Market Volume K Unit Forecast, by Filtration Technology 2020 & 2033
- Table 25: Global Air Filtration Market Revenue Million Forecast, by Type 2020 & 2033
- Table 26: Global Air Filtration Market Volume K Unit Forecast, by Type 2020 & 2033
- Table 27: Global Air Filtration Market Revenue Million Forecast, by End User 2020 & 2033
- Table 28: Global Air Filtration Market Volume K Unit Forecast, by End User 2020 & 2033
- Table 29: Global Air Filtration Market Revenue Million Forecast, by Country 2020 & 2033
- Table 30: Global Air Filtration Market Volume K Unit Forecast, by Country 2020 & 2033
- Table 31: United Kingdom Air Filtration Market Revenue (Million) Forecast, by Application 2020 & 2033
- Table 32: United Kingdom Air Filtration Market Volume (K Unit) Forecast, by Application 2020 & 2033
- Table 33: Germany Air Filtration Market Revenue (Million) Forecast, by Application 2020 & 2033
- Table 34: Germany Air Filtration Market Volume (K Unit) Forecast, by Application 2020 & 2033
- Table 35: Spain Air Filtration Market Revenue (Million) Forecast, by Application 2020 & 2033
- Table 36: Spain Air Filtration Market Volume (K Unit) Forecast, by Application 2020 & 2033
- Table 37: NORDIC Air Filtration Market Revenue (Million) Forecast, by Application 2020 & 2033
- Table 38: NORDIC Air Filtration Market Volume (K Unit) Forecast, by Application 2020 & 2033
- Table 39: Russia Air Filtration Market Revenue (Million) Forecast, by Application 2020 & 2033
- Table 40: Russia Air Filtration Market Volume (K Unit) Forecast, by Application 2020 & 2033
- Table 41: Turkey Air Filtration Market Revenue (Million) Forecast, by Application 2020 & 2033
- Table 42: Turkey Air Filtration Market Volume (K Unit) Forecast, by Application 2020 & 2033
- Table 43: Italy Air Filtration Market Revenue (Million) Forecast, by Application 2020 & 2033
- Table 44: Italy Air Filtration Market Volume (K Unit) Forecast, by Application 2020 & 2033
- Table 45: Rest of Europe Air Filtration Market Revenue (Million) Forecast, by Application 2020 & 2033
- Table 46: Rest of Europe Air Filtration Market Volume (K Unit) Forecast, by Application 2020 & 2033
- Table 47: Global Air Filtration Market Revenue Million Forecast, by Filtration Technology 2020 & 2033
- Table 48: Global Air Filtration Market Volume K Unit Forecast, by Filtration Technology 2020 & 2033
- Table 49: Global Air Filtration Market Revenue Million Forecast, by Type 2020 & 2033
- Table 50: Global Air Filtration Market Volume K Unit Forecast, by Type 2020 & 2033
- Table 51: Global Air Filtration Market Revenue Million Forecast, by End User 2020 & 2033
- Table 52: Global Air Filtration Market Volume K Unit Forecast, by End User 2020 & 2033
- Table 53: Global Air Filtration Market Revenue Million Forecast, by Country 2020 & 2033
- Table 54: Global Air Filtration Market Volume K Unit Forecast, by Country 2020 & 2033
- Table 55: China Air Filtration Market Revenue (Million) Forecast, by Application 2020 & 2033
- Table 56: China Air Filtration Market Volume (K Unit) Forecast, by Application 2020 & 2033
- Table 57: India Air Filtration Market Revenue (Million) Forecast, by Application 2020 & 2033
- Table 58: India Air Filtration Market Volume (K Unit) Forecast, by Application 2020 & 2033
- Table 59: Japan Air Filtration Market Revenue (Million) Forecast, by Application 2020 & 2033
- Table 60: Japan Air Filtration Market Volume (K Unit) Forecast, by Application 2020 & 2033
- Table 61: Malaysia Air Filtration Market Revenue (Million) Forecast, by Application 2020 & 2033
- Table 62: Malaysia Air Filtration Market Volume (K Unit) Forecast, by Application 2020 & 2033
- Table 63: Thailand Air Filtration Market Revenue (Million) Forecast, by Application 2020 & 2033
- Table 64: Thailand Air Filtration Market Volume (K Unit) Forecast, by Application 2020 & 2033
- Table 65: Indonesia Air Filtration Market Revenue (Million) Forecast, by Application 2020 & 2033
- Table 66: Indonesia Air Filtration Market Volume (K Unit) Forecast, by Application 2020 & 2033
- Table 67: Vietnam Air Filtration Market Revenue (Million) Forecast, by Application 2020 & 2033
- Table 68: Vietnam Air Filtration Market Volume (K Unit) Forecast, by Application 2020 & 2033
- Table 69: Rest of Asia Pacific Air Filtration Market Revenue (Million) Forecast, by Application 2020 & 2033
- Table 70: Rest of Asia Pacific Air Filtration Market Volume (K Unit) Forecast, by Application 2020 & 2033
- Table 71: Global Air Filtration Market Revenue Million Forecast, by Filtration Technology 2020 & 2033
- Table 72: Global Air Filtration Market Volume K Unit Forecast, by Filtration Technology 2020 & 2033
- Table 73: Global Air Filtration Market Revenue Million Forecast, by Type 2020 & 2033
- Table 74: Global Air Filtration Market Volume K Unit Forecast, by Type 2020 & 2033
- Table 75: Global Air Filtration Market Revenue Million Forecast, by End User 2020 & 2033
- Table 76: Global Air Filtration Market Volume K Unit Forecast, by End User 2020 & 2033
- Table 77: Global Air Filtration Market Revenue Million Forecast, by Country 2020 & 2033
- Table 78: Global Air Filtration Market Volume K Unit Forecast, by Country 2020 & 2033
- Table 79: Brazil Air Filtration Market Revenue (Million) Forecast, by Application 2020 & 2033
- Table 80: Brazil Air Filtration Market Volume (K Unit) Forecast, by Application 2020 & 2033
- Table 81: Argentina Air Filtration Market Revenue (Million) Forecast, by Application 2020 & 2033
- Table 82: Argentina Air Filtration Market Volume (K Unit) Forecast, by Application 2020 & 2033
- Table 83: Colombia Air Filtration Market Revenue (Million) Forecast, by Application 2020 & 2033
- Table 84: Colombia Air Filtration Market Volume (K Unit) Forecast, by Application 2020 & 2033
- Table 85: Rest of South America Air Filtration Market Revenue (Million) Forecast, by Application 2020 & 2033
- Table 86: Rest of South America Air Filtration Market Volume (K Unit) Forecast, by Application 2020 & 2033
- Table 87: Global Air Filtration Market Revenue Million Forecast, by Filtration Technology 2020 & 2033
- Table 88: Global Air Filtration Market Volume K Unit Forecast, by Filtration Technology 2020 & 2033
- Table 89: Global Air Filtration Market Revenue Million Forecast, by Type 2020 & 2033
- Table 90: Global Air Filtration Market Volume K Unit Forecast, by Type 2020 & 2033
- Table 91: Global Air Filtration Market Revenue Million Forecast, by End User 2020 & 2033
- Table 92: Global Air Filtration Market Volume K Unit Forecast, by End User 2020 & 2033
- Table 93: Global Air Filtration Market Revenue Million Forecast, by Country 2020 & 2033
- Table 94: Global Air Filtration Market Volume K Unit Forecast, by Country 2020 & 2033
- Table 95: United Arab Emirates Air Filtration Market Revenue (Million) Forecast, by Application 2020 & 2033
- Table 96: United Arab Emirates Air Filtration Market Volume (K Unit) Forecast, by Application 2020 & 2033
- Table 97: Saudi Arabia Air Filtration Market Revenue (Million) Forecast, by Application 2020 & 2033
- Table 98: Saudi Arabia Air Filtration Market Volume (K Unit) Forecast, by Application 2020 & 2033
- Table 99: South Africa Air Filtration Market Revenue (Million) Forecast, by Application 2020 & 2033
- Table 100: South Africa Air Filtration Market Volume (K Unit) Forecast, by Application 2020 & 2033
- Table 101: Nigeria Air Filtration Market Revenue (Million) Forecast, by Application 2020 & 2033
- Table 102: Nigeria Air Filtration Market Volume (K Unit) Forecast, by Application 2020 & 2033
- Table 103: Qatar Air Filtration Market Revenue (Million) Forecast, by Application 2020 & 2033
- Table 104: Qatar Air Filtration Market Volume (K Unit) Forecast, by Application 2020 & 2033
- Table 105: Egypt Air Filtration Market Revenue (Million) Forecast, by Application 2020 & 2033
- Table 106: Egypt Air Filtration Market Volume (K Unit) Forecast, by Application 2020 & 2033
- Table 107: Rest of Middle East and Africa Air Filtration Market Revenue (Million) Forecast, by Application 2020 & 2033
- Table 108: Rest of Middle East and Africa Air Filtration Market Volume (K Unit) Forecast, by Application 2020 & 2033
Frequently Asked Questions
1. What is the projected Compound Annual Growth Rate (CAGR) of the Air Filtration Market?
The projected CAGR is approximately 7.00%.
2. Which companies are prominent players in the Air Filtration Market?
Key companies in the market include Daikin Honeywell , Xiaomi, Coway, 3M .
3. What are the main segments of the Air Filtration Market?
The market segments include Filtration Technology, Type, End User.
4. Can you provide details about the market size?
The market size is estimated to be USD 16.83 Million as of 2022.
5. What are some drivers contributing to market growth?
4.; Upcoming New Renewable Projects in the Country4.; Expansions of Transmission and Distribution Network.
6. What are the notable trends driving market growth?
The High-efficiency Particulate Air (HEPA) Segment is Expected to Dominate the Market.
7. Are there any restraints impacting market growth?
4.; Lack of Private Participation in the Country's Power Sector.
8. Can you provide examples of recent developments in the market?
March 2023: Xiaomi Corp. announced the launch of the MIJIA full-effect air purifier for the Chinese market. The equipment can produce 12,500 liters of air volume per minute, with an estimated virus removal capacity of approximately 99%. Such an enhanced product feature is expected to increase the sale of air purifiers during the forecast period.
9. What pricing options are available for accessing the report?
Pricing options include single-user, multi-user, and enterprise licenses priced at USD 4750, USD 5250, and USD 8750 respectively.
10. Is the market size provided in terms of value or volume?
The market size is provided in terms of value, measured in Million and volume, measured in K Unit.
11. Are there any specific market keywords associated with the report?
Yes, the market keyword associated with the report is "Air Filtration Market," which aids in identifying and referencing the specific market segment covered.
12. How do I determine which pricing option suits my needs best?
The pricing options vary based on user requirements and access needs. Individual users may opt for single-user licenses, while businesses requiring broader access may choose multi-user or enterprise licenses for cost-effective access to the report.
13. Are there any additional resources or data provided in the Air Filtration Market report?
While the report offers comprehensive insights, it's advisable to review the specific contents or supplementary materials provided to ascertain if additional resources or data are available.
14. How can I stay updated on further developments or reports in the Air Filtration Market?
To stay informed about further developments, trends, and reports in the Air Filtration Market, consider subscribing to industry newsletters, following relevant companies and organizations, or regularly checking reputable industry news sources and publications.
Methodology
Step 1 - Identification of Relevant Samples Size from Population Database


Step 2 - Approaches for Defining Global Market Size (Value, Volume* & Price*)

Note*: In applicable scenarios
Step 3 - Data Sources
Primary Research
- Web Analytics
- Survey Reports
- Research Institute
- Latest Research Reports
- Opinion Leaders
Secondary Research
- Annual Reports
- White Paper
- Latest Press Release
- Industry Association
- Paid Database
- Investor Presentations

Step 4 - Data Triangulation
Involves using different sources of information in order to increase the validity of a study
These sources are likely to be stakeholders in a program - participants, other researchers, program staff, other community members, and so on.
Then we put all data in single framework & apply various statistical tools to find out the dynamic on the market.
During the analysis stage, feedback from the stakeholder groups would be compared to determine areas of agreement as well as areas of divergence