

Key Insights
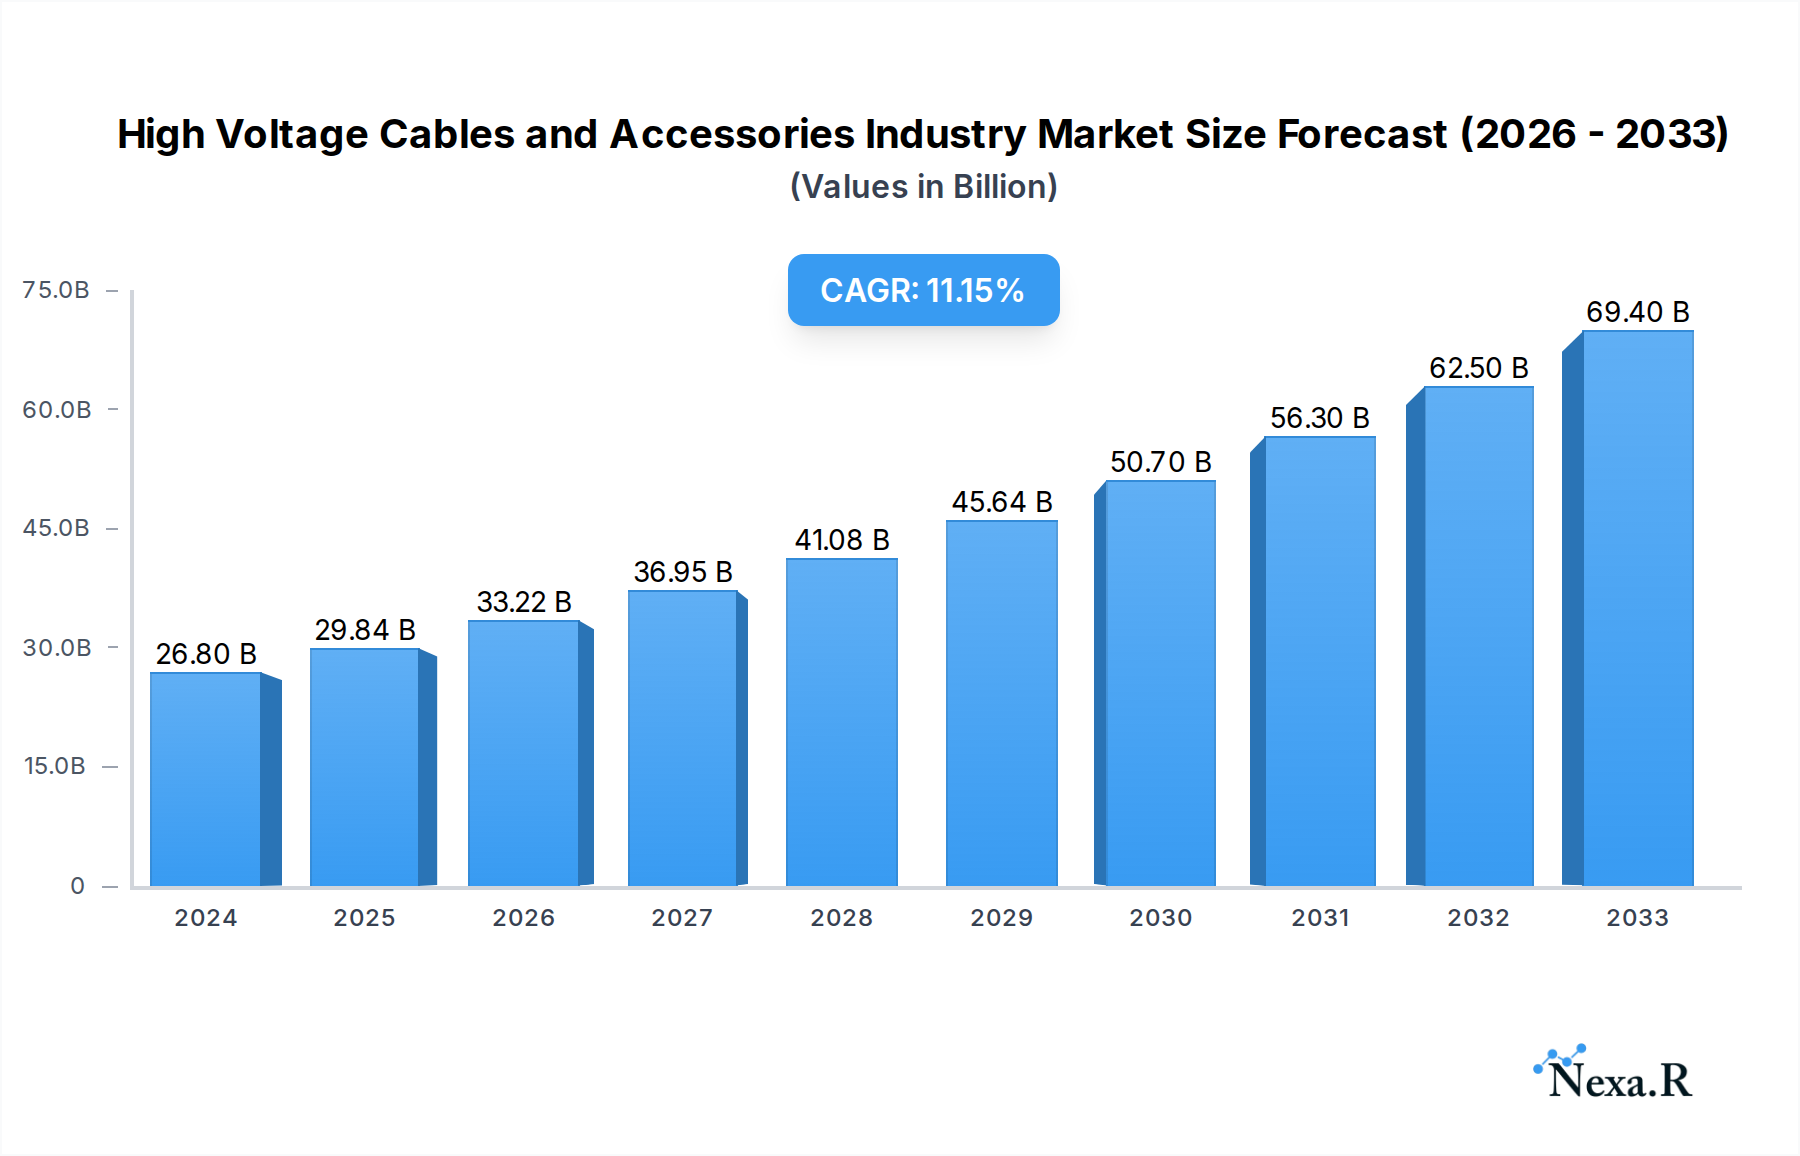
The High Voltage Cables and Accessories Industry is experiencing robust growth, with an estimated market size of $26.8 billion in 2024. This expansion is propelled by a significant CAGR of 11.4%, projecting a dynamic trajectory for the market through 2033. The primary drivers fueling this surge include the escalating demand for electricity driven by industrialization and urbanization, the ongoing modernization of aging grid infrastructure, and the substantial investments in renewable energy projects that necessitate advanced power transmission solutions. Furthermore, the increasing adoption of extra-high and ultra-high voltage technologies to meet growing energy needs efficiently and reliably is a critical factor. The market is segmented by location of deployment into Overhead, Underground, and Submarine cables, with significant growth anticipated in underground and submarine applications due to environmental concerns and space constraints in urban areas. Voltage levels are also a key segmentation, with High Voltage, Extra High Voltage, and Ultra High Voltage cables playing crucial roles in diverse power transmission scenarios.

High Voltage Cables and Accessories Industry Market Size (In Billion)
The industry's upward momentum is further supported by several key trends. The global push towards decarbonization and the integration of intermittent renewable energy sources like wind and solar are creating a pronounced need for sophisticated high voltage cable systems capable of handling fluctuating power flows and transmitting electricity over long distances. Advancements in materials science are leading to the development of more efficient, durable, and environmentally friendly cables. Smart grid technologies are also being integrated, enhancing grid reliability and enabling better management of power distribution. While growth is strong, the market faces some restraints, including the high capital expenditure required for infrastructure development, stringent regulatory frameworks, and the technical complexities associated with installing and maintaining ultra-high voltage systems. Nevertheless, the substantial investments in grid upgrades and expansion, particularly in rapidly developing regions, are expected to outweigh these challenges, ensuring continued market expansion and innovation in the high voltage cables and accessories sector.
High Voltage Cables and Accessories Industry Company Market Share
Unlock critical insights into the rapidly expanding global High Voltage Cables and Accessories market. This comprehensive report provides an in-depth analysis of the market dynamics, growth trajectories, and competitive landscape, with a specific focus on parent and child markets. Covering the period from 2019 to 2033, with a base and estimated year of 2025, this report is essential for stakeholders seeking to capitalize on opportunities in HVAC (High Voltage Cables and Accessories), EHV (Extra High Voltage) cables, and UHV (Ultra High Voltage) transmission systems. Explore underground cable market trends, submarine cable demand, and overhead line advancements within the context of global power infrastructure development.
High Voltage Cables and Accessories Industry Market Dynamics & Structure
The High Voltage Cables and Accessories market is characterized by a moderate level of concentration, with key players like Prysmian SpA and Nexans SA holding significant market shares. Technological innovation is a primary driver, fueled by the increasing demand for efficient and reliable power transmission solutions, particularly for renewable energy integration and grid modernization. Regulatory frameworks play a crucial role, with government initiatives promoting the expansion of power grids and the adoption of advanced technologies influencing market growth. Competitive product substitutes are limited due to the specialized nature of high-voltage applications, but advancements in materials science and manufacturing processes continually enhance product performance. End-user demographics are increasingly focused on utilities, renewable energy developers, and industrial sectors requiring robust power infrastructure. Mergers and acquisitions (M&A) activity, such as the strategic investments by NKT, indicate a trend towards consolidation and expansion of capabilities to meet rising demand. The market is projected to reach over USD 85 billion by 2025.
- Market Concentration: Dominated by a few key global players, but with increasing participation from regional manufacturers.
- Technological Innovation: Driven by advancements in insulation materials, conductor technologies, and manufacturing precision for higher voltage ratings and longer transmission distances.
- Regulatory Frameworks: Government policies supporting grid upgrades, renewable energy targets, and smart grid implementation are significant drivers.
- Competitive Substitutes: Limited, with focus on performance, reliability, and lifecycle cost rather than direct product substitution.
- End-User Demographics: Utilities, large industrial complexes, renewable energy projects (wind, solar), and infrastructure development projects.
- M&A Trends: Strategic acquisitions and joint ventures aimed at expanding geographical reach and technological expertise.
High Voltage Cables and Accessories Industry Growth Trends & Insights
The High Voltage Cables and Accessories market is poised for substantial growth, driven by the accelerating global transition to renewable energy and the imperative for robust power infrastructure upgrades. This market is projected to experience a robust Compound Annual Growth Rate (CAGR) of over 7.5% from 2025 to 2033, a testament to the increasing demand for high-capacity and efficient power transmission solutions. The market size is expected to surge from approximately USD 92.3 billion in 2025 to over USD 160 billion by 2033. Adoption rates for advanced high-voltage technologies, particularly in underground and submarine cable segments, are steadily increasing due to environmental considerations and urban development. Technological disruptions, such as the development of higher-capacity HVDC (High Voltage Direct Current) cables and innovative accessories like advanced terminations and connectors, are reshaping the industry. Consumer behavior shifts are evident in the growing preference for sustainable and reliable energy supply, pushing utilities and project developers to invest in cutting-edge power transmission infrastructure. The integration of smart grid technologies and the increasing demand for grid stability in the face of intermittent renewable energy sources further amplify the need for sophisticated high-voltage cable systems. The rise in offshore wind farms, requiring extensive submarine cable networks, is a significant growth accelerator.
Dominant Regions, Countries, or Segments in High Voltage Cables and Accessories Industry
The Underground segment, within the High Voltage and Extra High Voltage classifications, currently dominates the High Voltage Cables and Accessories market, driven by increasing urbanization, environmental regulations, and the demand for aesthetically pleasing and secure power distribution. This segment is projected to hold over 45% of the market share by 2025, valued at over USD 41.5 billion. Key drivers for this dominance include stringent regulations in developed nations mandating underground power lines to improve reliability and reduce visual pollution, particularly in densely populated urban areas. Furthermore, the growing number of large-scale industrial projects and data centers requiring dedicated and protected power supply lines significantly contribute to the underground cable market's expansion.
Europe, with its strong emphasis on renewable energy integration and aging grid infrastructure requiring modernization, leads in the adoption of advanced underground and submarine cable solutions. Countries like Germany, the UK, and the Nordic nations are at the forefront, investing heavily in grid expansion and upgrades. Asia Pacific, particularly China and India, is emerging as a critical growth engine, fueled by massive infrastructure development projects and a rapidly expanding industrial base. The substantial investments in smart grids and the ambitious renewable energy targets set by these nations are driving significant demand for high-voltage cables and accessories. The submarine cable segment is also experiencing accelerated growth, primarily due to the expansion of offshore wind farms, connecting them to the onshore grid. The need to transmit power efficiently and reliably over long distances underwater for these projects is a major catalyst.
- Dominant Segment: Underground Cables, driven by urbanization and regulatory push.
- Key Voltage Levels: High Voltage (HV) and Extra High Voltage (EHV) cables are most prevalent.
- Leading Region: Europe, due to robust renewable energy infrastructure and grid modernization initiatives.
- Emerging Growth Engine: Asia Pacific, propelled by large-scale infrastructure development and industrialization.
- High-Growth Niche: Submarine Cables, spurred by the surge in offshore wind farm installations.
High Voltage Cables and Accessories Industry Product Landscape
The product landscape of the High Voltage Cables and Accessories market is defined by continuous innovation aimed at enhancing performance, reliability, and environmental sustainability. Key product advancements include the development of HVDC cables capable of transmitting higher power over longer distances with minimal energy loss, crucial for interconnecting grids and integrating remote renewable energy sources. Accessories like advanced insulation systems, robust jointing and termination kits, and smart monitoring devices are integral to ensuring the integrity and longevity of these high-voltage systems. Performance metrics such as dielectric strength, thermal resistance, and mechanical durability are constantly being improved through the use of sophisticated materials like cross-linked polyethylene (XLPE) and advanced polymer composites. Applications span a wide range, from powering major cities and industrial hubs to connecting offshore wind farms and facilitating international grid interconnections, all demanding cutting-edge solutions for secure and efficient energy transfer.
Key Drivers, Barriers & Challenges in High Voltage Cables and Accessories Industry
Key Drivers:
- Renewable Energy Integration: The global push for clean energy necessitates expanded and upgraded grid infrastructure, driving demand for high-voltage cables.
- Grid Modernization: Aging power grids worldwide require significant investment in new and advanced transmission systems for enhanced reliability and capacity.
- Urbanization and Industrial Growth: Increasing population density and industrial expansion in developing economies fuel the need for robust power distribution networks.
- Technological Advancements: Innovations in HVDC technology and materials science enable more efficient and long-distance power transmission.
Barriers & Challenges:
- High Initial Investment Costs: The upfront capital required for manufacturing and installing high-voltage cable systems is substantial, posing a barrier for some markets.
- Complex Project Execution: Large-scale high-voltage projects are complex, requiring specialized expertise, long lead times, and meticulous planning.
- Supply Chain Disruptions: Geopolitical events and raw material availability can impact the production and delivery of critical components.
- Stringent Quality and Safety Standards: Adherence to rigorous international standards for high-voltage equipment is essential, but can add to development and compliance costs.
- Environmental Permitting: Obtaining necessary environmental permits for large infrastructure projects, especially for underground and submarine cables, can be time-consuming and challenging.
Emerging Opportunities in High Voltage Cables and Accessories Industry
Emerging opportunities in the High Voltage Cables and Accessories market lie in the development of advanced HVDC Lite solutions for more cost-effective power transmission and the growing demand for flexible AC transmission systems (FACTS) to enhance grid stability. The increasing adoption of electric vehicles (EVs) is also creating opportunities for high-capacity charging infrastructure requiring specialized high-voltage connections. Furthermore, the exploration of smart grid technologies, including integrated sensor networks within cables for real-time performance monitoring and predictive maintenance, presents a significant growth avenue. The expansion of interconnectors between countries and continents for energy trading and grid resilience also fuels demand for high-voltage submarine and underground cables.
Growth Accelerators in the High Voltage Cables and Accessories Industry Industry
The High Voltage Cables and Accessories industry is experiencing significant growth acceleration driven by key catalysts. Government policies promoting renewable energy targets and grid modernization are paramount, creating a predictable and supportive market environment. The increasing global investment in offshore wind farms is a major accelerator, directly translating into substantial demand for submarine high-voltage power cables. Technological breakthroughs, such as the ongoing refinement of HVDC technology for longer and more efficient power transmission, are expanding the feasible reach of electricity grids. Strategic partnerships between cable manufacturers and renewable energy developers, and the expansion of manufacturing capacities by key players like NKT through new factory investments, are also crucial growth engines.
Key Players Shaping the High Voltage Cables and Accessories Industry Market
- Nexans SA
- Prysmian SpA
- Brugg Kabel AG
- TE Connectivity Ltd
- NKT A/S
- LS Cable & System Limited
- Sumitomo Electric Industries Ltd
Notable Milestones in High Voltage Cables and Accessories Industry Sector
- June 2023: NKT announced the finalization of a power cable contract for Poland's 1.2 GW Baltic Power offshore wind farm, valued at USD 128.3 million, for approximately 130 kilometers of 240 kV high-voltage power cables. The project, expected to be commissioned in 2026, will supply renewable energy to over 1.5 million Polish households annually for about 25 years.
- May 2023: NKT announced plans for a new factory and third extrusion tower in Karlskrona, Sweden, with an investment of approximately USD 1.2 billion from 2023 to 2026. This expansion, set to commence operations in 2027, aims to significantly bolster NKT's capacity for long-length HVDC power cable solutions in response to increasing market demand and strong order intake.
In-Depth High Voltage Cables and Accessories Industry Market Outlook
The future outlook for the High Voltage Cables and Accessories market is exceptionally positive, fueled by a confluence of critical growth accelerators. The ongoing global transition to renewable energy sources, coupled with the imperative to upgrade and expand aging power grids, will continue to be the primary demand drivers. Significant investments in offshore wind projects worldwide are creating unprecedented opportunities for submarine cable manufacturers. Furthermore, advancements in HVDC technology, enabling more efficient and long-distance power transmission, are unlocking new possibilities for grid interconnections and the integration of remote energy resources. Strategic expansions by leading manufacturers, such as NKT’s investments in new production facilities, highlight the industry’s confidence in sustained high demand. The market is expected to witness continued innovation in materials and product design, leading to higher performance, increased reliability, and greater sustainability in power transmission solutions.
High Voltage Cables and Accessories Industry Segmentation
-
1. Location of Deployment
- 1.1. Overhead
- 1.2. Underground
- 1.3. Submarine
-
2. Voltage Level
- 2.1. High Voltage
- 2.2. Extra High Voltage
- 2.3. Ultra High Voltage
High Voltage Cables and Accessories Industry Segmentation By Geography
- 1. North America
- 2. Asia Pacific
- 3. Europe
- 4. South America
- 5. Middle East and Africa
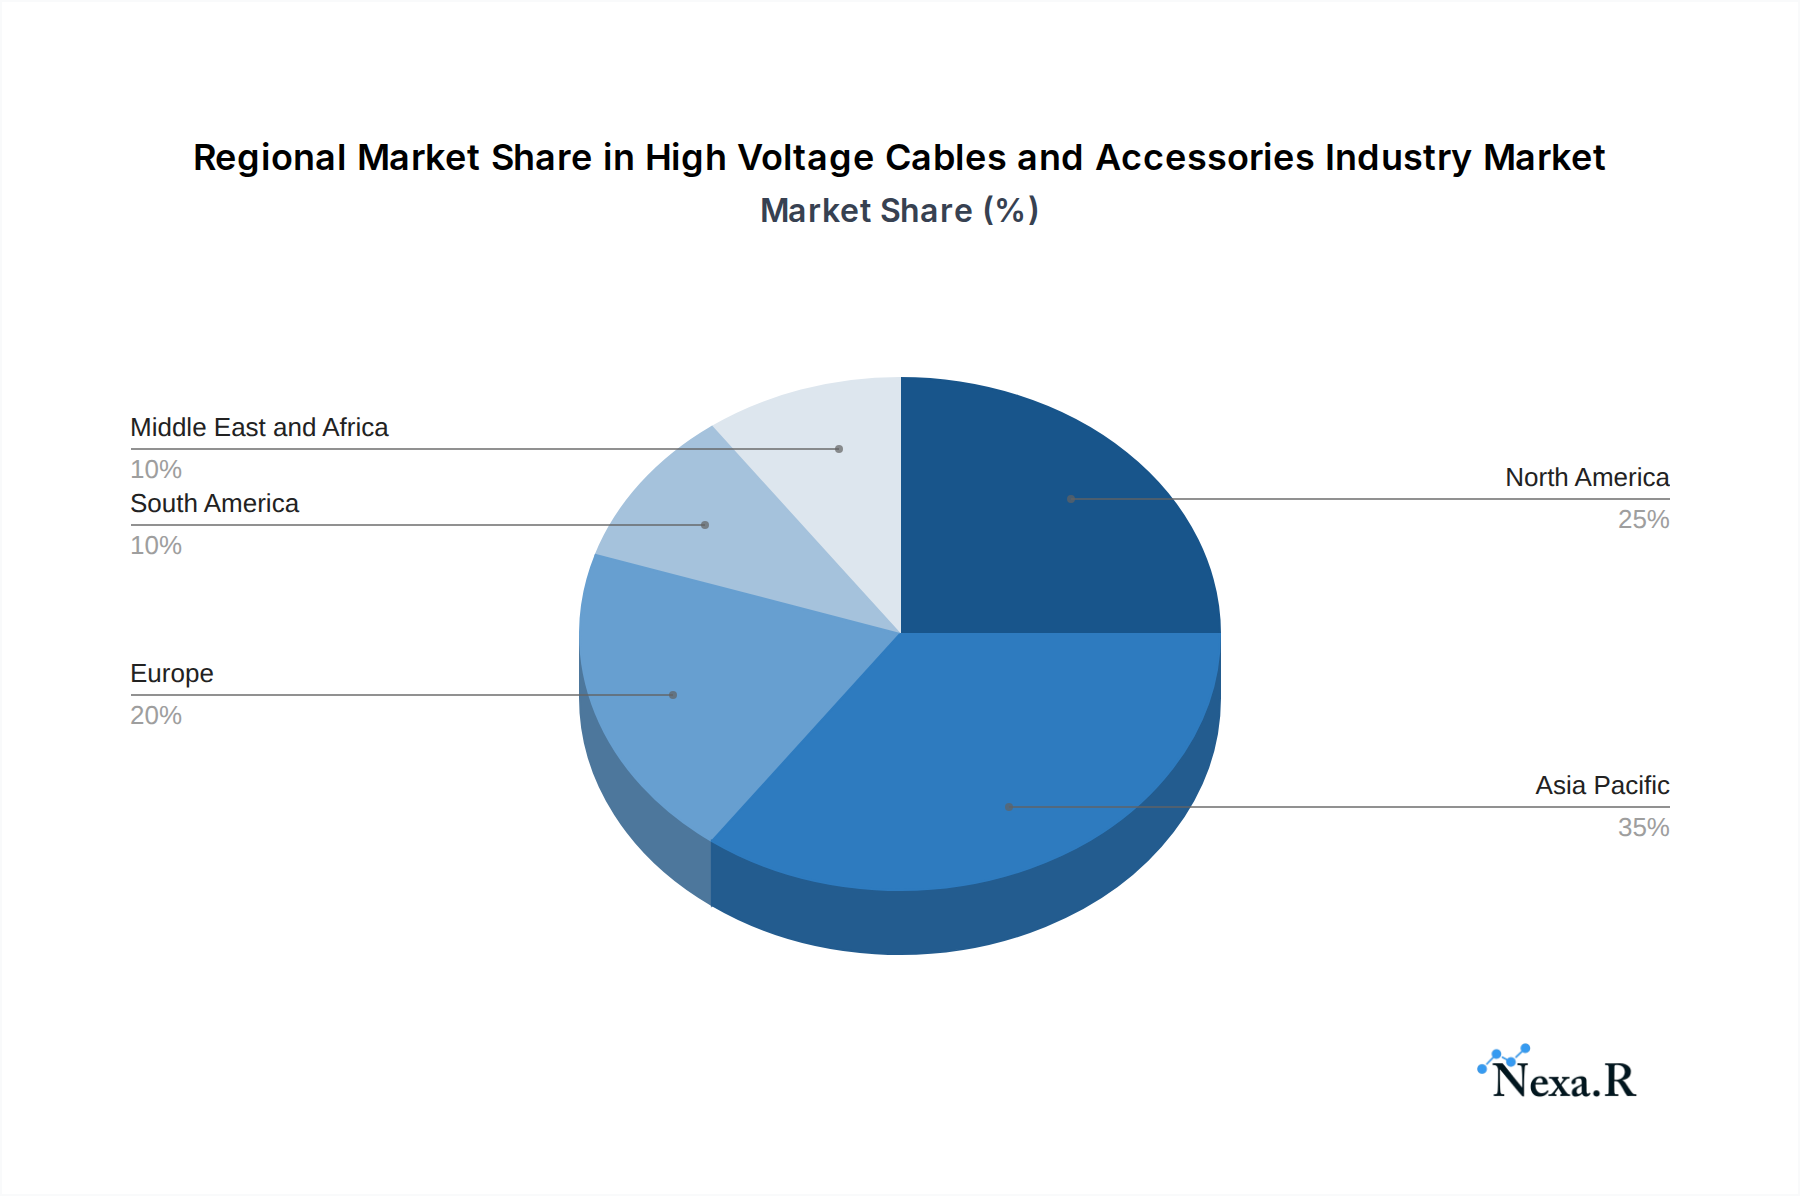
High Voltage Cables and Accessories Industry Regional Market Share
Geographic Coverage of High Voltage Cables and Accessories Industry
High Voltage Cables and Accessories Industry REPORT HIGHLIGHTS
| Aspects | Details |
|---|---|
| Study Period | 2020-2034 |
| Base Year | 2025 |
| Estimated Year | 2026 |
| Forecast Period | 2026-2034 |
| Historical Period | 2020-2025 |
| Growth Rate | CAGR of 11.4% from 2020-2034 |
| Segmentation |
|
Table of Contents
- 1. Introduction
- 1.1. Research Scope
- 1.2. Market Segmentation
- 1.3. Research Objective
- 1.4. Definitions and Assumptions
- 2. Executive Summary
- 2.1. Market Snapshot
- 3. Market Dynamics
- 3.1. Market Drivers
- 3.2. Market Restrains
- 3.3. Market Trends
- 3.4. Market Opportunities
- 4. Market Factor Analysis
- 4.1. Porters Five Forces
- 4.1.1. Bargaining Power of Suppliers
- 4.1.2. Bargaining Power of Buyers
- 4.1.3. Threat of New Entrants
- 4.1.4. Threat of Substitutes
- 4.1.5. Competitive Rivalry
- 4.2. PESTEL analysis
- 4.3. BCG Analysis
- 4.3.1. Stars (High Growth, High Market Share)
- 4.3.2. Cash Cows (Low Growth, High Market Share)
- 4.3.3. Question Mark (High Growth, Low Market Share)
- 4.3.4. Dogs (Low Growth, Low Market Share)
- 4.4. Ansoff Matrix Analysis
- 4.5. Supply Chain Analysis
- 4.6. Regulatory Landscape
- 4.7. Current Market Potential and Opportunity Assessment (TAM–SAM–SOM Framework)
- 4.8. NRP Analyst Note
- 4.1. Porters Five Forces
- 5. Market Analysis, Insights and Forecast 2021-2033
- 5.1. Market Analysis, Insights and Forecast - by Location of Deployment
- 5.1.1. Overhead
- 5.1.2. Underground
- 5.1.3. Submarine
- 5.2. Market Analysis, Insights and Forecast - by Voltage Level
- 5.2.1. High Voltage
- 5.2.2. Extra High Voltage
- 5.2.3. Ultra High Voltage
- 5.3. Market Analysis, Insights and Forecast - by Region
- 5.3.1. North America
- 5.3.2. Asia Pacific
- 5.3.3. Europe
- 5.3.4. South America
- 5.3.5. Middle East and Africa
- 5.1. Market Analysis, Insights and Forecast - by Location of Deployment
- 6. Global High Voltage Cables and Accessories Industry Analysis, Insights and Forecast, 2021-2033
- 6.1. Market Analysis, Insights and Forecast - by Location of Deployment
- 6.1.1. Overhead
- 6.1.2. Underground
- 6.1.3. Submarine
- 6.2. Market Analysis, Insights and Forecast - by Voltage Level
- 6.2.1. High Voltage
- 6.2.2. Extra High Voltage
- 6.2.3. Ultra High Voltage
- 6.1. Market Analysis, Insights and Forecast - by Location of Deployment
- 7. North America High Voltage Cables and Accessories Industry Analysis, Insights and Forecast, 2020-2032
- 7.1. Market Analysis, Insights and Forecast - by Location of Deployment
- 7.1.1. Overhead
- 7.1.2. Underground
- 7.1.3. Submarine
- 7.2. Market Analysis, Insights and Forecast - by Voltage Level
- 7.2.1. High Voltage
- 7.2.2. Extra High Voltage
- 7.2.3. Ultra High Voltage
- 7.1. Market Analysis, Insights and Forecast - by Location of Deployment
- 8. Asia Pacific High Voltage Cables and Accessories Industry Analysis, Insights and Forecast, 2020-2032
- 8.1. Market Analysis, Insights and Forecast - by Location of Deployment
- 8.1.1. Overhead
- 8.1.2. Underground
- 8.1.3. Submarine
- 8.2. Market Analysis, Insights and Forecast - by Voltage Level
- 8.2.1. High Voltage
- 8.2.2. Extra High Voltage
- 8.2.3. Ultra High Voltage
- 8.1. Market Analysis, Insights and Forecast - by Location of Deployment
- 9. Europe High Voltage Cables and Accessories Industry Analysis, Insights and Forecast, 2020-2032
- 9.1. Market Analysis, Insights and Forecast - by Location of Deployment
- 9.1.1. Overhead
- 9.1.2. Underground
- 9.1.3. Submarine
- 9.2. Market Analysis, Insights and Forecast - by Voltage Level
- 9.2.1. High Voltage
- 9.2.2. Extra High Voltage
- 9.2.3. Ultra High Voltage
- 9.1. Market Analysis, Insights and Forecast - by Location of Deployment
- 10. South America High Voltage Cables and Accessories Industry Analysis, Insights and Forecast, 2020-2032
- 10.1. Market Analysis, Insights and Forecast - by Location of Deployment
- 10.1.1. Overhead
- 10.1.2. Underground
- 10.1.3. Submarine
- 10.2. Market Analysis, Insights and Forecast - by Voltage Level
- 10.2.1. High Voltage
- 10.2.2. Extra High Voltage
- 10.2.3. Ultra High Voltage
- 10.1. Market Analysis, Insights and Forecast - by Location of Deployment
- 11. Middle East and Africa High Voltage Cables and Accessories Industry Analysis, Insights and Forecast, 2020-2032
- 11.1. Market Analysis, Insights and Forecast - by Location of Deployment
- 11.1.1. Overhead
- 11.1.2. Underground
- 11.1.3. Submarine
- 11.2. Market Analysis, Insights and Forecast - by Voltage Level
- 11.2.1. High Voltage
- 11.2.2. Extra High Voltage
- 11.2.3. Ultra High Voltage
- 11.1. Market Analysis, Insights and Forecast - by Location of Deployment
- 12. Competitive Analysis
- 12.1. Company Profiles
- 12.1.1 Nexans SA
- 12.1.1.1. Company Overview
- 12.1.1.2. Products
- 12.1.1.3. Company Financials
- 12.1.1.4. SWOT Analysis
- 12.1.2 Prysmian SpA
- 12.1.2.1. Company Overview
- 12.1.2.2. Products
- 12.1.2.3. Company Financials
- 12.1.2.4. SWOT Analysis
- 12.1.3 Brugg Kabel AG
- 12.1.3.1. Company Overview
- 12.1.3.2. Products
- 12.1.3.3. Company Financials
- 12.1.3.4. SWOT Analysis
- 12.1.4 TE Connectivity Ltd
- 12.1.4.1. Company Overview
- 12.1.4.2. Products
- 12.1.4.3. Company Financials
- 12.1.4.4. SWOT Analysis
- 12.1.5 NKT A/S
- 12.1.5.1. Company Overview
- 12.1.5.2. Products
- 12.1.5.3. Company Financials
- 12.1.5.4. SWOT Analysis
- 12.1.6 LS Cable & System Limited
- 12.1.6.1. Company Overview
- 12.1.6.2. Products
- 12.1.6.3. Company Financials
- 12.1.6.4. SWOT Analysis
- 12.1.7 Sumitomo Electric Industries Ltd
- 12.1.7.1. Company Overview
- 12.1.7.2. Products
- 12.1.7.3. Company Financials
- 12.1.7.4. SWOT Analysis
- 12.1.1 Nexans SA
- 12.2. Market Entropy
- 12.2.1 Company's Key Areas Served
- 12.2.2 Recent Developments
- 12.3. Company Market Share Analysis 2025
- 12.3.1 Top 5 Companies Market Share Analysis
- 12.3.2 Top 3 Companies Market Share Analysis
- 12.4. List of Potential Customers
- 13. Research Methodology
List of Figures
- Figure 1: Global High Voltage Cables and Accessories Industry Revenue Breakdown (billion, %) by Region 2025 & 2033
- Figure 2: Global High Voltage Cables and Accessories Industry Volume Breakdown (K Unit, %) by Region 2025 & 2033
- Figure 3: North America High Voltage Cables and Accessories Industry Revenue (billion), by Location of Deployment 2025 & 2033
- Figure 4: North America High Voltage Cables and Accessories Industry Volume (K Unit), by Location of Deployment 2025 & 2033
- Figure 5: North America High Voltage Cables and Accessories Industry Revenue Share (%), by Location of Deployment 2025 & 2033
- Figure 6: North America High Voltage Cables and Accessories Industry Volume Share (%), by Location of Deployment 2025 & 2033
- Figure 7: North America High Voltage Cables and Accessories Industry Revenue (billion), by Voltage Level 2025 & 2033
- Figure 8: North America High Voltage Cables and Accessories Industry Volume (K Unit), by Voltage Level 2025 & 2033
- Figure 9: North America High Voltage Cables and Accessories Industry Revenue Share (%), by Voltage Level 2025 & 2033
- Figure 10: North America High Voltage Cables and Accessories Industry Volume Share (%), by Voltage Level 2025 & 2033
- Figure 11: North America High Voltage Cables and Accessories Industry Revenue (billion), by Country 2025 & 2033
- Figure 12: North America High Voltage Cables and Accessories Industry Volume (K Unit), by Country 2025 & 2033
- Figure 13: North America High Voltage Cables and Accessories Industry Revenue Share (%), by Country 2025 & 2033
- Figure 14: North America High Voltage Cables and Accessories Industry Volume Share (%), by Country 2025 & 2033
- Figure 15: Asia Pacific High Voltage Cables and Accessories Industry Revenue (billion), by Location of Deployment 2025 & 2033
- Figure 16: Asia Pacific High Voltage Cables and Accessories Industry Volume (K Unit), by Location of Deployment 2025 & 2033
- Figure 17: Asia Pacific High Voltage Cables and Accessories Industry Revenue Share (%), by Location of Deployment 2025 & 2033
- Figure 18: Asia Pacific High Voltage Cables and Accessories Industry Volume Share (%), by Location of Deployment 2025 & 2033
- Figure 19: Asia Pacific High Voltage Cables and Accessories Industry Revenue (billion), by Voltage Level 2025 & 2033
- Figure 20: Asia Pacific High Voltage Cables and Accessories Industry Volume (K Unit), by Voltage Level 2025 & 2033
- Figure 21: Asia Pacific High Voltage Cables and Accessories Industry Revenue Share (%), by Voltage Level 2025 & 2033
- Figure 22: Asia Pacific High Voltage Cables and Accessories Industry Volume Share (%), by Voltage Level 2025 & 2033
- Figure 23: Asia Pacific High Voltage Cables and Accessories Industry Revenue (billion), by Country 2025 & 2033
- Figure 24: Asia Pacific High Voltage Cables and Accessories Industry Volume (K Unit), by Country 2025 & 2033
- Figure 25: Asia Pacific High Voltage Cables and Accessories Industry Revenue Share (%), by Country 2025 & 2033
- Figure 26: Asia Pacific High Voltage Cables and Accessories Industry Volume Share (%), by Country 2025 & 2033
- Figure 27: Europe High Voltage Cables and Accessories Industry Revenue (billion), by Location of Deployment 2025 & 2033
- Figure 28: Europe High Voltage Cables and Accessories Industry Volume (K Unit), by Location of Deployment 2025 & 2033
- Figure 29: Europe High Voltage Cables and Accessories Industry Revenue Share (%), by Location of Deployment 2025 & 2033
- Figure 30: Europe High Voltage Cables and Accessories Industry Volume Share (%), by Location of Deployment 2025 & 2033
- Figure 31: Europe High Voltage Cables and Accessories Industry Revenue (billion), by Voltage Level 2025 & 2033
- Figure 32: Europe High Voltage Cables and Accessories Industry Volume (K Unit), by Voltage Level 2025 & 2033
- Figure 33: Europe High Voltage Cables and Accessories Industry Revenue Share (%), by Voltage Level 2025 & 2033
- Figure 34: Europe High Voltage Cables and Accessories Industry Volume Share (%), by Voltage Level 2025 & 2033
- Figure 35: Europe High Voltage Cables and Accessories Industry Revenue (billion), by Country 2025 & 2033
- Figure 36: Europe High Voltage Cables and Accessories Industry Volume (K Unit), by Country 2025 & 2033
- Figure 37: Europe High Voltage Cables and Accessories Industry Revenue Share (%), by Country 2025 & 2033
- Figure 38: Europe High Voltage Cables and Accessories Industry Volume Share (%), by Country 2025 & 2033
- Figure 39: South America High Voltage Cables and Accessories Industry Revenue (billion), by Location of Deployment 2025 & 2033
- Figure 40: South America High Voltage Cables and Accessories Industry Volume (K Unit), by Location of Deployment 2025 & 2033
- Figure 41: South America High Voltage Cables and Accessories Industry Revenue Share (%), by Location of Deployment 2025 & 2033
- Figure 42: South America High Voltage Cables and Accessories Industry Volume Share (%), by Location of Deployment 2025 & 2033
- Figure 43: South America High Voltage Cables and Accessories Industry Revenue (billion), by Voltage Level 2025 & 2033
- Figure 44: South America High Voltage Cables and Accessories Industry Volume (K Unit), by Voltage Level 2025 & 2033
- Figure 45: South America High Voltage Cables and Accessories Industry Revenue Share (%), by Voltage Level 2025 & 2033
- Figure 46: South America High Voltage Cables and Accessories Industry Volume Share (%), by Voltage Level 2025 & 2033
- Figure 47: South America High Voltage Cables and Accessories Industry Revenue (billion), by Country 2025 & 2033
- Figure 48: South America High Voltage Cables and Accessories Industry Volume (K Unit), by Country 2025 & 2033
- Figure 49: South America High Voltage Cables and Accessories Industry Revenue Share (%), by Country 2025 & 2033
- Figure 50: South America High Voltage Cables and Accessories Industry Volume Share (%), by Country 2025 & 2033
- Figure 51: Middle East and Africa High Voltage Cables and Accessories Industry Revenue (billion), by Location of Deployment 2025 & 2033
- Figure 52: Middle East and Africa High Voltage Cables and Accessories Industry Volume (K Unit), by Location of Deployment 2025 & 2033
- Figure 53: Middle East and Africa High Voltage Cables and Accessories Industry Revenue Share (%), by Location of Deployment 2025 & 2033
- Figure 54: Middle East and Africa High Voltage Cables and Accessories Industry Volume Share (%), by Location of Deployment 2025 & 2033
- Figure 55: Middle East and Africa High Voltage Cables and Accessories Industry Revenue (billion), by Voltage Level 2025 & 2033
- Figure 56: Middle East and Africa High Voltage Cables and Accessories Industry Volume (K Unit), by Voltage Level 2025 & 2033
- Figure 57: Middle East and Africa High Voltage Cables and Accessories Industry Revenue Share (%), by Voltage Level 2025 & 2033
- Figure 58: Middle East and Africa High Voltage Cables and Accessories Industry Volume Share (%), by Voltage Level 2025 & 2033
- Figure 59: Middle East and Africa High Voltage Cables and Accessories Industry Revenue (billion), by Country 2025 & 2033
- Figure 60: Middle East and Africa High Voltage Cables and Accessories Industry Volume (K Unit), by Country 2025 & 2033
- Figure 61: Middle East and Africa High Voltage Cables and Accessories Industry Revenue Share (%), by Country 2025 & 2033
- Figure 62: Middle East and Africa High Voltage Cables and Accessories Industry Volume Share (%), by Country 2025 & 2033
List of Tables
- Table 1: Global High Voltage Cables and Accessories Industry Revenue billion Forecast, by Location of Deployment 2020 & 2033
- Table 2: Global High Voltage Cables and Accessories Industry Volume K Unit Forecast, by Location of Deployment 2020 & 2033
- Table 3: Global High Voltage Cables and Accessories Industry Revenue billion Forecast, by Voltage Level 2020 & 2033
- Table 4: Global High Voltage Cables and Accessories Industry Volume K Unit Forecast, by Voltage Level 2020 & 2033
- Table 5: Global High Voltage Cables and Accessories Industry Revenue billion Forecast, by Region 2020 & 2033
- Table 6: Global High Voltage Cables and Accessories Industry Volume K Unit Forecast, by Region 2020 & 2033
- Table 7: Global High Voltage Cables and Accessories Industry Revenue billion Forecast, by Location of Deployment 2020 & 2033
- Table 8: Global High Voltage Cables and Accessories Industry Volume K Unit Forecast, by Location of Deployment 2020 & 2033
- Table 9: Global High Voltage Cables and Accessories Industry Revenue billion Forecast, by Voltage Level 2020 & 2033
- Table 10: Global High Voltage Cables and Accessories Industry Volume K Unit Forecast, by Voltage Level 2020 & 2033
- Table 11: Global High Voltage Cables and Accessories Industry Revenue billion Forecast, by Country 2020 & 2033
- Table 12: Global High Voltage Cables and Accessories Industry Volume K Unit Forecast, by Country 2020 & 2033
- Table 13: Global High Voltage Cables and Accessories Industry Revenue billion Forecast, by Location of Deployment 2020 & 2033
- Table 14: Global High Voltage Cables and Accessories Industry Volume K Unit Forecast, by Location of Deployment 2020 & 2033
- Table 15: Global High Voltage Cables and Accessories Industry Revenue billion Forecast, by Voltage Level 2020 & 2033
- Table 16: Global High Voltage Cables and Accessories Industry Volume K Unit Forecast, by Voltage Level 2020 & 2033
- Table 17: Global High Voltage Cables and Accessories Industry Revenue billion Forecast, by Country 2020 & 2033
- Table 18: Global High Voltage Cables and Accessories Industry Volume K Unit Forecast, by Country 2020 & 2033
- Table 19: Global High Voltage Cables and Accessories Industry Revenue billion Forecast, by Location of Deployment 2020 & 2033
- Table 20: Global High Voltage Cables and Accessories Industry Volume K Unit Forecast, by Location of Deployment 2020 & 2033
- Table 21: Global High Voltage Cables and Accessories Industry Revenue billion Forecast, by Voltage Level 2020 & 2033
- Table 22: Global High Voltage Cables and Accessories Industry Volume K Unit Forecast, by Voltage Level 2020 & 2033
- Table 23: Global High Voltage Cables and Accessories Industry Revenue billion Forecast, by Country 2020 & 2033
- Table 24: Global High Voltage Cables and Accessories Industry Volume K Unit Forecast, by Country 2020 & 2033
- Table 25: Global High Voltage Cables and Accessories Industry Revenue billion Forecast, by Location of Deployment 2020 & 2033
- Table 26: Global High Voltage Cables and Accessories Industry Volume K Unit Forecast, by Location of Deployment 2020 & 2033
- Table 27: Global High Voltage Cables and Accessories Industry Revenue billion Forecast, by Voltage Level 2020 & 2033
- Table 28: Global High Voltage Cables and Accessories Industry Volume K Unit Forecast, by Voltage Level 2020 & 2033
- Table 29: Global High Voltage Cables and Accessories Industry Revenue billion Forecast, by Country 2020 & 2033
- Table 30: Global High Voltage Cables and Accessories Industry Volume K Unit Forecast, by Country 2020 & 2033
- Table 31: Global High Voltage Cables and Accessories Industry Revenue billion Forecast, by Location of Deployment 2020 & 2033
- Table 32: Global High Voltage Cables and Accessories Industry Volume K Unit Forecast, by Location of Deployment 2020 & 2033
- Table 33: Global High Voltage Cables and Accessories Industry Revenue billion Forecast, by Voltage Level 2020 & 2033
- Table 34: Global High Voltage Cables and Accessories Industry Volume K Unit Forecast, by Voltage Level 2020 & 2033
- Table 35: Global High Voltage Cables and Accessories Industry Revenue billion Forecast, by Country 2020 & 2033
- Table 36: Global High Voltage Cables and Accessories Industry Volume K Unit Forecast, by Country 2020 & 2033
Frequently Asked Questions
1. What is the projected Compound Annual Growth Rate (CAGR) of the High Voltage Cables and Accessories Industry?
The projected CAGR is approximately 11.4%.
2. Which companies are prominent players in the High Voltage Cables and Accessories Industry?
Key companies in the market include Nexans SA, Prysmian SpA, Brugg Kabel AG, TE Connectivity Ltd, NKT A/S, LS Cable & System Limited, Sumitomo Electric Industries Ltd.
3. What are the main segments of the High Voltage Cables and Accessories Industry?
The market segments include Location of Deployment, Voltage Level.
4. Can you provide details about the market size?
The market size is estimated to be USD 26.8 billion as of 2022.
5. What are some drivers contributing to market growth?
4.; Increasing Integration Of Renewable Energy Generation4.; Aging Power Grids And Investments In Transmission And Distribution Infrastructure.
6. What are the notable trends driving market growth?
Underground Segment to be the Fastest Growing Market.
7. Are there any restraints impacting market growth?
4.; Increasing Raw Material Prices And Investment In Distributed Renewable Energy Generation Affect The Growth.
8. Can you provide examples of recent developments in the market?
In June 2023, NKT announced that it is finalizing the power cable contract for Poland's 1.2 GW Baltic Power offshore wind farm. The USD 128.3 million contract will design and produce approximately 130 kilometers of 240 kV high-voltage power cables for the Baltic Power offshore wind project. The Baltic Power offshore wind park is one of the first in Poland. The export power cables will be produced at the NKT factory in Cologne, with the anticipated commissioning of the total project in 2026. It will supply more than 1.5 million Polish households with renewable energy annually for about 25 years.
9. What pricing options are available for accessing the report?
Pricing options include single-user, multi-user, and enterprise licenses priced at USD 4750, USD 5250, and USD 8750 respectively.
10. Is the market size provided in terms of value or volume?
The market size is provided in terms of value, measured in billion and volume, measured in K Unit.
11. Are there any specific market keywords associated with the report?
Yes, the market keyword associated with the report is "High Voltage Cables and Accessories Industry," which aids in identifying and referencing the specific market segment covered.
12. How do I determine which pricing option suits my needs best?
The pricing options vary based on user requirements and access needs. Individual users may opt for single-user licenses, while businesses requiring broader access may choose multi-user or enterprise licenses for cost-effective access to the report.
13. Are there any additional resources or data provided in the High Voltage Cables and Accessories Industry report?
While the report offers comprehensive insights, it's advisable to review the specific contents or supplementary materials provided to ascertain if additional resources or data are available.
14. How can I stay updated on further developments or reports in the High Voltage Cables and Accessories Industry?
To stay informed about further developments, trends, and reports in the High Voltage Cables and Accessories Industry, consider subscribing to industry newsletters, following relevant companies and organizations, or regularly checking reputable industry news sources and publications.
Methodology
Step 1 - Identification of Relevant Samples Size from Population Database


Step 2 - Approaches for Defining Global Market Size (Value, Volume* & Price*)

Note*: In applicable scenarios
Step 3 - Data Sources
Primary Research
- Web Analytics
- Survey Reports
- Research Institute
- Latest Research Reports
- Opinion Leaders
Secondary Research
- Annual Reports
- White Paper
- Latest Press Release
- Industry Association
- Paid Database
- Investor Presentations

Step 4 - Data Triangulation
Involves using different sources of information in order to increase the validity of a study
These sources are likely to be stakeholders in a program - participants, other researchers, program staff, other community members, and so on.
Then we put all data in single framework & apply various statistical tools to find out the dynamic on the market.
During the analysis stage, feedback from the stakeholder groups would be compared to determine areas of agreement as well as areas of divergence