

Key Insights
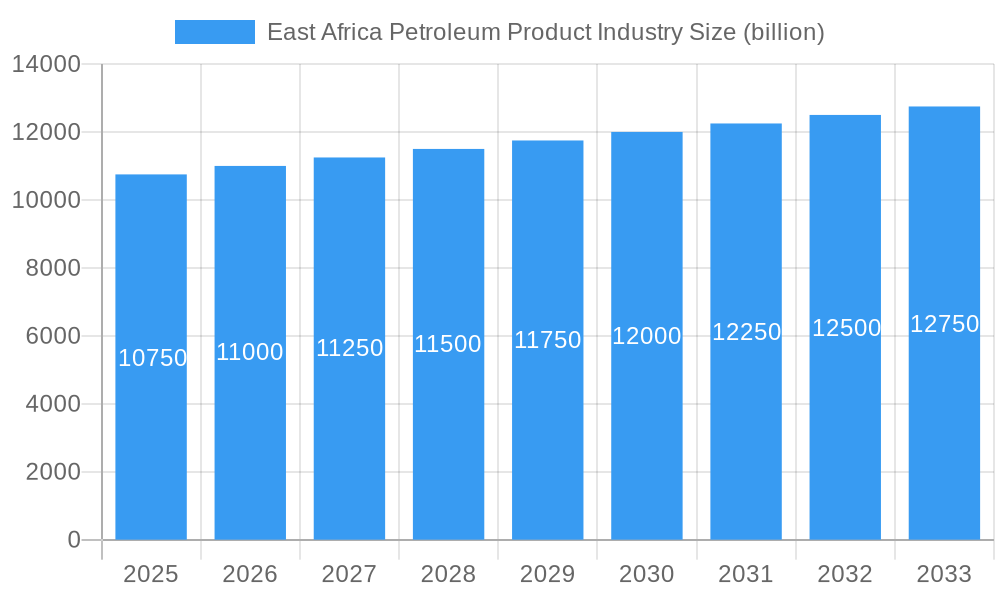
The East Africa Petroleum Product Industry is poised for steady growth, projecting a market size of USD 10.3 billion in 2023 and a compound annual growth rate (CAGR) of 2.3%. This expansion is primarily driven by increasing urbanization and a burgeoning middle class across key economies such as Uganda, Kenya, Tanzania, and Mozambique. As these nations continue to develop their infrastructure, transportation networks, and industrial sectors, the demand for refined petroleum products, including light, middle, and heavy distillates, is expected to rise. Government initiatives aimed at enhancing energy security and diversifying energy sources, while primarily focusing on renewables, still underscore the continued importance of petroleum products in meeting immediate energy needs. Moreover, significant investments in exploration and production activities, coupled with a growing refining capacity, are contributing to a more stable supply chain and potentially influencing pricing dynamics. The competitive landscape is shaped by the presence of major global players alongside national oil corporations, fostering a dynamic environment where strategic partnerships and operational efficiencies are crucial for market leadership.
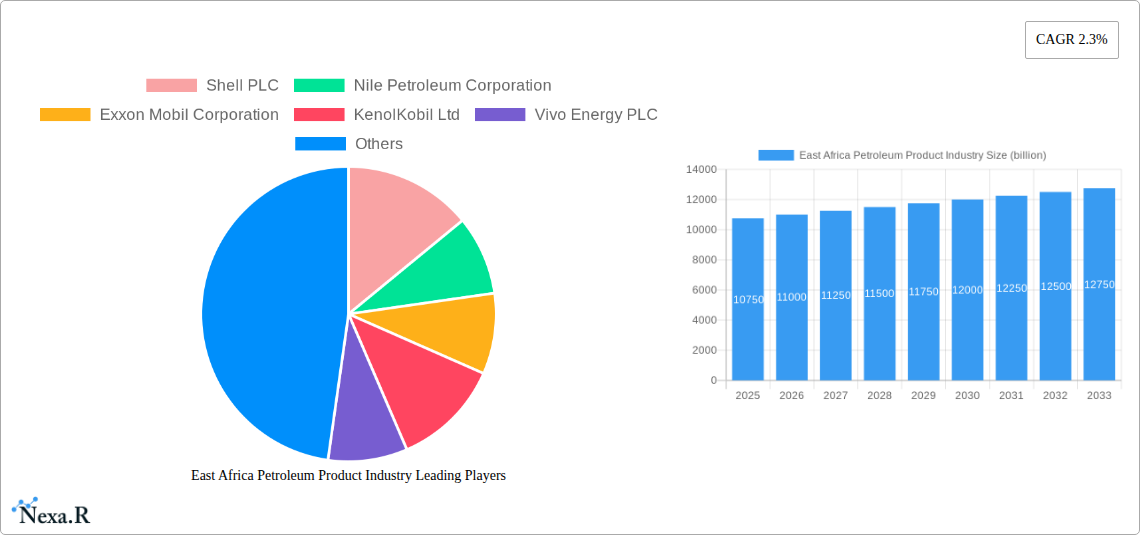
East Africa Petroleum Product Industry Market Size (In Billion)
Despite the positive growth trajectory, the industry faces certain restraints, including evolving environmental regulations and a global shift towards cleaner energy alternatives, which may temper long-term demand for certain petroleum products. However, the immediate future is characterized by robust demand for transportation fuels and industrial feedstock. The market is segmented into Light Distillates (gasoline, kerosene), Middle Distillates (diesel, jet fuel), and Heavy Distillates (fuel oil, asphalt). Uganda and Kenya are anticipated to lead consumption growth due to ongoing infrastructure projects and a growing vehicle fleet. Tanzania and Mozambique, with their developing economies and significant natural resource sectors, also present substantial market opportunities. The "Rest of East Africa" encompasses smaller yet growing markets where improved access to refined products will be a key growth enabler. Companies like Shell PLC, Exxon Mobil Corporation, and Vivo Energy PLC are strategically positioned to capitalize on these evolving market dynamics, while national entities like Nile Petroleum Corporation and National Oil Ethiopia PLC play a vital role in ensuring domestic supply and market penetration.
East Africa Petroleum Product Industry Company Market Share
East Africa Petroleum Product Industry: Market Dynamics, Growth Trends, and Strategic Outlook (2019-2033)
This comprehensive report offers an in-depth analysis of the East African petroleum product industry, providing critical insights for stakeholders seeking to understand market dynamics, growth trajectories, and future opportunities. Covering the period from 2019 to 2033, with a base year of 2025, this report delves into market concentration, technological drivers, regulatory frameworks, competitive landscapes, and emerging trends. We examine the parent market and its crucial child markets, offering a detailed breakdown of segments by product type and geography. All quantitative values are presented in billions of USD, unless otherwise specified.
East Africa Petroleum Product Industry Market Dynamics & Structure
The East Africa petroleum product industry is characterized by a moderately concentrated market structure, with major international players like Shell PLC, Exxon Mobil Corporation, and TotalEnergies SE holding significant sway, alongside regional powerhouses such as Nile Petroleum Corporation, KenolKobil Ltd, Vivo Energy PLC, and National Oil Ethiopia PLC. Technological innovation is primarily driven by the demand for cleaner fuels, enhanced refining efficiencies, and advancements in fuel additive technology, aiming to meet evolving environmental standards. Regulatory frameworks, shaped by national governments and regional bodies, are increasingly focused on ensuring fuel quality, promoting competition, and managing price volatilities. Competitive product substitutes, while currently limited in widespread adoption, include the nascent but growing influence of biofuels and the long-term potential of electric vehicle infrastructure impacting demand for certain petroleum distillates. End-user demographics span a wide spectrum, from large industrial consumers and transportation sectors to individual households reliant on petroleum products for energy and mobility. Mergers and acquisitions (M&A) trends are indicative of strategic consolidation and market expansion, with recent activities aimed at strengthening distribution networks and enhancing refining capacities. For instance, the historical period saw M&A deal volumes estimated at $1.2 billion, driven by companies seeking to leverage economies of scale and expand their geographic footprint within East Africa. However, innovation barriers remain, including the high capital investment required for advanced refining technologies and the complex bureaucratic processes associated with new product introductions.
East Africa Petroleum Product Industry Growth Trends & Insights
The East African petroleum product industry is poised for substantial growth, projected to witness a Compound Annual Growth Rate (CAGR) of approximately 4.8% over the forecast period of 2025–2033. This robust expansion will be fueled by a confluence of factors, including increasing urbanization, a burgeoning middle class, and significant investments in infrastructure development, particularly in transportation and energy. The market size, estimated at $35.5 billion in the base year 2025, is expected to reach $52.1 billion by 2033. Adoption rates for advanced fuel formulations, designed for improved engine performance and reduced emissions, are gradually increasing, driven by both consumer awareness and regulatory mandates. Technological disruptions, while currently moderate, are on the horizon, with the potential for enhanced refining processes and the integration of digital solutions in supply chain management and distribution networks. Consumer behavior shifts are evident in the growing demand for convenient retail experiences and a greater emphasis on fuel quality and cost-effectiveness. Market penetration for specialized petroleum products, such as high-performance lubricants and specialized industrial fuels, is also expected to rise as key end-user industries expand their operations. The historical period (2019–2024) witnessed a more modest CAGR of 3.2%, reflecting earlier stages of economic development and infrastructure build-out. However, the present outlook suggests an acceleration in growth, driven by regional economic integration and a more stable geopolitical environment in several key nations. The interplay between these growth trends and specific market segments, such as the increasing demand for middle distillates in the burgeoning logistics sector, will be crucial in shaping the industry's future trajectory.
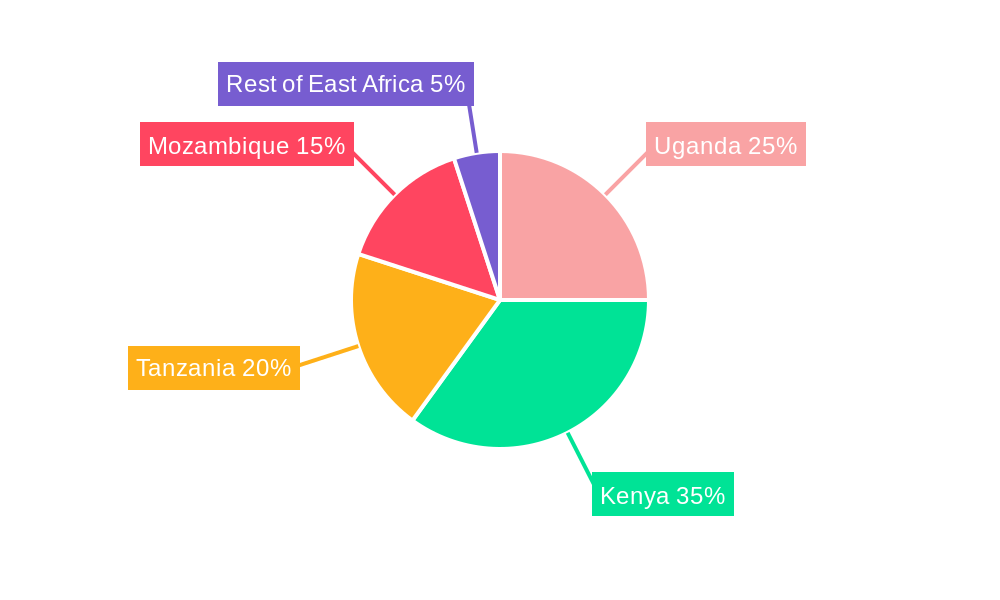
Dominant Regions, Countries, or Segments in East Africa Petroleum Product Industry
The dominance in the East African petroleum product industry is multifaceted, with Middle Distillates emerging as the leading segment, primarily driven by the insatiable demand from the transportation and logistics sectors. This segment, including diesel fuel, is critical for powering the region's growing fleet of commercial vehicles, construction machinery, and marine vessels, essential for trade and infrastructure development. Kenya stands out as a dominant country, largely due to its well-established refining infrastructure, strategic port access for imports and exports, and a relatively mature downstream distribution network. The country's economic activity, serving as a regional hub for trade and finance, further amplifies the demand for petroleum products.
- Key Drivers of Dominance in Middle Distillates:
- Infrastructure Development: Ongoing construction projects, road expansion, and port modernization initiatives require significant diesel consumption for heavy machinery and transportation.
- Logistics and Trade Growth: East Africa's expanding role in regional and international trade necessitates efficient transportation networks, heavily reliant on diesel-powered vehicles and ships.
- Industrialization: Growing manufacturing and processing industries often depend on diesel generators for power backup and fuel for operational machinery.
- Key Drivers of Dominance in Kenya:
- Refining Capacity: The presence of refining facilities, such as the Kenya Petroleum Refineries Limited, allows for domestic processing and a more stable supply chain for refined products.
- Strategic Location: Kenya's position as a gateway to landlocked East African nations facilitates its role as a distribution hub for petroleum products into neighboring markets like Uganda and South Sudan.
- Economic Activity: A diverse and growing economy, encompassing agriculture, manufacturing, and services, creates a sustained and substantial demand for various petroleum products.
While Light Distillates (like gasoline) and Heavy Distillates (such as fuel oil) also contribute significantly, their growth is more directly tied to specific sub-sectors. The "Rest of East Africa," encompassing countries like Rwanda, Burundi, and Eritrea, represents a significant growth potential but currently exhibits a lower market share due to underdeveloped infrastructure and smaller economies. Mozambique, with its emerging natural gas sector, presents a unique dynamic, potentially influencing future energy mix but currently relying on traditional petroleum products for a substantial portion of its energy needs. The market share for Middle Distillates in Kenya alone is estimated at 25% of the total East African market in 2025, with a projected growth potential of 5.2% CAGR over the forecast period, significantly outpacing other segments and geographies.
East Africa Petroleum Product Industry Product Landscape
The product landscape within the East African petroleum product industry is evolving, with a focus on enhancing fuel efficiency and reducing environmental impact. Innovations in refining processes are yielding cleaner burning fuels, particularly in the middle distillates segment, catering to stricter emission standards. Advanced additive technologies are being integrated to improve engine performance, extend engine life, and enhance fuel economy across gasoline and diesel formulations. Unique selling propositions are increasingly centered on product reliability, consistent quality, and the availability of specialized fuels for industrial applications, such as low-sulfur fuel oil for power generation. Technological advancements in fuel blending and purification are also contributing to a more optimized product offering that meets the specific needs of the region's diverse vehicle fleet and industrial machinery.
Key Drivers, Barriers & Challenges in East Africa Petroleum Product Industry
The East African petroleum product industry is propelled by several key drivers, including robust economic growth leading to increased demand for transportation and industrial energy. Government initiatives promoting infrastructure development, such as road networks and ports, directly fuel the consumption of petroleum products. A growing population and rising disposable incomes further contribute to an increased demand for mobility and energy services. Technological advancements in refining and fuel additives are also pushing the market forward, improving product quality and efficiency.
However, significant barriers and challenges constrain this growth. Volatile global crude oil prices create price instability, impacting affordability for end-users and profitability for industry players. Inadequate refining capacity in some nations necessitates heavy reliance on imports, leading to supply chain vulnerabilities and higher costs. Regulatory hurdles and bureaucratic complexities can slow down project development and market entry. Furthermore, the increasing global push towards renewable energy sources presents a long-term challenge, potentially reducing demand for fossil fuels. Supply chain disruptions, often exacerbated by logistical challenges and political instability in certain areas, pose a constant threat to product availability.
Emerging Opportunities in East Africa Petroleum Product Industry
Emerging opportunities in the East African petroleum product industry lie in the growing demand for high-quality, cleaner fuels, particularly in the middle distillates segment. The expansion of the logistics and e-commerce sectors presents a significant opportunity for increased diesel consumption. Furthermore, investments in infrastructure projects, such as ports and railways, will necessitate substantial fuel supplies. There is also an emerging market for specialized lubricants and industrial fuels catering to the growing manufacturing and mining sectors. The increasing focus on environmental sustainability also opens avenues for companies that can offer products with reduced emissions and improved fuel efficiency.
Growth Accelerators in the East Africa Petroleum Product Industry Industry
Growth accelerators in the East Africa Petroleum Product Industry are intrinsically linked to ongoing and planned infrastructure development across the region. The substantial investments in transportation networks, including highways, railways, and port expansions, are a primary catalyst, driving demand for fuels to power construction and operational activities. Furthermore, regional economic integration initiatives, fostering cross-border trade, will boost the demand for logistics and freight movement, directly benefiting the middle distillates market. Technological advancements in refining processes that enhance yield and product quality, coupled with strategic partnerships between international and local players to improve distribution networks, will also significantly accelerate market growth.
Key Players Shaping the East Africa Petroleum Product Industry Market
- Shell PLC
- Nile Petroleum Corporation
- Exxon Mobil Corporation
- KenolKobil Ltd
- Vivo Energy PLC
- TotalEnergies SE
- National Oil Ethiopia PLC
Notable Milestones in East Africa Petroleum Product Industry Sector
- 2019: Launch of new, higher-performance fuel additives by Shell PLC, enhancing engine efficiency and reducing emissions.
- 2020: Significant infrastructure investment in port expansion in Mombasa, Kenya, improving import/export capabilities for petroleum products.
- 2021: Nile Petroleum Corporation announces plans for refinery upgrades in South Sudan, aiming to increase domestic production capacity.
- 2022: Vivo Energy PLC expands its retail network across Tanzania, enhancing accessibility to petroleum products.
- 2023: TotalEnergies SE secures new exploration licenses in Mozambique, signaling future potential for domestic resource development.
- 2024: National Oil Ethiopia PLC focuses on optimizing its distribution logistics to meet rising demand from agricultural and transportation sectors.
In-Depth East Africa Petroleum Product Industry Market Outlook
The outlook for the East Africa Petroleum Product Industry remains robust, driven by sustained economic expansion and critical infrastructure investments. The growing demand for middle distillates in the burgeoning logistics and transportation sectors presents a significant area for continued growth. Companies that can effectively navigate the complex regulatory landscape and invest in enhancing their distribution networks will be well-positioned. The industry's future hinges on its ability to adapt to evolving environmental standards while meeting the region's increasing energy needs, with strategic partnerships and technological advancements serving as crucial growth accelerators for navigating the evolving energy landscape.
East Africa Petroleum Product Industry Segmentation
-
1. Type
- 1.1. Light Distillates
- 1.2. Middle Distillates
- 1.3. Heavy Distillates
-
2. Geography
- 2.1. Uganda
- 2.2. Kenya
- 2.3. Tanzania
- 2.4. Mozambique
- 2.5. Rest of East Africa
East Africa Petroleum Product Industry Segmentation By Geography
- 1. Uganda
- 2. Kenya
- 3. Tanzania
- 4. Mozambique
- 5. Rest of East Africa
East Africa Petroleum Product Industry Regional Market Share
Geographic Coverage of East Africa Petroleum Product Industry
East Africa Petroleum Product Industry REPORT HIGHLIGHTS
| Aspects | Details |
|---|---|
| Study Period | 2020-2034 |
| Base Year | 2025 |
| Estimated Year | 2026 |
| Forecast Period | 2026-2034 |
| Historical Period | 2020-2025 |
| Growth Rate | CAGR of 2.3% from 2020-2034 |
| Segmentation |
|
Table of Contents
- 1. Introduction
- 1.1. Research Scope
- 1.2. Market Segmentation
- 1.3. Research Objective
- 1.4. Definitions and Assumptions
- 2. Executive Summary
- 2.1. Market Snapshot
- 3. Market Dynamics
- 3.1. Market Drivers
- 3.2. Market Restrains
- 3.3. Market Trends
- 3.4. Market Opportunities
- 4. Market Factor Analysis
- 4.1. Porters Five Forces
- 4.1.1. Bargaining Power of Suppliers
- 4.1.2. Bargaining Power of Buyers
- 4.1.3. Threat of New Entrants
- 4.1.4. Threat of Substitutes
- 4.1.5. Competitive Rivalry
- 4.2. PESTEL analysis
- 4.3. BCG Analysis
- 4.3.1. Stars (High Growth, High Market Share)
- 4.3.2. Cash Cows (Low Growth, High Market Share)
- 4.3.3. Question Mark (High Growth, Low Market Share)
- 4.3.4. Dogs (Low Growth, Low Market Share)
- 4.4. Ansoff Matrix Analysis
- 4.5. Supply Chain Analysis
- 4.6. Regulatory Landscape
- 4.7. Current Market Potential and Opportunity Assessment (TAM–SAM–SOM Framework)
- 4.8. NRP Analyst Note
- 4.1. Porters Five Forces
- 5. Market Analysis, Insights and Forecast 2021-2033
- 5.1. Market Analysis, Insights and Forecast - by Type
- 5.1.1. Light Distillates
- 5.1.2. Middle Distillates
- 5.1.3. Heavy Distillates
- 5.2. Market Analysis, Insights and Forecast - by Geography
- 5.2.1. Uganda
- 5.2.2. Kenya
- 5.2.3. Tanzania
- 5.2.4. Mozambique
- 5.2.5. Rest of East Africa
- 5.3. Market Analysis, Insights and Forecast - by Region
- 5.3.1. Uganda
- 5.3.2. Kenya
- 5.3.3. Tanzania
- 5.3.4. Mozambique
- 5.3.5. Rest of East Africa
- 5.1. Market Analysis, Insights and Forecast - by Type
- 6. East Africa Petroleum Product Industry Analysis, Insights and Forecast, 2021-2033
- 6.1. Market Analysis, Insights and Forecast - by Type
- 6.1.1. Light Distillates
- 6.1.2. Middle Distillates
- 6.1.3. Heavy Distillates
- 6.2. Market Analysis, Insights and Forecast - by Geography
- 6.2.1. Uganda
- 6.2.2. Kenya
- 6.2.3. Tanzania
- 6.2.4. Mozambique
- 6.2.5. Rest of East Africa
- 6.1. Market Analysis, Insights and Forecast - by Type
- 7. Uganda East Africa Petroleum Product Industry Analysis, Insights and Forecast, 2020-2032
- 7.1. Market Analysis, Insights and Forecast - by Type
- 7.1.1. Light Distillates
- 7.1.2. Middle Distillates
- 7.1.3. Heavy Distillates
- 7.2. Market Analysis, Insights and Forecast - by Geography
- 7.2.1. Uganda
- 7.2.2. Kenya
- 7.2.3. Tanzania
- 7.2.4. Mozambique
- 7.2.5. Rest of East Africa
- 7.1. Market Analysis, Insights and Forecast - by Type
- 8. Kenya East Africa Petroleum Product Industry Analysis, Insights and Forecast, 2020-2032
- 8.1. Market Analysis, Insights and Forecast - by Type
- 8.1.1. Light Distillates
- 8.1.2. Middle Distillates
- 8.1.3. Heavy Distillates
- 8.2. Market Analysis, Insights and Forecast - by Geography
- 8.2.1. Uganda
- 8.2.2. Kenya
- 8.2.3. Tanzania
- 8.2.4. Mozambique
- 8.2.5. Rest of East Africa
- 8.1. Market Analysis, Insights and Forecast - by Type
- 9. Tanzania East Africa Petroleum Product Industry Analysis, Insights and Forecast, 2020-2032
- 9.1. Market Analysis, Insights and Forecast - by Type
- 9.1.1. Light Distillates
- 9.1.2. Middle Distillates
- 9.1.3. Heavy Distillates
- 9.2. Market Analysis, Insights and Forecast - by Geography
- 9.2.1. Uganda
- 9.2.2. Kenya
- 9.2.3. Tanzania
- 9.2.4. Mozambique
- 9.2.5. Rest of East Africa
- 9.1. Market Analysis, Insights and Forecast - by Type
- 10. Mozambique East Africa Petroleum Product Industry Analysis, Insights and Forecast, 2020-2032
- 10.1. Market Analysis, Insights and Forecast - by Type
- 10.1.1. Light Distillates
- 10.1.2. Middle Distillates
- 10.1.3. Heavy Distillates
- 10.2. Market Analysis, Insights and Forecast - by Geography
- 10.2.1. Uganda
- 10.2.2. Kenya
- 10.2.3. Tanzania
- 10.2.4. Mozambique
- 10.2.5. Rest of East Africa
- 10.1. Market Analysis, Insights and Forecast - by Type
- 11. Rest of East Africa East Africa Petroleum Product Industry Analysis, Insights and Forecast, 2020-2032
- 11.1. Market Analysis, Insights and Forecast - by Type
- 11.1.1. Light Distillates
- 11.1.2. Middle Distillates
- 11.1.3. Heavy Distillates
- 11.2. Market Analysis, Insights and Forecast - by Geography
- 11.2.1. Uganda
- 11.2.2. Kenya
- 11.2.3. Tanzania
- 11.2.4. Mozambique
- 11.2.5. Rest of East Africa
- 11.1. Market Analysis, Insights and Forecast - by Type
- 12. Competitive Analysis
- 12.1. Company Profiles
- 12.1.1 Shell PLC
- 12.1.1.1. Company Overview
- 12.1.1.2. Products
- 12.1.1.3. Company Financials
- 12.1.1.4. SWOT Analysis
- 12.1.2 Nile Petroleum Corporation
- 12.1.2.1. Company Overview
- 12.1.2.2. Products
- 12.1.2.3. Company Financials
- 12.1.2.4. SWOT Analysis
- 12.1.3 Exxon Mobil Corporation
- 12.1.3.1. Company Overview
- 12.1.3.2. Products
- 12.1.3.3. Company Financials
- 12.1.3.4. SWOT Analysis
- 12.1.4 KenolKobil Ltd
- 12.1.4.1. Company Overview
- 12.1.4.2. Products
- 12.1.4.3. Company Financials
- 12.1.4.4. SWOT Analysis
- 12.1.5 Vivo Energy PLC
- 12.1.5.1. Company Overview
- 12.1.5.2. Products
- 12.1.5.3. Company Financials
- 12.1.5.4. SWOT Analysis
- 12.1.6 TotalEnergies SE
- 12.1.6.1. Company Overview
- 12.1.6.2. Products
- 12.1.6.3. Company Financials
- 12.1.6.4. SWOT Analysis
- 12.1.7 National Oil Ethiopia PLC
- 12.1.7.1. Company Overview
- 12.1.7.2. Products
- 12.1.7.3. Company Financials
- 12.1.7.4. SWOT Analysis
- 12.1.1 Shell PLC
- 12.2. Market Entropy
- 12.2.1 Company's Key Areas Served
- 12.2.2 Recent Developments
- 12.3. Company Market Share Analysis 2025
- 12.3.1 Top 5 Companies Market Share Analysis
- 12.3.2 Top 3 Companies Market Share Analysis
- 12.4. List of Potential Customers
- 13. Research Methodology
List of Figures
- Figure 1: East Africa Petroleum Product Industry Revenue Breakdown (billion, %) by Product 2025 & 2033
- Figure 2: East Africa Petroleum Product Industry Share (%) by Company 2025
List of Tables
- Table 1: East Africa Petroleum Product Industry Revenue billion Forecast, by Type 2020 & 2033
- Table 2: East Africa Petroleum Product Industry Volume K Unit Forecast, by Type 2020 & 2033
- Table 3: East Africa Petroleum Product Industry Revenue billion Forecast, by Geography 2020 & 2033
- Table 4: East Africa Petroleum Product Industry Volume K Unit Forecast, by Geography 2020 & 2033
- Table 5: East Africa Petroleum Product Industry Revenue billion Forecast, by Region 2020 & 2033
- Table 6: East Africa Petroleum Product Industry Volume K Unit Forecast, by Region 2020 & 2033
- Table 7: East Africa Petroleum Product Industry Revenue billion Forecast, by Type 2020 & 2033
- Table 8: East Africa Petroleum Product Industry Volume K Unit Forecast, by Type 2020 & 2033
- Table 9: East Africa Petroleum Product Industry Revenue billion Forecast, by Geography 2020 & 2033
- Table 10: East Africa Petroleum Product Industry Volume K Unit Forecast, by Geography 2020 & 2033
- Table 11: East Africa Petroleum Product Industry Revenue billion Forecast, by Country 2020 & 2033
- Table 12: East Africa Petroleum Product Industry Volume K Unit Forecast, by Country 2020 & 2033
- Table 13: East Africa Petroleum Product Industry Revenue billion Forecast, by Type 2020 & 2033
- Table 14: East Africa Petroleum Product Industry Volume K Unit Forecast, by Type 2020 & 2033
- Table 15: East Africa Petroleum Product Industry Revenue billion Forecast, by Geography 2020 & 2033
- Table 16: East Africa Petroleum Product Industry Volume K Unit Forecast, by Geography 2020 & 2033
- Table 17: East Africa Petroleum Product Industry Revenue billion Forecast, by Country 2020 & 2033
- Table 18: East Africa Petroleum Product Industry Volume K Unit Forecast, by Country 2020 & 2033
- Table 19: East Africa Petroleum Product Industry Revenue billion Forecast, by Type 2020 & 2033
- Table 20: East Africa Petroleum Product Industry Volume K Unit Forecast, by Type 2020 & 2033
- Table 21: East Africa Petroleum Product Industry Revenue billion Forecast, by Geography 2020 & 2033
- Table 22: East Africa Petroleum Product Industry Volume K Unit Forecast, by Geography 2020 & 2033
- Table 23: East Africa Petroleum Product Industry Revenue billion Forecast, by Country 2020 & 2033
- Table 24: East Africa Petroleum Product Industry Volume K Unit Forecast, by Country 2020 & 2033
- Table 25: East Africa Petroleum Product Industry Revenue billion Forecast, by Type 2020 & 2033
- Table 26: East Africa Petroleum Product Industry Volume K Unit Forecast, by Type 2020 & 2033
- Table 27: East Africa Petroleum Product Industry Revenue billion Forecast, by Geography 2020 & 2033
- Table 28: East Africa Petroleum Product Industry Volume K Unit Forecast, by Geography 2020 & 2033
- Table 29: East Africa Petroleum Product Industry Revenue billion Forecast, by Country 2020 & 2033
- Table 30: East Africa Petroleum Product Industry Volume K Unit Forecast, by Country 2020 & 2033
- Table 31: East Africa Petroleum Product Industry Revenue billion Forecast, by Type 2020 & 2033
- Table 32: East Africa Petroleum Product Industry Volume K Unit Forecast, by Type 2020 & 2033
- Table 33: East Africa Petroleum Product Industry Revenue billion Forecast, by Geography 2020 & 2033
- Table 34: East Africa Petroleum Product Industry Volume K Unit Forecast, by Geography 2020 & 2033
- Table 35: East Africa Petroleum Product Industry Revenue billion Forecast, by Country 2020 & 2033
- Table 36: East Africa Petroleum Product Industry Volume K Unit Forecast, by Country 2020 & 2033
Frequently Asked Questions
1. What is the projected Compound Annual Growth Rate (CAGR) of the East Africa Petroleum Product Industry?
The projected CAGR is approximately 2.3%.
2. Which companies are prominent players in the East Africa Petroleum Product Industry?
Key companies in the market include Shell PLC, Nile Petroleum Corporation, Exxon Mobil Corporation, KenolKobil Ltd, Vivo Energy PLC, TotalEnergies SE, National Oil Ethiopia PLC.
3. What are the main segments of the East Africa Petroleum Product Industry?
The market segments include Type, Geography.
4. Can you provide details about the market size?
The market size is estimated to be USD 10.3 billion as of 2022.
5. What are some drivers contributing to market growth?
4.; Abundant Oil and Gas Reserves4.; Favorable Investment in Upstream Sector.
6. What are the notable trends driving market growth?
Middle Distillates to Dominate the Market.
7. Are there any restraints impacting market growth?
4.; Volatility of Crude Oil Prices.
8. Can you provide examples of recent developments in the market?
N/A
9. What pricing options are available for accessing the report?
Pricing options include single-user, multi-user, and enterprise licenses priced at USD 4750, USD 5250, and USD 8750 respectively.
10. Is the market size provided in terms of value or volume?
The market size is provided in terms of value, measured in billion and volume, measured in K Unit.
11. Are there any specific market keywords associated with the report?
Yes, the market keyword associated with the report is "East Africa Petroleum Product Industry," which aids in identifying and referencing the specific market segment covered.
12. How do I determine which pricing option suits my needs best?
The pricing options vary based on user requirements and access needs. Individual users may opt for single-user licenses, while businesses requiring broader access may choose multi-user or enterprise licenses for cost-effective access to the report.
13. Are there any additional resources or data provided in the East Africa Petroleum Product Industry report?
While the report offers comprehensive insights, it's advisable to review the specific contents or supplementary materials provided to ascertain if additional resources or data are available.
14. How can I stay updated on further developments or reports in the East Africa Petroleum Product Industry?
To stay informed about further developments, trends, and reports in the East Africa Petroleum Product Industry, consider subscribing to industry newsletters, following relevant companies and organizations, or regularly checking reputable industry news sources and publications.
Methodology
Step 1 - Identification of Relevant Samples Size from Population Database


Step 2 - Approaches for Defining Global Market Size (Value, Volume* & Price*)

Note*: In applicable scenarios
Step 3 - Data Sources
Primary Research
- Web Analytics
- Survey Reports
- Research Institute
- Latest Research Reports
- Opinion Leaders
Secondary Research
- Annual Reports
- White Paper
- Latest Press Release
- Industry Association
- Paid Database
- Investor Presentations

Step 4 - Data Triangulation
Involves using different sources of information in order to increase the validity of a study
These sources are likely to be stakeholders in a program - participants, other researchers, program staff, other community members, and so on.
Then we put all data in single framework & apply various statistical tools to find out the dynamic on the market.
During the analysis stage, feedback from the stakeholder groups would be compared to determine areas of agreement as well as areas of divergence