

Key Insights
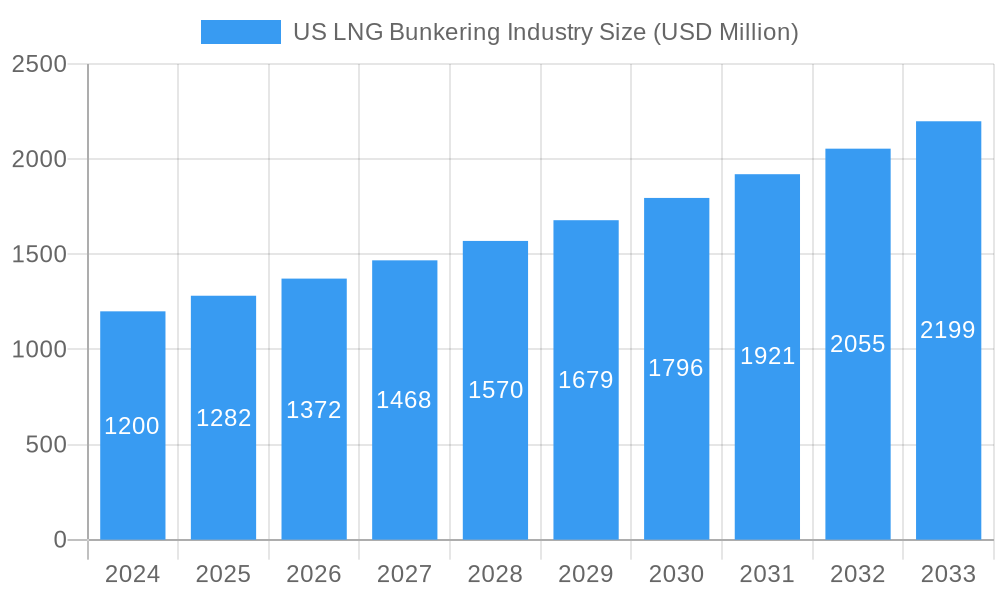
The US LNG Bunkering industry is poised for significant expansion, projected to reach $1.2 billion in 2024. This growth is fueled by increasing environmental regulations, the cost-effectiveness of Liquefied Natural Gas (LNG) as a marine fuel, and the ongoing development of LNG bunkering infrastructure. The market is anticipated to witness a Compound Annual Growth Rate (CAGR) of 6.8% from 2025 to 2033, underscoring a robust and sustained upward trajectory. Key drivers include the global push for decarbonization in the maritime sector, leading shipping companies to adopt cleaner fuels like LNG. Furthermore, advancements in LNG fuel supply chains, including the construction of new LNG-powered vessels and the expansion of port facilities equipped for LNG bunkering, are creating a more conducive environment for market penetration.
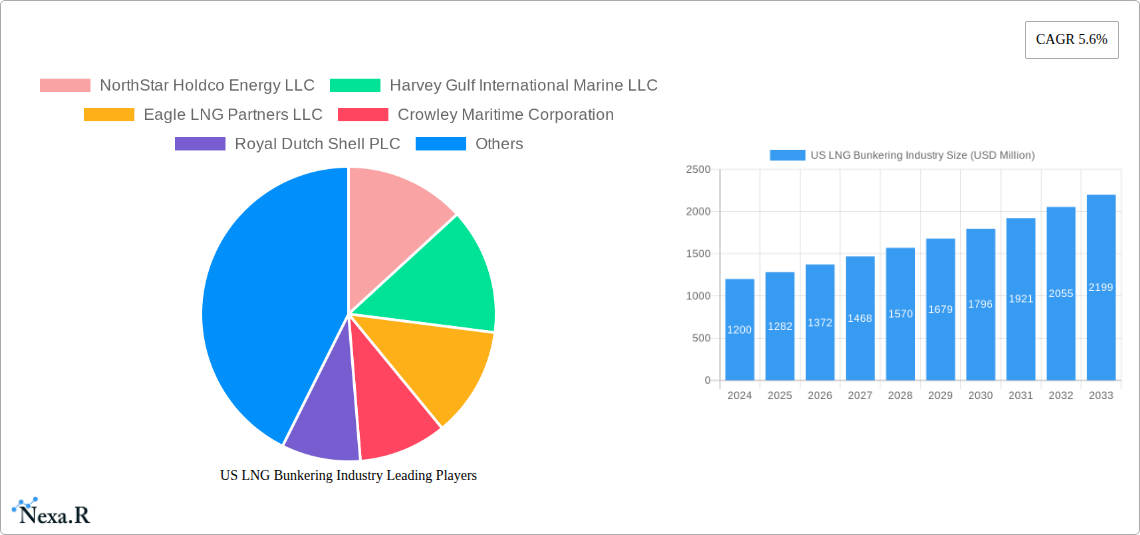
US LNG Bunkering Industry Market Size (In Billion)
The market's expansion is also characterized by evolving trends such as the increasing adoption of dual-fuel engines in new vessel builds, catering to both traditional fuels and LNG. This flexibility enhances operational efficiency and environmental compliance. Challenges, however, remain in the form of the initial high capital investment for infrastructure development and the need for standardized safety protocols and regulations across different regions. Despite these hurdles, the strong commitment from major players like NorthStar Holdco Energy LLC, Harvey Gulf International Marine LLC, and Crowley Maritime Corporation, coupled with governmental support for cleaner shipping initiatives, paints a promising picture for the US LNG Bunkering industry's future. The market segmentation, particularly the growing demand from the Tanker Fleet and Container Fleet segments, highlights the strategic importance of LNG as a preferred fuel for a substantial portion of the US maritime operations.
US LNG Bunkering Industry Company Market Share
US LNG Bunkering Industry Market Dynamics & Structure
The US LNG bunkering industry is characterized by a dynamic and evolving market structure, driven by increasing environmental regulations and the pursuit of cleaner maritime fuel alternatives. Market concentration is moderately fragmented, with key players like Royal Dutch Shell PLC, NorthStar Holdco Energy LLC, and Crowley Maritime Corporation investing heavily in infrastructure and vessel conversions. Technological innovation is a significant driver, focusing on the development of efficient liquefaction, storage, and transfer technologies for Liquefied Natural Gas (LNG). Regulatory frameworks, primarily driven by the International Maritime Organization (IMO) and the US Environmental Protection Agency (EPA), are mandating stricter emission standards, thus pushing the adoption of LNG.
- Market Concentration: Moderately fragmented with a few dominant players and emerging regional operators.
- Technological Innovation Drivers: Demand for lower sulfur emissions, NOx reduction, and enhanced fuel efficiency.
- Regulatory Frameworks: IMO 2020, stricter emissions controls, and government incentives for cleaner fuels.
- Competitive Product Substitutes: Traditional marine fuels (heavy fuel oil, marine gas oil), methanol, and future alternative fuels.
- End-User Demographics: Growing interest from tanker fleets, container ships, and offshore support vessels (OSVs) seeking compliance and operational cost savings.
- M&A Trends: Strategic partnerships and acquisitions to secure supply chains, expand geographical reach, and develop integrated solutions. M&A deal volume is projected to increase as the market matures.
US LNG Bunkering Industry Growth Trends & Insights
The US LNG bunkering industry is poised for significant expansion, driven by a confluence of environmental mandates, technological advancements, and evolving consumer behavior within the maritime sector. The market size is projected to witness substantial growth, transitioning from an estimated $5.1 billion in the base year of 2025 to an impressive $15.2 billion by the end of the forecast period in 2033, exhibiting a Compound Annual Growth Rate (CAGR) of approximately 14.5%. This growth trajectory is fueled by the increasing adoption of LNG as a marine fuel, driven by its ability to significantly reduce sulfur oxides (SOx), nitrogen oxides (NOx), and particulate matter emissions, thereby aiding vessel operators in meeting stringent global environmental regulations. The adoption rates are accelerating, particularly among new builds and retrofitted vessels.
Technological disruptions are playing a pivotal role, with advancements in LNG liquefaction plants, floating liquefaction and regasification units (FLNG/FRU), and shore-to-ship transfer technologies enhancing the accessibility and efficiency of LNG bunkering operations. This includes the development of smaller-scale LNG liquefaction facilities and innovative bunkering vessels like those operated by Harvey Gulf International Marine LLC and Conrad Shipyards LLC. Consumer behavior shifts are evident as shipping companies increasingly prioritize sustainability and seek long-term cost efficiencies. The perceived volatility of traditional fuel prices, coupled with the availability of a cleaner and domestically sourced fuel like LNG, is influencing purchasing decisions. Furthermore, the development of global LNG bunkering hubs, including those emerging in key US ports, is creating a more robust and reliable supply chain, thereby reducing perceived risks for end-users. The market penetration of LNG as a marine fuel, while still nascent, is steadily increasing, with projections indicating a significant share in the overall marine fuel market within the study period.
Dominant Regions, Countries, or Segments in US LNG Bunkering Industry
The US LNG bunkering industry's dominance is heavily influenced by its strategic geographical positioning, robust port infrastructure, and supportive regulatory environment, with the Tanker Fleet segment emerging as a primary growth driver. This segment benefits from the inherent advantages of LNG for vessels engaged in long-haul voyages and the transportation of various liquid cargoes, where emissions reduction and fuel cost predictability are paramount. The increasing number of LNG-powered tankers, coupled with significant investments from major players like Royal Dutch Shell PLC and Crowley Maritime Corporation, underscores this dominance. These companies are not only supplying LNG but also contributing to the development of dedicated bunkering infrastructure in key port locations.
- Key Drivers for Tanker Fleet Dominance:
- Stricter Emissions Regulations: Tanker operators face immense pressure to comply with global SOx and NOx emission limits, making LNG a compelling alternative to high-sulfur fuels.
- Economic Viability for Long-Haul Voyages: The stable price of LNG and its availability in major bunkering hubs make it an economically attractive option for large vessels on extensive routes.
- Industry Investments: Significant capital allocation by companies like NorthStar Holdco Energy LLC and JAX LNG LLC towards developing LNG bunkering facilities and terminals specifically catering to tanker fleets.
- Fleet Modernization: A growing trend of ordering new builds or retrofitting existing tankers to run on LNG.
The Container Fleet is another significant segment contributing to market growth, driven by the global push for decarbonization in container shipping. Companies like Evergreen Marine Corporation and CMA CGM are actively adopting LNG-powered container vessels, necessitating widespread LNG bunkering solutions. The Bulk and General Cargo Fleet is gradually adopting LNG, albeit at a slower pace, due to the diverse nature of their operations and existing vessel lifecycles. However, growing environmental awareness and potential future regulations are expected to boost LNG adoption within this segment.
The Ferries and OSVs segment, particularly in regions with high operational frequency and proximity to shore, also presents a strong growth potential. These vessels often operate within Emission Control Areas (ECAs) and can benefit from the readily available LNG supply and lower operational costs. Offshore Support Vessels (OSVs) operating in the Gulf of Mexico are increasingly opting for LNG to comply with environmental regulations and reduce operational expenses. The "Others" category, encompassing smaller specialized vessels and research fleets, also contributes to market expansion, albeit on a smaller scale.
Geographically, major US port regions such as Houston, New Orleans, Sabine Pass, and the East Coast ports are becoming critical hubs for LNG bunkering. The strategic proximity to LNG production facilities and established shipping lanes facilitates efficient supply and distribution. The presence of key infrastructure developers and operators like Eagle LNG Partners LLC and Segments: End-User: Tanker Fleet, Container Fleet, Bulk and General Cargo Fleet, Ferries and OSV, Others, which are actively building and expanding bunkering capabilities, further solidifies the dominance of these regions. The US's abundant natural gas reserves and growing liquefaction capacity provide a strong foundation for its LNG bunkering industry to thrive.
US LNG Bunkering Industry Product Landscape
The US LNG bunkering industry offers a refined product landscape focused on delivering high-quality, safe, and efficient Liquefied Natural Gas (LNG) as a marine fuel. The primary product is Marine LNG (M-LNG), which is essentially pipeline-quality natural gas cooled to approximately -162 degrees Celsius (-260 degrees Fahrenheit) to become a liquid. This process significantly reduces its volume, making it economically viable for storage and transportation. Key innovations in the product landscape revolve around enhancing the purity and consistency of M-LNG to meet stringent engine performance and emissions standards. Applications are diverse, ranging from powering large ocean-going vessels like container ships and tankers to supporting regional ferry services and offshore support operations. Performance metrics are centered on reduced greenhouse gas emissions (up to 20-30% CO2 reduction), near-elimination of SOx and particulate matter, and significant NOx reduction, thereby offering a cleaner alternative to traditional heavy fuel oil and marine gas oil. Unique selling propositions include environmental compliance, potential for long-term cost savings due to stable natural gas prices, and a readily available domestic supply, further bolstered by advancements in liquefaction and distribution technologies.
Key Drivers, Barriers & Challenges in US LNG Bunkering Industry
The US LNG bunkering industry is propelled by powerful forces and simultaneously confronts significant hurdles that shape its growth trajectory.
Key Drivers:
- Stringent Environmental Regulations: Global mandates like IMO 2020 and regional emission control areas (ECAs) are the primary catalysts, forcing a shift towards cleaner fuels.
- Cost Competitiveness: The stable and often lower price of natural gas compared to volatile oil prices offers long-term operational cost savings for vessel operators.
- Technological Advancements: Improvements in liquefaction, storage, and bunkering infrastructure are making LNG more accessible and efficient.
- Energy Security and Domestic Supply: The abundance of natural gas reserves in the US enhances energy security and promotes the use of a domestically sourced fuel.
- Industry Commitments: Major shipping lines and energy companies are making substantial investments and commitments to LNG-powered fleets and bunkering infrastructure.
Barriers & Challenges:
- High Upfront Costs: The initial investment for retrofitting existing vessels or building new LNG-powered ships can be substantial, posing a barrier for smaller operators.
- Limited Bunkering Infrastructure: While growing, the availability of LNG bunkering facilities at all major ports globally and within the US is still a challenge, impacting operational flexibility.
- Safety Concerns and Training: LNG requires specialized handling and safety protocols, necessitating significant training for crew and shore-based personnel.
- Supply Chain Logistics: Ensuring a consistent and reliable global supply of LNG for bunkering can be complex, involving specialized vessels and logistics.
- Competition from Other Alternative Fuels: Emerging alternative fuels like methanol and ammonia present competitive options that could impact LNG's market share in the long term.
- Price Volatility of Natural Gas: While generally more stable than oil, natural gas prices can experience fluctuations that might impact the long-term cost advantage.
Emerging Opportunities in US LNG Bunkering Industry
Emerging opportunities within the US LNG bunkering industry are diverse and poised for significant growth. The expansion of small-scale LNG liquefaction plants closer to end-user markets, particularly along the US coastlines and inland waterways, presents a significant opportunity to enhance accessibility and reduce logistical costs. Furthermore, the development of innovative bunkering solutions, such as floating storage and regasification units (FSRUs) adapted for bunkering and the integration of LNG with other renewable energy sources for vessel propulsion, are opening new avenues. The increasing global demand for decarbonization in the maritime sector is also creating opportunities for US LNG suppliers to establish strategic partnerships with international shipping companies and port authorities, thereby expanding their global reach and influence in the bunkering market.
Growth Accelerators in the US LNG Bunkering Industry Industry
Several catalysts are accelerating the growth of the US LNG bunkering industry. Technological breakthroughs in membrane tank designs for vessel storage and advancements in cryogenic transfer systems are enhancing the safety and efficiency of LNG handling. Strategic partnerships between LNG producers, terminal operators, and shipping companies, exemplified by collaborations between entities like Harvey Gulf International Marine LLC and major oil companies, are crucial for de-risking investments and securing supply chains. Furthermore, government incentives, port authority investments in LNG bunkering infrastructure, and the continued drive by major shipping lines to meet stringent environmental targets are creating a favorable ecosystem for widespread LNG adoption, solidifying its position as a leading transitional marine fuel.
Key Players Shaping the US LNG Bunkering Industry Market
- NorthStar Holdco Energy LLC
- Harvey Gulf International Marine LLC
- Eagle LNG Partners LLC
- Crowley Maritime Corporation
- Royal Dutch Shell PLC
- Conrad Shipyards LLC
- JAX LNG LLC
Notable Milestones in US LNG Bunkering Industry Sector
- 2019: First LNG bunkering operation in the US Gulf Coast for offshore support vessels.
- 2020: Launch of dedicated LNG-powered tugs, increasing demand for bunkering services in key ports.
- 2021: Significant expansion of LNG bunkering infrastructure in major US ports like Jacksonville and Houston.
- 2022: Increased adoption of LNG for container ships, with major shipping lines announcing fleet conversions.
- 2023: Development and deployment of innovative floating LNG bunkering solutions.
- 2024: Further consolidation and strategic partnerships forming to optimize the LNG supply chain.
In-Depth US LNG Bunkering Industry Market Outlook
The outlook for the US LNG bunkering industry is exceptionally strong, driven by a clear regulatory imperative and accelerating market acceptance. Growth accelerators include ongoing technological innovations in liquefaction and distribution, enhancing the economic viability and accessibility of LNG. Strategic partnerships among key industry players are crucial for building out a comprehensive bunkering network across major US ports and international shipping routes, effectively mitigating supply chain risks and fostering confidence among vessel operators. The increasing environmental awareness among consumers and stakeholders, coupled with potential future carbon pricing mechanisms, will further solidify LNG's position as a preferred transitional fuel. The industry is expected to witness continued expansion of its market share within the broader marine fuel landscape, driven by a commitment to sustainability and operational efficiency.
US LNG Bunkering Industry Segmentation
-
1. End-User
- 1.1. Tanker Fleet
- 1.2. Container Fleet
- 1.3. Bulk and General Cargo Fleet
- 1.4. Ferries and OSV
- 1.5. Others
US LNG Bunkering Industry Segmentation By Geography
-
1. North America
- 1.1. United States
- 1.2. Canada
- 1.3. Mexico
-
2. South America
- 2.1. Brazil
- 2.2. Argentina
- 2.3. Rest of South America
-
3. Europe
- 3.1. United Kingdom
- 3.2. Germany
- 3.3. France
- 3.4. Italy
- 3.5. Spain
- 3.6. Russia
- 3.7. Benelux
- 3.8. Nordics
- 3.9. Rest of Europe
-
4. Middle East & Africa
- 4.1. Turkey
- 4.2. Israel
- 4.3. GCC
- 4.4. North Africa
- 4.5. South Africa
- 4.6. Rest of Middle East & Africa
-
5. Asia Pacific
- 5.1. China
- 5.2. India
- 5.3. Japan
- 5.4. South Korea
- 5.5. ASEAN
- 5.6. Oceania
- 5.7. Rest of Asia Pacific
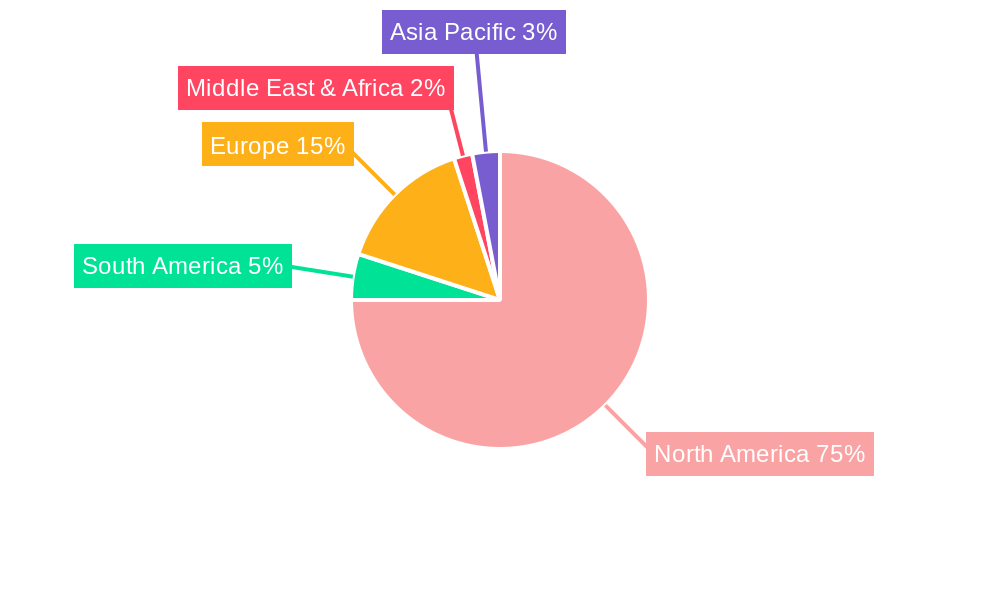
US LNG Bunkering Industry Regional Market Share
Geographic Coverage of US LNG Bunkering Industry
US LNG Bunkering Industry REPORT HIGHLIGHTS
| Aspects | Details |
|---|---|
| Study Period | 2020-2034 |
| Base Year | 2025 |
| Estimated Year | 2026 |
| Forecast Period | 2026-2034 |
| Historical Period | 2020-2025 |
| Growth Rate | CAGR of 26.9% from 2020-2034 |
| Segmentation |
|
Table of Contents
- 1. Introduction
- 1.1. Research Scope
- 1.2. Market Segmentation
- 1.3. Research Objective
- 1.4. Definitions and Assumptions
- 2. Executive Summary
- 2.1. Market Snapshot
- 3. Market Dynamics
- 3.1. Market Drivers
- 3.2. Market Restrains
- 3.3. Market Trends
- 3.4. Market Opportunities
- 4. Market Factor Analysis
- 4.1. Porters Five Forces
- 4.1.1. Bargaining Power of Suppliers
- 4.1.2. Bargaining Power of Buyers
- 4.1.3. Threat of New Entrants
- 4.1.4. Threat of Substitutes
- 4.1.5. Competitive Rivalry
- 4.2. PESTEL analysis
- 4.3. BCG Analysis
- 4.3.1. Stars (High Growth, High Market Share)
- 4.3.2. Cash Cows (Low Growth, High Market Share)
- 4.3.3. Question Mark (High Growth, Low Market Share)
- 4.3.4. Dogs (Low Growth, Low Market Share)
- 4.4. Ansoff Matrix Analysis
- 4.5. Supply Chain Analysis
- 4.6. Regulatory Landscape
- 4.7. Current Market Potential and Opportunity Assessment (TAM–SAM–SOM Framework)
- 4.8. NRP Analyst Note
- 4.1. Porters Five Forces
- 5. Market Analysis, Insights and Forecast 2021-2033
- 5.1. Market Analysis, Insights and Forecast - by End-User
- 5.1.1. Tanker Fleet
- 5.1.2. Container Fleet
- 5.1.3. Bulk and General Cargo Fleet
- 5.1.4. Ferries and OSV
- 5.1.5. Others
- 5.2. Market Analysis, Insights and Forecast - by Region
- 5.2.1. North America
- 5.2.2. South America
- 5.2.3. Europe
- 5.2.4. Middle East & Africa
- 5.2.5. Asia Pacific
- 5.1. Market Analysis, Insights and Forecast - by End-User
- 6. Global US LNG Bunkering Industry Analysis, Insights and Forecast, 2021-2033
- 6.1. Market Analysis, Insights and Forecast - by End-User
- 6.1.1. Tanker Fleet
- 6.1.2. Container Fleet
- 6.1.3. Bulk and General Cargo Fleet
- 6.1.4. Ferries and OSV
- 6.1.5. Others
- 6.1. Market Analysis, Insights and Forecast - by End-User
- 7. North America US LNG Bunkering Industry Analysis, Insights and Forecast, 2020-2032
- 7.1. Market Analysis, Insights and Forecast - by End-User
- 7.1.1. Tanker Fleet
- 7.1.2. Container Fleet
- 7.1.3. Bulk and General Cargo Fleet
- 7.1.4. Ferries and OSV
- 7.1.5. Others
- 7.1. Market Analysis, Insights and Forecast - by End-User
- 8. South America US LNG Bunkering Industry Analysis, Insights and Forecast, 2020-2032
- 8.1. Market Analysis, Insights and Forecast - by End-User
- 8.1.1. Tanker Fleet
- 8.1.2. Container Fleet
- 8.1.3. Bulk and General Cargo Fleet
- 8.1.4. Ferries and OSV
- 8.1.5. Others
- 8.1. Market Analysis, Insights and Forecast - by End-User
- 9. Europe US LNG Bunkering Industry Analysis, Insights and Forecast, 2020-2032
- 9.1. Market Analysis, Insights and Forecast - by End-User
- 9.1.1. Tanker Fleet
- 9.1.2. Container Fleet
- 9.1.3. Bulk and General Cargo Fleet
- 9.1.4. Ferries and OSV
- 9.1.5. Others
- 9.1. Market Analysis, Insights and Forecast - by End-User
- 10. Middle East & Africa US LNG Bunkering Industry Analysis, Insights and Forecast, 2020-2032
- 10.1. Market Analysis, Insights and Forecast - by End-User
- 10.1.1. Tanker Fleet
- 10.1.2. Container Fleet
- 10.1.3. Bulk and General Cargo Fleet
- 10.1.4. Ferries and OSV
- 10.1.5. Others
- 10.1. Market Analysis, Insights and Forecast - by End-User
- 11. Asia Pacific US LNG Bunkering Industry Analysis, Insights and Forecast, 2020-2032
- 11.1. Market Analysis, Insights and Forecast - by End-User
- 11.1.1. Tanker Fleet
- 11.1.2. Container Fleet
- 11.1.3. Bulk and General Cargo Fleet
- 11.1.4. Ferries and OSV
- 11.1.5. Others
- 11.1. Market Analysis, Insights and Forecast - by End-User
- 12. Competitive Analysis
- 12.1. Company Profiles
- 12.1.1 NorthStar Holdco Energy LLC
- 12.1.1.1. Company Overview
- 12.1.1.2. Products
- 12.1.1.3. Company Financials
- 12.1.1.4. SWOT Analysis
- 12.1.2 Harvey Gulf International Marine LLC
- 12.1.2.1. Company Overview
- 12.1.2.2. Products
- 12.1.2.3. Company Financials
- 12.1.2.4. SWOT Analysis
- 12.1.3 Eagle LNG Partners LLC
- 12.1.3.1. Company Overview
- 12.1.3.2. Products
- 12.1.3.3. Company Financials
- 12.1.3.4. SWOT Analysis
- 12.1.4 Crowley Maritime Corporation
- 12.1.4.1. Company Overview
- 12.1.4.2. Products
- 12.1.4.3. Company Financials
- 12.1.4.4. SWOT Analysis
- 12.1.5 Royal Dutch Shell PLC
- 12.1.5.1. Company Overview
- 12.1.5.2. Products
- 12.1.5.3. Company Financials
- 12.1.5.4. SWOT Analysis
- 12.1.6 Conrad Shipyards LLC
- 12.1.6.1. Company Overview
- 12.1.6.2. Products
- 12.1.6.3. Company Financials
- 12.1.6.4. SWOT Analysis
- 12.1.7 JAX LNG LLC
- 12.1.7.1. Company Overview
- 12.1.7.2. Products
- 12.1.7.3. Company Financials
- 12.1.7.4. SWOT Analysis
- 12.1.1 NorthStar Holdco Energy LLC
- 12.2. Market Entropy
- 12.2.1 Company's Key Areas Served
- 12.2.2 Recent Developments
- 12.3. Company Market Share Analysis 2025
- 12.3.1 Top 5 Companies Market Share Analysis
- 12.3.2 Top 3 Companies Market Share Analysis
- 12.4. List of Potential Customers
- 13. Research Methodology
List of Figures
- Figure 1: Global US LNG Bunkering Industry Revenue Breakdown (billion, %) by Region 2025 & 2033
- Figure 2: North America US LNG Bunkering Industry Revenue (billion), by End-User 2025 & 2033
- Figure 3: North America US LNG Bunkering Industry Revenue Share (%), by End-User 2025 & 2033
- Figure 4: North America US LNG Bunkering Industry Revenue (billion), by Country 2025 & 2033
- Figure 5: North America US LNG Bunkering Industry Revenue Share (%), by Country 2025 & 2033
- Figure 6: South America US LNG Bunkering Industry Revenue (billion), by End-User 2025 & 2033
- Figure 7: South America US LNG Bunkering Industry Revenue Share (%), by End-User 2025 & 2033
- Figure 8: South America US LNG Bunkering Industry Revenue (billion), by Country 2025 & 2033
- Figure 9: South America US LNG Bunkering Industry Revenue Share (%), by Country 2025 & 2033
- Figure 10: Europe US LNG Bunkering Industry Revenue (billion), by End-User 2025 & 2033
- Figure 11: Europe US LNG Bunkering Industry Revenue Share (%), by End-User 2025 & 2033
- Figure 12: Europe US LNG Bunkering Industry Revenue (billion), by Country 2025 & 2033
- Figure 13: Europe US LNG Bunkering Industry Revenue Share (%), by Country 2025 & 2033
- Figure 14: Middle East & Africa US LNG Bunkering Industry Revenue (billion), by End-User 2025 & 2033
- Figure 15: Middle East & Africa US LNG Bunkering Industry Revenue Share (%), by End-User 2025 & 2033
- Figure 16: Middle East & Africa US LNG Bunkering Industry Revenue (billion), by Country 2025 & 2033
- Figure 17: Middle East & Africa US LNG Bunkering Industry Revenue Share (%), by Country 2025 & 2033
- Figure 18: Asia Pacific US LNG Bunkering Industry Revenue (billion), by End-User 2025 & 2033
- Figure 19: Asia Pacific US LNG Bunkering Industry Revenue Share (%), by End-User 2025 & 2033
- Figure 20: Asia Pacific US LNG Bunkering Industry Revenue (billion), by Country 2025 & 2033
- Figure 21: Asia Pacific US LNG Bunkering Industry Revenue Share (%), by Country 2025 & 2033
List of Tables
- Table 1: Global US LNG Bunkering Industry Revenue billion Forecast, by End-User 2020 & 2033
- Table 2: Global US LNG Bunkering Industry Revenue billion Forecast, by Region 2020 & 2033
- Table 3: Global US LNG Bunkering Industry Revenue billion Forecast, by End-User 2020 & 2033
- Table 4: Global US LNG Bunkering Industry Revenue billion Forecast, by Country 2020 & 2033
- Table 5: United States US LNG Bunkering Industry Revenue (billion) Forecast, by Application 2020 & 2033
- Table 6: Canada US LNG Bunkering Industry Revenue (billion) Forecast, by Application 2020 & 2033
- Table 7: Mexico US LNG Bunkering Industry Revenue (billion) Forecast, by Application 2020 & 2033
- Table 8: Global US LNG Bunkering Industry Revenue billion Forecast, by End-User 2020 & 2033
- Table 9: Global US LNG Bunkering Industry Revenue billion Forecast, by Country 2020 & 2033
- Table 10: Brazil US LNG Bunkering Industry Revenue (billion) Forecast, by Application 2020 & 2033
- Table 11: Argentina US LNG Bunkering Industry Revenue (billion) Forecast, by Application 2020 & 2033
- Table 12: Rest of South America US LNG Bunkering Industry Revenue (billion) Forecast, by Application 2020 & 2033
- Table 13: Global US LNG Bunkering Industry Revenue billion Forecast, by End-User 2020 & 2033
- Table 14: Global US LNG Bunkering Industry Revenue billion Forecast, by Country 2020 & 2033
- Table 15: United Kingdom US LNG Bunkering Industry Revenue (billion) Forecast, by Application 2020 & 2033
- Table 16: Germany US LNG Bunkering Industry Revenue (billion) Forecast, by Application 2020 & 2033
- Table 17: France US LNG Bunkering Industry Revenue (billion) Forecast, by Application 2020 & 2033
- Table 18: Italy US LNG Bunkering Industry Revenue (billion) Forecast, by Application 2020 & 2033
- Table 19: Spain US LNG Bunkering Industry Revenue (billion) Forecast, by Application 2020 & 2033
- Table 20: Russia US LNG Bunkering Industry Revenue (billion) Forecast, by Application 2020 & 2033
- Table 21: Benelux US LNG Bunkering Industry Revenue (billion) Forecast, by Application 2020 & 2033
- Table 22: Nordics US LNG Bunkering Industry Revenue (billion) Forecast, by Application 2020 & 2033
- Table 23: Rest of Europe US LNG Bunkering Industry Revenue (billion) Forecast, by Application 2020 & 2033
- Table 24: Global US LNG Bunkering Industry Revenue billion Forecast, by End-User 2020 & 2033
- Table 25: Global US LNG Bunkering Industry Revenue billion Forecast, by Country 2020 & 2033
- Table 26: Turkey US LNG Bunkering Industry Revenue (billion) Forecast, by Application 2020 & 2033
- Table 27: Israel US LNG Bunkering Industry Revenue (billion) Forecast, by Application 2020 & 2033
- Table 28: GCC US LNG Bunkering Industry Revenue (billion) Forecast, by Application 2020 & 2033
- Table 29: North Africa US LNG Bunkering Industry Revenue (billion) Forecast, by Application 2020 & 2033
- Table 30: South Africa US LNG Bunkering Industry Revenue (billion) Forecast, by Application 2020 & 2033
- Table 31: Rest of Middle East & Africa US LNG Bunkering Industry Revenue (billion) Forecast, by Application 2020 & 2033
- Table 32: Global US LNG Bunkering Industry Revenue billion Forecast, by End-User 2020 & 2033
- Table 33: Global US LNG Bunkering Industry Revenue billion Forecast, by Country 2020 & 2033
- Table 34: China US LNG Bunkering Industry Revenue (billion) Forecast, by Application 2020 & 2033
- Table 35: India US LNG Bunkering Industry Revenue (billion) Forecast, by Application 2020 & 2033
- Table 36: Japan US LNG Bunkering Industry Revenue (billion) Forecast, by Application 2020 & 2033
- Table 37: South Korea US LNG Bunkering Industry Revenue (billion) Forecast, by Application 2020 & 2033
- Table 38: ASEAN US LNG Bunkering Industry Revenue (billion) Forecast, by Application 2020 & 2033
- Table 39: Oceania US LNG Bunkering Industry Revenue (billion) Forecast, by Application 2020 & 2033
- Table 40: Rest of Asia Pacific US LNG Bunkering Industry Revenue (billion) Forecast, by Application 2020 & 2033
Frequently Asked Questions
1. What is the projected Compound Annual Growth Rate (CAGR) of the US LNG Bunkering Industry?
The projected CAGR is approximately 26.9%.
2. Which companies are prominent players in the US LNG Bunkering Industry?
Key companies in the market include NorthStar Holdco Energy LLC, Harvey Gulf International Marine LLC, Eagle LNG Partners LLC, Crowley Maritime Corporation, Royal Dutch Shell PLC, Conrad Shipyards LLC, JAX LNG LLC.
3. What are the main segments of the US LNG Bunkering Industry?
The market segments include End-User.
4. Can you provide details about the market size?
The market size is estimated to be USD 1.8 billion as of 2022.
5. What are some drivers contributing to market growth?
4.; Increasing Production from Unconventional Sources4.; Growing Energy Demand in the Region.
6. What are the notable trends driving market growth?
Container Fleet is Expected to Dominate in the Market.
7. Are there any restraints impacting market growth?
4.; Environmental Concerns.
8. Can you provide examples of recent developments in the market?
N/A
9. What pricing options are available for accessing the report?
Pricing options include single-user, multi-user, and enterprise licenses priced at USD 3800, USD 4500, and USD 5800 respectively.
10. Is the market size provided in terms of value or volume?
The market size is provided in terms of value, measured in billion.
11. Are there any specific market keywords associated with the report?
Yes, the market keyword associated with the report is "US LNG Bunkering Industry," which aids in identifying and referencing the specific market segment covered.
12. How do I determine which pricing option suits my needs best?
The pricing options vary based on user requirements and access needs. Individual users may opt for single-user licenses, while businesses requiring broader access may choose multi-user or enterprise licenses for cost-effective access to the report.
13. Are there any additional resources or data provided in the US LNG Bunkering Industry report?
While the report offers comprehensive insights, it's advisable to review the specific contents or supplementary materials provided to ascertain if additional resources or data are available.
14. How can I stay updated on further developments or reports in the US LNG Bunkering Industry?
To stay informed about further developments, trends, and reports in the US LNG Bunkering Industry, consider subscribing to industry newsletters, following relevant companies and organizations, or regularly checking reputable industry news sources and publications.
Methodology
Step 1 - Identification of Relevant Samples Size from Population Database


Step 2 - Approaches for Defining Global Market Size (Value, Volume* & Price*)

Note*: In applicable scenarios
Step 3 - Data Sources
Primary Research
- Web Analytics
- Survey Reports
- Research Institute
- Latest Research Reports
- Opinion Leaders
Secondary Research
- Annual Reports
- White Paper
- Latest Press Release
- Industry Association
- Paid Database
- Investor Presentations

Step 4 - Data Triangulation
Involves using different sources of information in order to increase the validity of a study
These sources are likely to be stakeholders in a program - participants, other researchers, program staff, other community members, and so on.
Then we put all data in single framework & apply various statistical tools to find out the dynamic on the market.
During the analysis stage, feedback from the stakeholder groups would be compared to determine areas of agreement as well as areas of divergence