

Key Insights
The United States shale gas industry is poised for substantial growth, with the market size projected to reach $94.34 billion in 2025. This expansion is fueled by a robust compound annual growth rate (CAGR) of 7.05%, indicating a dynamic and expanding sector. Key drivers for this growth include increasing demand for natural gas as a cleaner alternative to coal in power generation, advancements in drilling and extraction technologies that enhance efficiency and reduce costs, and the strategic importance of energy independence for the United States. The industry is also benefiting from significant investments in midstream infrastructure, facilitating the transportation and processing of shale gas. Furthermore, the burgeoning export market for Liquefied Natural Gas (LNG) is a major catalyst, allowing U.S. producers to tap into global demand.
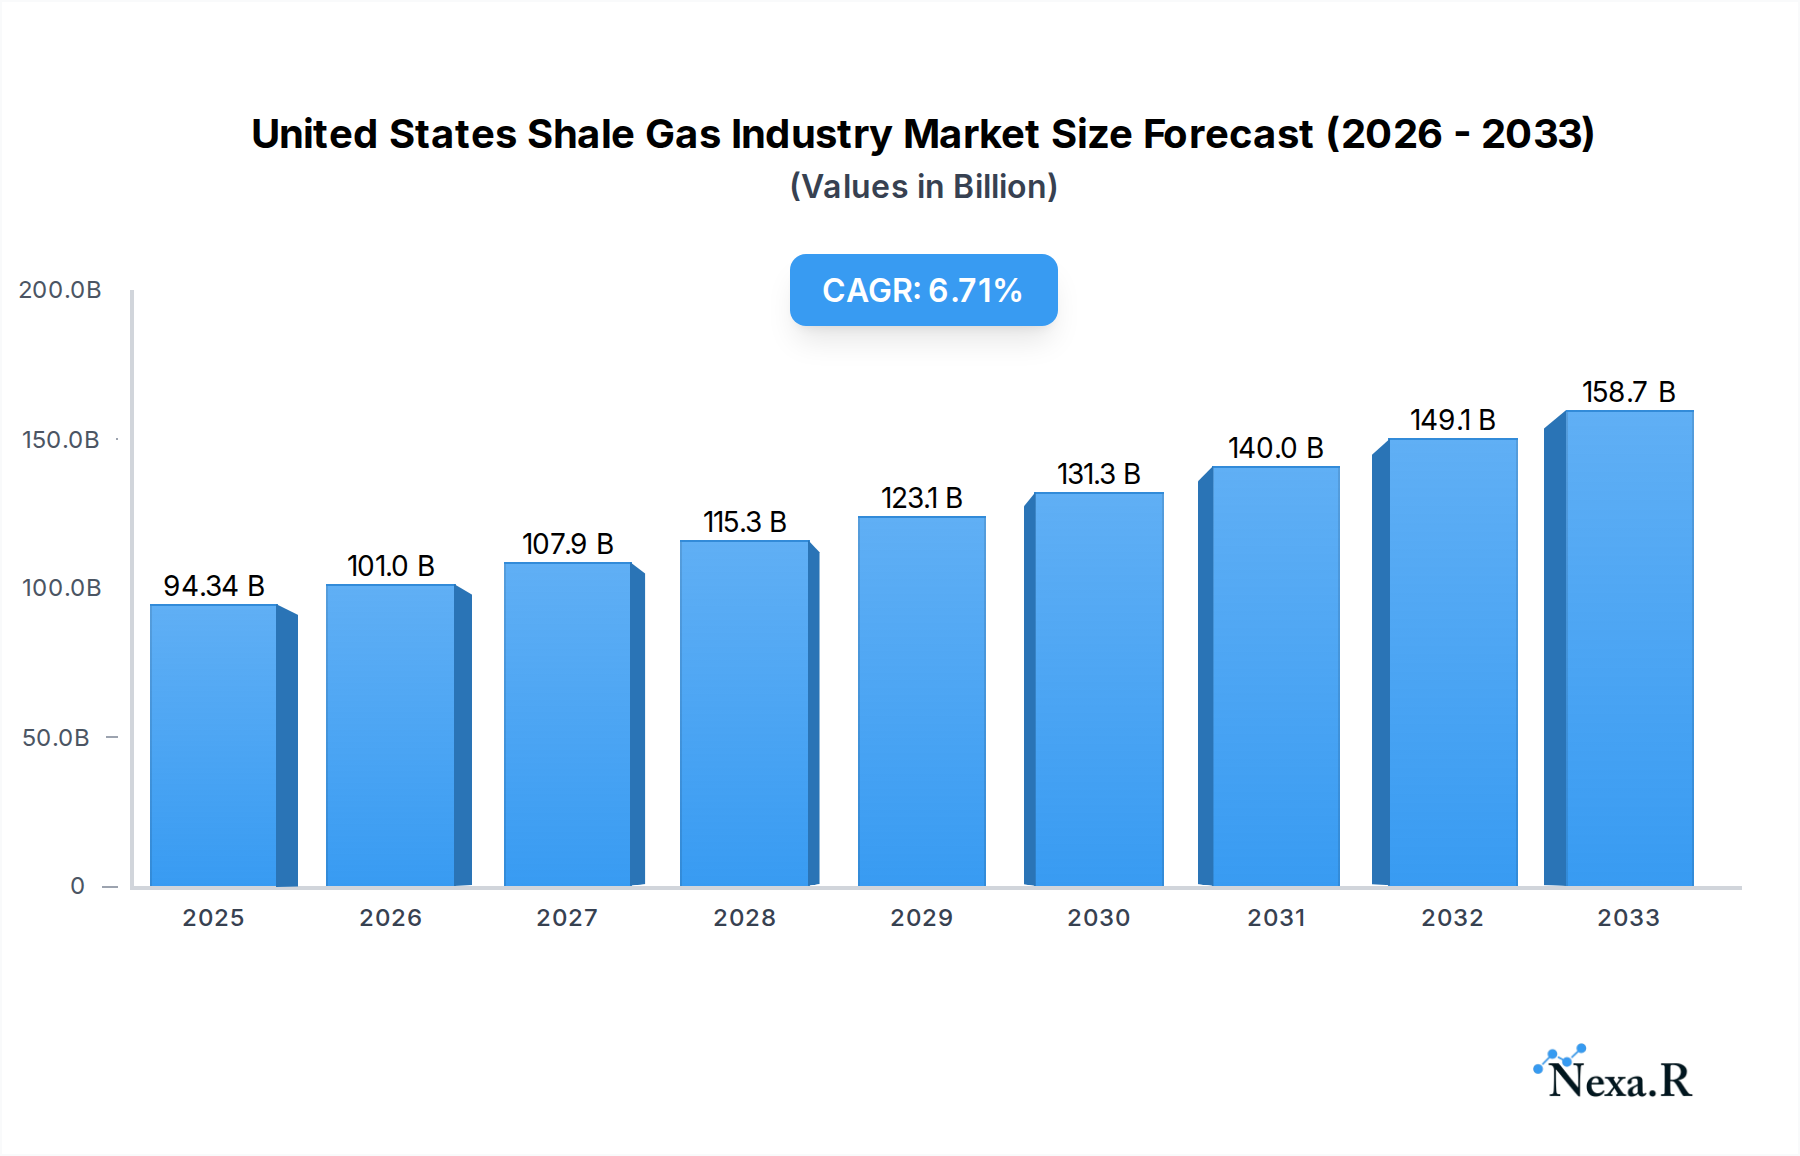
United States Shale Gas Industry Market Size (In Billion)
The prevailing trends in the U.S. shale gas market point towards continued technological innovation, with a focus on optimizing well productivity and minimizing environmental impact through practices like water recycling and reduced methane emissions. Companies are increasingly adopting digital solutions for better data analytics and operational efficiency. However, certain restraints could influence the pace of growth. These include evolving regulatory landscapes, potential public perception challenges related to hydraulic fracturing, and the inherent volatility of natural gas prices, which can impact investment decisions and profitability. Despite these challenges, the segment encompassing both shale gas and shale oil is expected to witness continued dominance by major players like Shell PLC, Exxon Mobil Corporation, and Chevron Corporation, who are strategically positioned to leverage the abundant reserves and growing market opportunities within the United States.

United States Shale Gas Industry Company Market Share
United States Shale Gas Industry Report: Market Dynamics, Growth Trends, and Future Outlook (2019-2033)
This comprehensive report offers an in-depth analysis of the United States shale gas industry, encompassing both parent and child markets. It provides critical insights into market dynamics, growth trajectories, regional dominance, product landscape, key drivers, challenges, emerging opportunities, growth accelerators, and the influential players shaping this vital sector. With a study period spanning from 2019 to 2033, and a base year of 2025, this report is an essential resource for industry professionals, investors, and policymakers seeking to understand the evolving landscape of US shale gas production.
United States Shale Gas Industry Market Dynamics & Structure
The United States shale gas industry is characterized by a moderately concentrated market, with a few major players dominating production. However, the landscape is dynamic, with ongoing consolidation and divestitures reflecting strategic shifts in the energy sector. Technological innovation remains a primary driver, with advancements in horizontal drilling and hydraulic fracturing continually enhancing extraction efficiency and reducing costs. The regulatory framework is complex, balancing environmental concerns with the economic imperative of energy production. Competitive product substitutes, primarily from renewable energy sources, are increasingly influencing market dynamics, though natural gas continues to play a crucial role in the energy mix. End-user demographics are diverse, ranging from industrial consumers and power generation to residential heating.
- Market Concentration: Dominated by a handful of large integrated energy companies, but with significant activity from independent producers.
- Technological Innovation: Continuous improvement in hydraulic fracturing techniques, enhanced oil recovery (EOR) methods, and seismic imaging.
- Regulatory Frameworks: Evolving environmental regulations concerning water usage, emissions, and land reclamation significantly impact operational strategies and costs.
- Competitive Product Substitutes: Growing influence of renewable energy (solar, wind) and alternative fuels, necessitating cost competitiveness for shale gas.
- End-User Demographics: Driven by demand from power generation, industrial feedstock, and residential/commercial heating sectors.
- M&A Trends: Active M&A landscape driven by portfolio optimization, focus on core assets, and pursuit of economies of scale. For instance, in September 2021, Shell PLC sold its Permian Basin assets to ConocoPhillips for USD 9.5 billion, signaling a strategic shift.
United States Shale Gas Industry Growth Trends & Insights
The United States shale gas industry is poised for sustained growth, driven by robust demand and ongoing technological advancements. The market size is projected to expand significantly over the forecast period, with a projected Compound Annual Growth Rate (CAGR) of approximately 5.5%. This growth is fueled by increasing adoption rates of advanced extraction technologies, particularly in established shale plays like the Permian Basin and the Marcellus Shale. Technological disruptions, such as improved well productivity and enhanced seismic data interpretation, are continuously pushing the boundaries of economic viability. Consumer behavior shifts, including the increasing preference for natural gas as a cleaner-burning fossil fuel compared to coal in power generation, further bolster demand. The integration of digital technologies, including AI and IoT, for operational efficiency and predictive maintenance is also a key trend.
- Market Size Evolution: The US shale gas market, valued at approximately USD 250 billion in 2024, is expected to reach over USD 400 billion by 2033.
- Adoption Rates: High adoption rates for multi-stage fracturing, horizontal drilling, and advanced water recycling technologies.
- Technological Disruptions: Innovations in drilling speed, completion techniques, and reservoir characterization are unlocking previously uneconomical reserves.
- Consumer Behavior Shifts: Growing preference for natural gas in power generation and industrial applications due to its lower carbon footprint compared to coal.
- Market Penetration: Continued penetration of natural gas into various energy segments, displacing other fossil fuels.
Dominant Regions, Countries, or Segments in United States Shale Gas Industry
The Permian Basin stands out as the dominant region driving growth in the United States shale gas and shale oil industry. Its unparalleled geological characteristics, vast proven reserves, and extensive infrastructure have solidified its position as the premier shale play. Within the Permian Basin, the interplay between shale gas and shale oil production creates a synergistic environment, where advancements in one segment often benefit the other. The shale oil segment within the Permian Basin, in particular, has experienced remarkable growth, attracting significant investment and technological innovation.
- Dominant Region: The Permian Basin (spanning parts of Texas and New Mexico) is the epicenter of US shale production.
- Key Drivers in the Permian Basin:
- Abundant Hydrocarbon Reserves: Vast quantities of both oil and natural gas.
- Mature Infrastructure: Extensive pipeline networks, processing facilities, and transportation hubs.
- Technological Advancements: Continuous innovation in drilling and completion techniques optimized for Permian geology.
- Economic Policies: Supportive state-level regulations and fiscal incentives.
- Industry Expertise: Concentration of skilled workforce and specialized service companies.
- Market Share & Growth Potential: The Permian Basin accounts for over 60% of US shale oil production and a significant portion of its shale gas output, with continued growth potential due to ongoing exploration and enhanced recovery efforts.
- Segment Dominance: While both shale gas and shale oil are critical, the shale oil segment within the Permian Basin has historically driven higher revenue generation and investment, influencing overall market dynamics.
United States Shale Gas Industry Product Landscape
The product landscape of the US shale gas industry primarily revolves around the extraction and processing of natural gas and shale oil. Innovations focus on improving the purity and efficiency of these products. Advanced separation techniques ensure higher quality natural gas, often referred to as "dry gas" or "wet gas" depending on hydrocarbon content. Shale oil production yields a range of crude oil grades, with ongoing efforts to optimize extraction for light sweet crude. The industry also produces associated byproducts like natural gas liquids (NGLs) such as ethane, propane, and butane, which serve as crucial feedstocks for the petrochemical industry. Technological advancements aim to minimize environmental impact through closed-loop systems for water management and emissions control, enhancing the overall performance and sustainability of the extracted resources.
Key Drivers, Barriers & Challenges in United States Shale Gas Industry
The United States shale gas industry is propelled by several key drivers, including robust domestic and global demand for natural gas and oil, significant advancements in extraction technologies, and supportive government policies aimed at energy independence. The economic viability of extracting reserves previously deemed uneconomical, coupled with the nation's vast shale resources, forms a strong foundation for growth.
However, the industry faces considerable barriers and challenges. Environmental concerns related to water usage, seismic activity, and air emissions are subject to increasing scrutiny and regulatory pressure. Supply chain disruptions, particularly for specialized equipment and skilled labor, can impact operational efficiency and costs. Price volatility in global oil and gas markets creates inherent risks, influencing investment decisions and profitability.
- Key Drivers:
- Strong Demand: Sustained demand from power generation, industrial sectors, and exports.
- Technological Sophistication: Continuous innovation in drilling and fracturing techniques.
- Resource Abundance: Extensive proven shale reserves across multiple basins.
- Energy Independence Goals: National drive to reduce reliance on foreign energy sources.
- Barriers & Challenges:
- Environmental Regulations: Stricter rules on emissions, water management, and land use.
- Supply Chain Bottlenecks: Shortages of skilled labor and specialized equipment.
- Price Volatility: Fluctuations in global commodity prices impacting profitability.
- Infrastructure Limitations: Need for expanded pipeline capacity and processing facilities.
- Public Perception: Ongoing debates regarding the environmental impact of fracking.
Emerging Opportunities in United States Shale Gas Industry
Emerging opportunities in the United States shale gas industry lie in the expansion of liquefied natural gas (LNG) exports, catering to growing international demand, particularly in Asia and Europe. The increasing focus on carbon capture, utilization, and storage (CCUS) technologies presents a significant opportunity to mitigate the environmental impact of shale gas production, making it a more sustainable energy source. Furthermore, the development of advanced analytics and AI-driven operational optimization can unlock new efficiencies and reduce costs, enhancing competitiveness. Untapped potential exists in smaller, emerging shale plays and in optimizing production from existing, mature fields through enhanced recovery techniques.
Growth Accelerators in the United States Shale Gas Industry Industry
The long-term growth of the United States shale gas industry is being accelerated by several catalysts. Continued technological breakthroughs in drilling efficiency, well stimulation, and digital integration are paramount, enabling deeper and more cost-effective resource extraction. Strategic partnerships and joint ventures among major players and service companies foster collaboration, innovation, and risk-sharing. Market expansion strategies, particularly through increased LNG export capacity and the development of petrochemical infrastructure that utilizes natural gas liquids as feedstock, are driving demand and creating new revenue streams. Government support for energy innovation and infrastructure development also plays a crucial role in accelerating growth.
Key Players Shaping the United States Shale Gas Industry Market
- Shell PLC
- Exxon Mobil Corporation
- Chevron Corporation
- ConocoPhillips Company
- Murphy Oil Corporation
- Baker Hughes Company
- TotalEnergies SE
Notable Milestones in United States Shale Gas Industry Sector
- September 2021: Shell PLC sold its Permian Basin assets to ConocoPhillips for USD 9.5 billion in cash, marking a significant strategic divestment to focus on clean energy transition.
- January 2022: Oil India Ltd (OIL) exited from a US shale oil venture, selling its 20% stake to its venture partner for USD 25 million, divesting its entire stake in the Niobrara shale asset, US.
In-Depth United States Shale Gas Industry Market Outlook
The future market outlook for the United States shale gas industry is characterized by sustained growth, driven by a combination of robust domestic demand and expanding export opportunities. The industry's ability to adapt to evolving environmental regulations and embrace cleaner production technologies will be critical for its long-term success. Strategic investments in advanced extraction techniques, coupled with the development of comprehensive CCUS solutions, will not only enhance operational efficiency but also address environmental concerns, positioning shale gas as a vital component of a balanced energy future. The continued pursuit of market expansion through LNG and petrochemical integration promises to unlock significant value and contribute to the nation's energy security and economic prosperity.
United States Shale Gas Industry Segmentation
-
1. Type
- 1.1. Shale Gas
- 1.2. Shale Oil
United States Shale Gas Industry Segmentation By Geography
- 1. United States
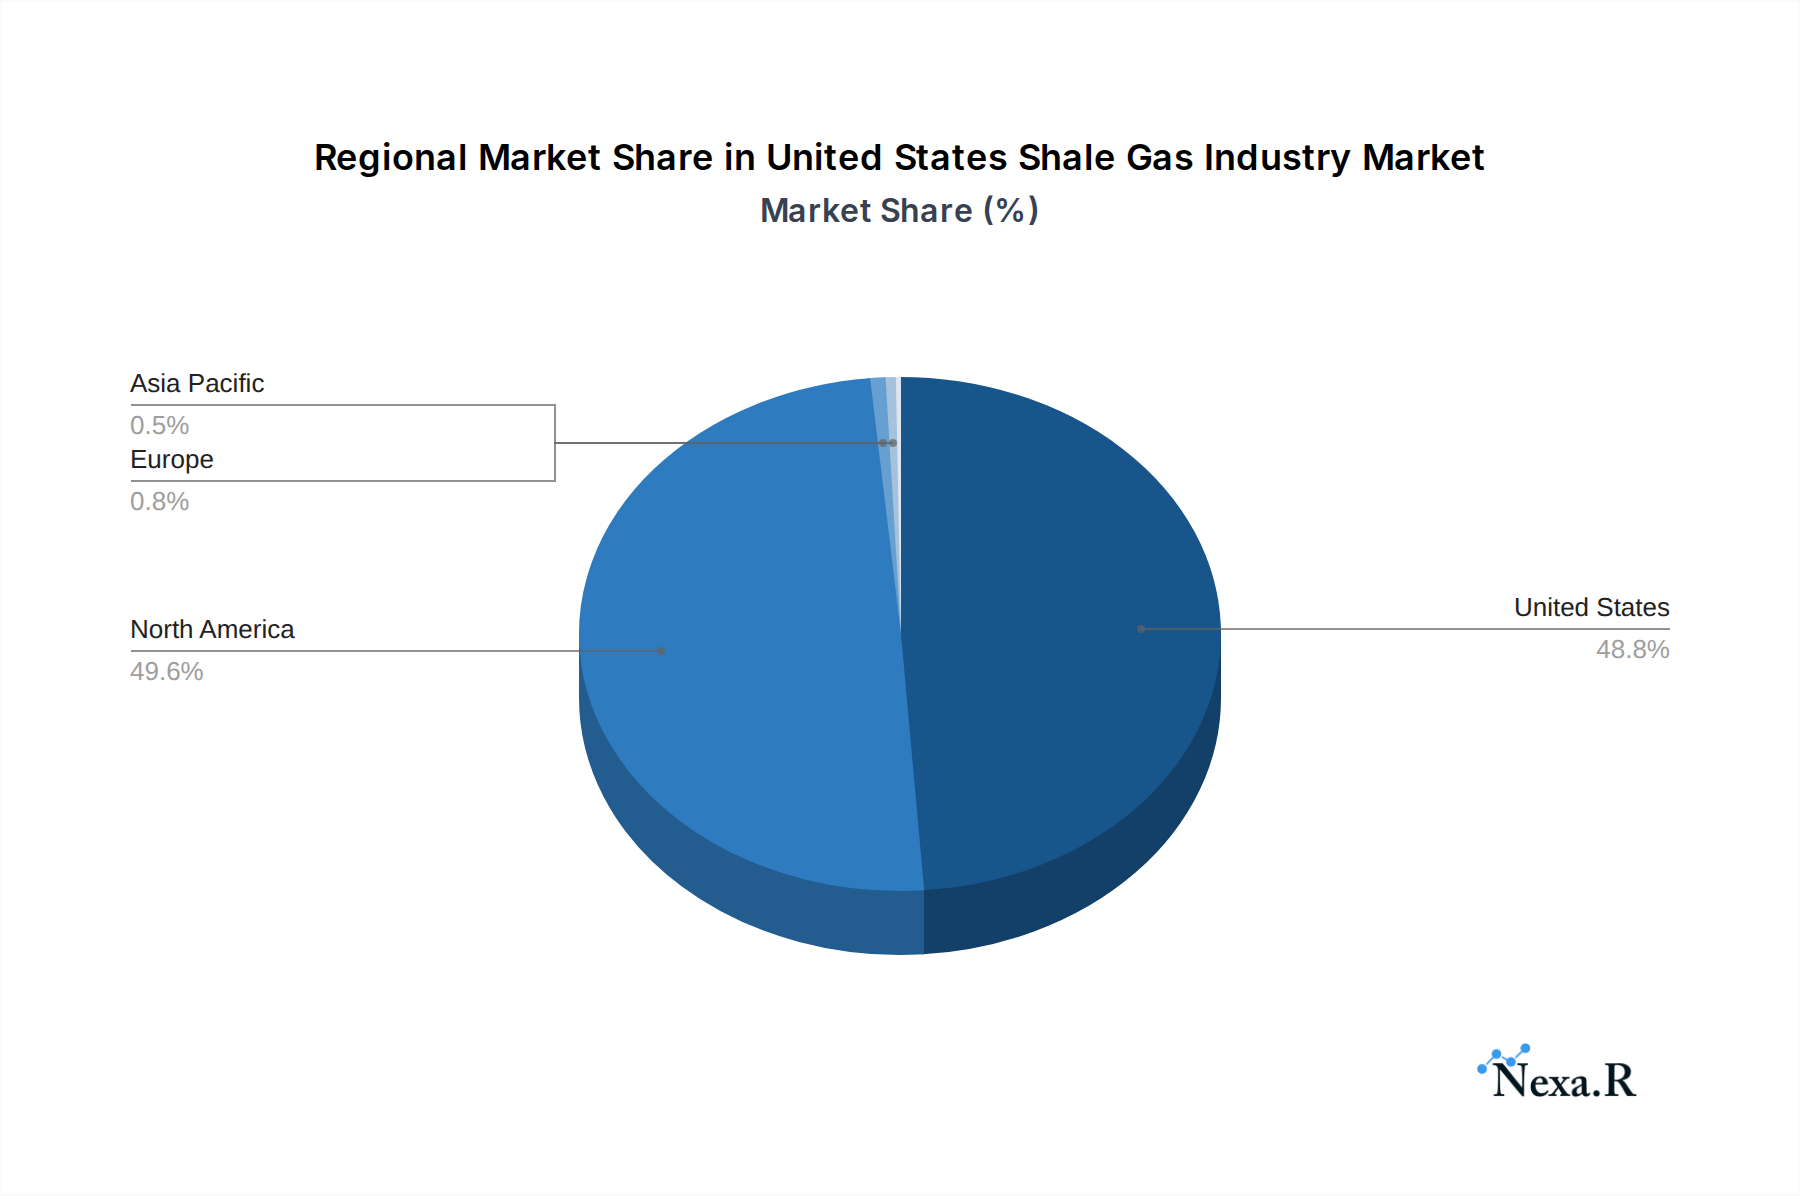
United States Shale Gas Industry Regional Market Share
Geographic Coverage of United States Shale Gas Industry
United States Shale Gas Industry REPORT HIGHLIGHTS
| Aspects | Details |
|---|---|
| Study Period | 2020-2034 |
| Base Year | 2025 |
| Estimated Year | 2026 |
| Forecast Period | 2026-2034 |
| Historical Period | 2020-2025 |
| Growth Rate | CAGR of 7.05% from 2020-2034 |
| Segmentation |
|
Table of Contents
- 1. Introduction
- 1.1. Research Scope
- 1.2. Market Segmentation
- 1.3. Research Objective
- 1.4. Definitions and Assumptions
- 2. Executive Summary
- 2.1. Market Snapshot
- 3. Market Dynamics
- 3.1. Market Drivers
- 3.2. Market Restrains
- 3.3. Market Trends
- 3.4. Market Opportunities
- 4. Market Factor Analysis
- 4.1. Porters Five Forces
- 4.1.1. Bargaining Power of Suppliers
- 4.1.2. Bargaining Power of Buyers
- 4.1.3. Threat of New Entrants
- 4.1.4. Threat of Substitutes
- 4.1.5. Competitive Rivalry
- 4.2. PESTEL analysis
- 4.3. BCG Analysis
- 4.3.1. Stars (High Growth, High Market Share)
- 4.3.2. Cash Cows (Low Growth, High Market Share)
- 4.3.3. Question Mark (High Growth, Low Market Share)
- 4.3.4. Dogs (Low Growth, Low Market Share)
- 4.4. Ansoff Matrix Analysis
- 4.5. Supply Chain Analysis
- 4.6. Regulatory Landscape
- 4.7. Current Market Potential and Opportunity Assessment (TAM–SAM–SOM Framework)
- 4.8. NRP Analyst Note
- 4.1. Porters Five Forces
- 5. Market Analysis, Insights and Forecast 2021-2033
- 5.1. Market Analysis, Insights and Forecast - by Type
- 5.1.1. Shale Gas
- 5.1.2. Shale Oil
- 5.2. Market Analysis, Insights and Forecast - by Region
- 5.2.1. United States
- 5.1. Market Analysis, Insights and Forecast - by Type
- 6. United States Shale Gas Industry Analysis, Insights and Forecast, 2021-2033
- 6.1. Market Analysis, Insights and Forecast - by Type
- 6.1.1. Shale Gas
- 6.1.2. Shale Oil
- 6.1. Market Analysis, Insights and Forecast - by Type
- 7. Competitive Analysis
- 7.1. Company Profiles
- 7.1.1 Shell PLC
- 7.1.1.1. Company Overview
- 7.1.1.2. Products
- 7.1.1.3. Company Financials
- 7.1.1.4. SWOT Analysis
- 7.1.2 Exxon Mobil Corporation
- 7.1.2.1. Company Overview
- 7.1.2.2. Products
- 7.1.2.3. Company Financials
- 7.1.2.4. SWOT Analysis
- 7.1.3 Chevron Corporation
- 7.1.3.1. Company Overview
- 7.1.3.2. Products
- 7.1.3.3. Company Financials
- 7.1.3.4. SWOT Analysis
- 7.1.4 ConocoPhillips Company
- 7.1.4.1. Company Overview
- 7.1.4.2. Products
- 7.1.4.3. Company Financials
- 7.1.4.4. SWOT Analysis
- 7.1.5 Murphy Oil Corporation
- 7.1.5.1. Company Overview
- 7.1.5.2. Products
- 7.1.5.3. Company Financials
- 7.1.5.4. SWOT Analysis
- 7.1.6 Baker Hughes Company
- 7.1.6.1. Company Overview
- 7.1.6.2. Products
- 7.1.6.3. Company Financials
- 7.1.6.4. SWOT Analysis
- 7.1.7 TotalEnergies SE
- 7.1.7.1. Company Overview
- 7.1.7.2. Products
- 7.1.7.3. Company Financials
- 7.1.7.4. SWOT Analysis
- 7.1.1 Shell PLC
- 7.2. Market Entropy
- 7.2.1 Company's Key Areas Served
- 7.2.2 Recent Developments
- 7.3. Company Market Share Analysis 2025
- 7.3.1 Top 5 Companies Market Share Analysis
- 7.3.2 Top 3 Companies Market Share Analysis
- 7.4. List of Potential Customers
- 8. Research Methodology
List of Figures
- Figure 1: United States Shale Gas Industry Revenue Breakdown (billion, %) by Product 2025 & 2033
- Figure 2: United States Shale Gas Industry Share (%) by Company 2025
List of Tables
- Table 1: United States Shale Gas Industry Revenue billion Forecast, by Type 2020 & 2033
- Table 2: United States Shale Gas Industry Volume Trillion Forecast, by Type 2020 & 2033
- Table 3: United States Shale Gas Industry Revenue billion Forecast, by Region 2020 & 2033
- Table 4: United States Shale Gas Industry Volume Trillion Forecast, by Region 2020 & 2033
- Table 5: United States Shale Gas Industry Revenue billion Forecast, by Type 2020 & 2033
- Table 6: United States Shale Gas Industry Volume Trillion Forecast, by Type 2020 & 2033
- Table 7: United States Shale Gas Industry Revenue billion Forecast, by Country 2020 & 2033
- Table 8: United States Shale Gas Industry Volume Trillion Forecast, by Country 2020 & 2033
Frequently Asked Questions
1. What is the projected Compound Annual Growth Rate (CAGR) of the United States Shale Gas Industry?
The projected CAGR is approximately 7.05%.
2. Which companies are prominent players in the United States Shale Gas Industry?
Key companies in the market include Shell PLC, Exxon Mobil Corporation, Chevron Corporation, ConocoPhillips Company, Murphy Oil Corporation, Baker Hughes Company, TotalEnergies SE.
3. What are the main segments of the United States Shale Gas Industry?
The market segments include Type.
4. Can you provide details about the market size?
The market size is estimated to be USD 94.34 billion as of 2022.
5. What are some drivers contributing to market growth?
4.; Modernization and Upgrades of Existing Military Aircraft Fleets4.; Increasing Defense Budgets.
6. What are the notable trends driving market growth?
Shale Gas to Dominate the Market.
7. Are there any restraints impacting market growth?
4.; Shift Toward Unmanned Aircraft.
8. Can you provide examples of recent developments in the market?
In January 2022, Oil India Ltd (OIL) exited from a US shale oil venture, selling its 20% stake to its venture partner for USD 25 million. The company had divested its entire stake in Niobrara shale asset, US.
9. What pricing options are available for accessing the report?
Pricing options include single-user, multi-user, and enterprise licenses priced at USD 3800, USD 4500, and USD 5800 respectively.
10. Is the market size provided in terms of value or volume?
The market size is provided in terms of value, measured in billion and volume, measured in Trillion.
11. Are there any specific market keywords associated with the report?
Yes, the market keyword associated with the report is "United States Shale Gas Industry," which aids in identifying and referencing the specific market segment covered.
12. How do I determine which pricing option suits my needs best?
The pricing options vary based on user requirements and access needs. Individual users may opt for single-user licenses, while businesses requiring broader access may choose multi-user or enterprise licenses for cost-effective access to the report.
13. Are there any additional resources or data provided in the United States Shale Gas Industry report?
While the report offers comprehensive insights, it's advisable to review the specific contents or supplementary materials provided to ascertain if additional resources or data are available.
14. How can I stay updated on further developments or reports in the United States Shale Gas Industry?
To stay informed about further developments, trends, and reports in the United States Shale Gas Industry, consider subscribing to industry newsletters, following relevant companies and organizations, or regularly checking reputable industry news sources and publications.
Methodology
Step 1 - Identification of Relevant Samples Size from Population Database


Step 2 - Approaches for Defining Global Market Size (Value, Volume* & Price*)

Note*: In applicable scenarios
Step 3 - Data Sources
Primary Research
- Web Analytics
- Survey Reports
- Research Institute
- Latest Research Reports
- Opinion Leaders
Secondary Research
- Annual Reports
- White Paper
- Latest Press Release
- Industry Association
- Paid Database
- Investor Presentations

Step 4 - Data Triangulation
Involves using different sources of information in order to increase the validity of a study
These sources are likely to be stakeholders in a program - participants, other researchers, program staff, other community members, and so on.
Then we put all data in single framework & apply various statistical tools to find out the dynamic on the market.
During the analysis stage, feedback from the stakeholder groups would be compared to determine areas of agreement as well as areas of divergence