

Key Insights
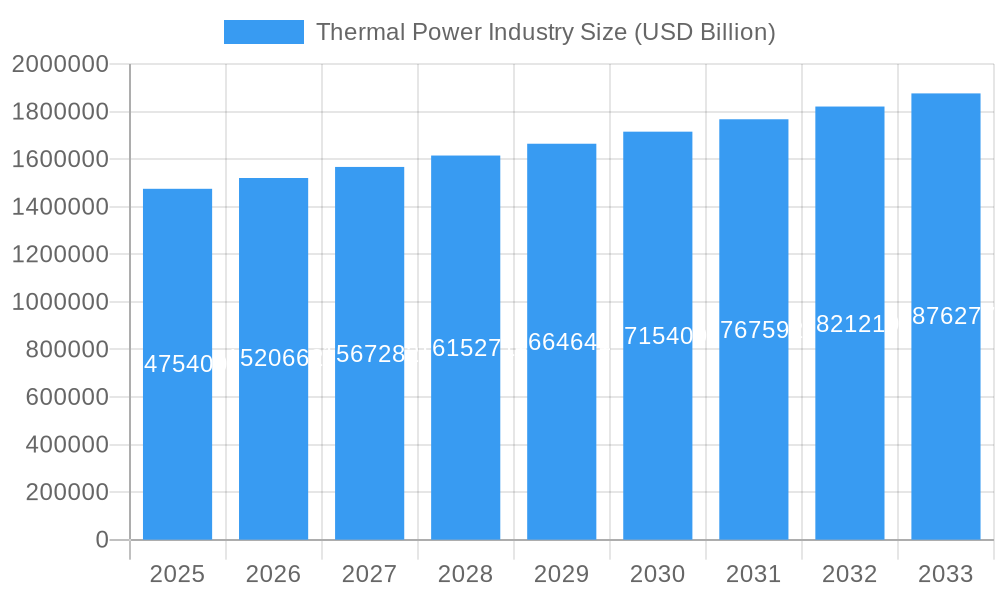
The global Thermal Power Industry is projected to experience robust growth, with a current market size of USD 1,475.40 Billion. This expansion is underpinned by a steady CAGR of 3% over the forecast period of 2025-2033. The industry's dynamism is driven by several factors, including the increasing global demand for electricity to fuel industrialization and urbanization, particularly in developing economies. While thermal power, encompassing coal, gas, and nuclear, remains a cornerstone of energy generation, the sector is witnessing significant investment in efficiency improvements and the integration of cleaner technologies to mitigate environmental impact. Emerging economies are expected to be key growth engines, fueled by their expanding energy needs and ongoing infrastructure development. The industry's ability to provide a stable and dispatchable power source, crucial for grid stability, continues to be a significant advantage.
Thermal Power Industry Market Size (In Million)
Despite the overall positive trajectory, the Thermal Power Industry faces certain restraints, primarily the increasing global focus on decarbonization and the growing adoption of renewable energy sources. Regulatory pressures and environmental concerns are driving a shift away from traditional, high-emission thermal power generation. However, natural gas is increasingly being positioned as a transitional fuel, offering lower emissions compared to coal and greater flexibility to complement intermittent renewables. Innovation in carbon capture, utilization, and storage (CCUS) technologies is also crucial for the long-term sustainability of thermal power. Key players in the market are investing in advanced technologies and exploring strategic partnerships to navigate these challenges and capitalize on growth opportunities, particularly in regions with strong existing thermal power infrastructure and evolving energy demands.
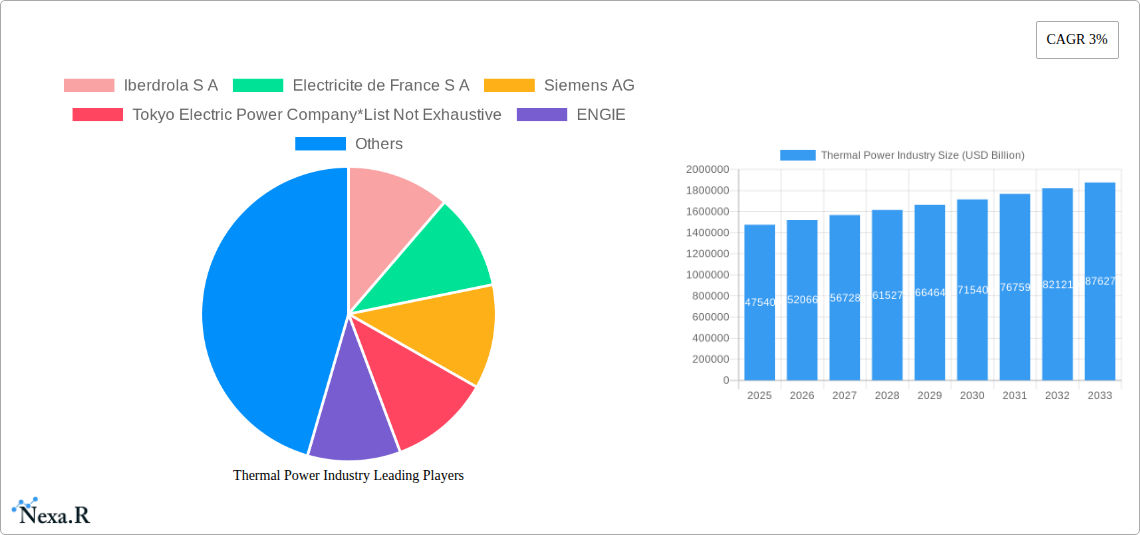
Thermal Power Industry Company Market Share
Thermal Power Industry Market Dynamics & Structure
The global thermal power industry, valued at approximately USD 5.5 Trillion in the base year of 2025, is characterized by a moderately concentrated market structure. Key players like Iberdrola S.A., Electricite de France S.A., Siemens AG, and National Thermal Power Corporation Limited exert significant influence. Technological innovation is a primary driver, pushing for advancements in efficiency and emissions reduction. Regulatory frameworks, particularly environmental regulations, are increasingly stringent, shaping investment decisions and operational strategies. Competitive product substitutes, primarily renewable energy sources, are gaining traction, forcing traditional thermal power operators to adapt. End-user demographics are shifting, with growing demand for reliable and affordable energy in emerging economies. Mergers and acquisitions (M&A) continue to be a significant trend, with a reported USD 15 Billion in M&A deal volume during the historical period of 2019-2024, aimed at consolidating market share and acquiring new technologies. Barriers to innovation include high capital expenditure for new technologies and the long asset life of existing power plants.
- Market Concentration: Moderate, with a few dominant global players.
- Technological Innovation Drivers: Demand for higher efficiency, lower emissions, and grid stability.
- Regulatory Frameworks: Increasingly stringent environmental standards and carbon pricing mechanisms.
- Competitive Product Substitutes: Solar, wind, and battery storage technologies.
- End-User Demographics: Growing industrial demand in developing nations, and evolving residential consumption patterns.
- M&A Trends: Consolidation for economies of scale and technology acquisition.
Thermal Power Industry Growth Trends & Insights
The global thermal power industry is projected to witness a Compound Annual Growth Rate (CAGR) of 2.8% from 2025 to 2033, with a projected market size of USD 6.9 Trillion by the end of the forecast period. This growth is propelled by sustained energy demand, particularly in developing regions, and the ongoing need for baseload power to complement intermittent renewable sources. While the adoption of renewable energy sources is accelerating, the essential role of thermal power in ensuring grid stability and meeting peak demand remains critical. Technological disruptions are primarily focused on improving the efficiency of existing plants and developing cleaner combustion technologies. For instance, advancements in supercritical and ultra-supercritical coal-fired power plants have significantly reduced fuel consumption and emissions. Similarly, the development of advanced gas turbine technologies and carbon capture, utilization, and storage (CCUS) solutions are key areas of innovation.
Consumer behavior shifts are also influencing the market. There is a growing awareness and demand for sustainable energy solutions, pushing utility companies to invest in cleaner thermal power generation or diversify their portfolios. This trend is creating opportunities for hybrid power plants that combine thermal generation with renewable energy sources. Furthermore, the integration of smart grid technologies is enhancing the operational efficiency and reliability of thermal power plants, enabling better demand-side management and reducing waste. The market penetration of advanced emission control technologies, such as selective catalytic reduction (SCR) and flue gas desulfurization (FGD), is steadily increasing due to regulatory pressures.
The parent market, encompassing all forms of energy generation, is experiencing a significant transformation with the rise of renewables. However, the thermal power industry, as a child market, is adapting through technological upgrades and by playing a crucial role in supporting the energy transition. The market size evolution is a complex interplay between declining reliance on traditional fossil fuels in some developed economies and robust growth in emerging markets driven by industrialization and population growth. This dynamic is reflected in the projected market size and CAGR, indicating a mature but adaptable industry.
- Market Size Evolution: From USD 5.5 Trillion (2025) to USD 6.9 Trillion (2033).
- CAGR (2025-2033): 2.8%.
- Adoption Rates: Increasing for cleaner thermal technologies and hybrid solutions, while facing competition from renewables.
- Technological Disruptions: Focus on efficiency improvements, CCUS, and advanced emission controls.
- Consumer Behavior Shifts: Demand for sustainability and grid reliability influencing investment.
- Market Penetration: Growing for emission control technologies and smart grid integration.
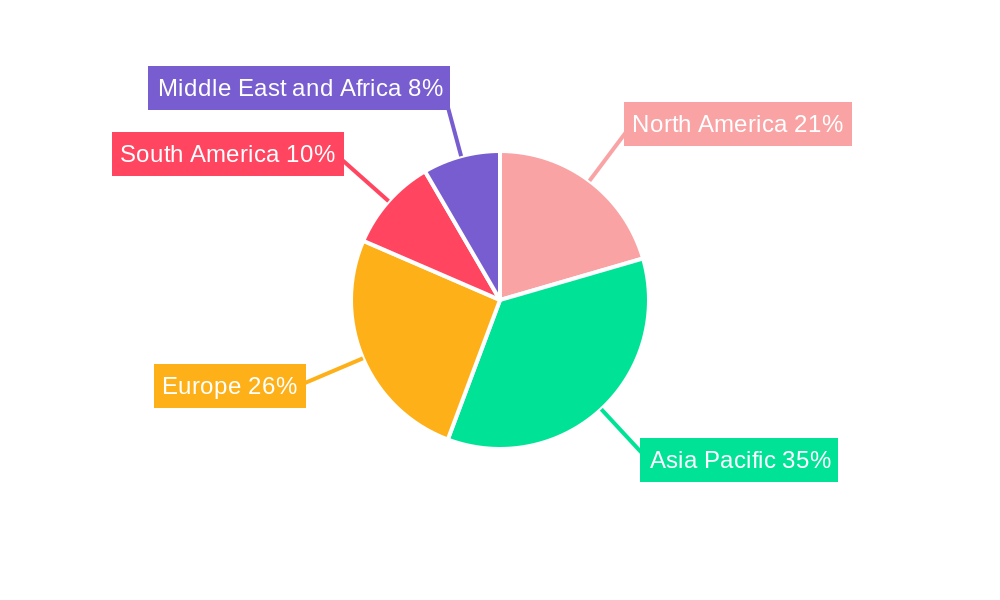
Dominant Regions, Countries, or Segments in Thermal Power Industry
The Gas fuel type segment, valued at an estimated USD 2.2 Trillion in 2025, is emerging as a dominant force within the thermal power industry, driven by its cleaner emissions profile compared to coal and its flexibility in complementing intermittent renewable energy sources. Key regions like Asia-Pacific, particularly China and India, are spearheading this growth, contributing an estimated 35% to the global market share. Economic policies in these nations, focused on industrial expansion and meeting escalating energy demands, are prioritizing natural gas as a transition fuel.
Infrastructure development plays a pivotal role, with significant investments in gas pipelines and liquefied natural gas (LNG) import terminals facilitating access to this resource. Furthermore, the inherent operational flexibility of gas-fired power plants, allowing for rapid start-up and shut-down, makes them indispensable for grid balancing as renewable energy penetration increases. The market share of gas in the thermal power mix is projected to grow from 40% in 2025 to an estimated 45% by 2033.
While coal remains a significant fuel source, particularly in certain developing economies, its dominance is gradually eroding due to increasing environmental regulations and the declining cost of natural gas. Nuclear power, though a carbon-free source, faces challenges related to high upfront costs, public perception, and waste disposal, limiting its widespread adoption in many regions. The "Others" segment, encompassing technologies like biomass and waste-to-energy, is witnessing steady growth but currently represents a smaller portion of the overall market.
- Dominant Fuel Type: Gas, with an estimated market share of 40% in 2025.
- Dominant Region: Asia-Pacific, accounting for approximately 35% of the global market.
- Key Drivers: Economic policies, industrialization, population growth, grid stability requirements.
- Infrastructure: Robust development of gas pipelines and LNG terminals.
- Growth Potential: Gas segment expected to grow at a CAGR of 3.5% from 2025-2033.
- Market Share by Fuel Type (2025 Estimate): Coal (30%), Gas (40%), Nuclear (20%), Others (10%).
Thermal Power Industry Product Landscape
The thermal power industry's product landscape is evolving towards higher efficiency and reduced environmental impact. Innovations in gas turbine technology, such as advanced materials and aerodynamic designs, are yielding significant improvements in power output and fuel efficiency, with modern turbines achieving thermal efficiencies exceeding 60%. Advanced coal combustion technologies, including ultra-supercritical plants, are capable of operating at higher pressures and temperatures, leading to substantial reductions in CO2 and other pollutant emissions by up to 20% compared to subcritical plants. Carbon capture, utilization, and storage (CCUS) technologies are a key area of product development, offering a pathway to decarbonize existing thermal power assets. These systems are designed for modularity and scalability, with pilot projects demonstrating capture rates of over 90% of CO2 from flue gas. Performance metrics are increasingly focused on operational flexibility, lower emissions per unit of energy produced, and cost-effectiveness in integration with renewable energy systems.
Key Drivers, Barriers & Challenges in Thermal Power Industry
Key Drivers
The primary forces propelling the thermal power industry include the sustained global demand for electricity, driven by industrial growth and population expansion, particularly in emerging economies. The need for reliable baseload power to ensure grid stability and complement intermittent renewable energy sources is a critical driver. Furthermore, technological advancements in efficiency and emission control are making thermal power generation more sustainable and competitive. Government initiatives and energy security concerns also play a significant role in maintaining investment in thermal power infrastructure.
Barriers & Challenges
Significant challenges include the increasing global emphasis on decarbonization and the implementation of stricter environmental regulations, leading to higher operational costs and potential asset stranding. The substantial upfront capital investment required for new thermal power plants and the long payback periods pose financial hurdles. Supply chain disruptions for critical components and fuels, particularly natural gas, can impact operational continuity and price stability. Intense competition from rapidly declining renewable energy costs and advancements in energy storage technologies presents a formidable challenge to the long-term viability of certain thermal power segments.
Emerging Opportunities in Thermal Power Industry
Emerging opportunities lie in the development and deployment of advanced thermal power technologies, such as hydrogen-ready gas turbines and CCUS integrated systems. The growing demand for flexible power generation to support the integration of renewables presents a significant market for modern, efficient gas-fired plants. Furthermore, the potential for repurposing existing coal-fired power plants with CCUS technology offers a pathway to decarbonization without complete asset abandonment. Untapped markets in regions with rapidly growing energy demands also present substantial growth potential for thermal power solutions, provided they can meet evolving environmental standards. The increasing focus on industrial decarbonization is also creating opportunities for thermal power providers to offer integrated energy solutions, including waste heat recovery and combined heat and power (CHP) systems.
Growth Accelerators in the Thermal Power Industry Industry
The thermal power industry is being accelerated by continuous technological breakthroughs that enhance efficiency and reduce emissions, such as the development of advanced materials for gas turbines and more effective CCUS systems. Strategic partnerships between technology providers and utility companies are crucial for the development and deployment of next-generation thermal power plants. Market expansion strategies targeting regions with high unmet energy demand, coupled with the increasing affordability of natural gas as a transition fuel, are significant growth catalysts. The global push towards energy security and the desire for reliable electricity supply, even as renewables grow, also acts as a substantial accelerator for the thermal power sector.
Key Players Shaping the Thermal Power Industry Market
- Iberdrola S.A.
- Electricite de France S.A.
- Siemens AG
- Tokyo Electric Power Company
- ENGIE
- National Thermal Power Corporation Limited
- General Electric Company
- Chubu Electric Power Co Inc
- ABB
- Bharat Heavy Electricals Limited (BHEL)
Notable Milestones in Thermal Power Industry Sector
- 2019: Increased global investment in advanced gas turbine technologies, aiming for higher efficiency and lower emissions.
- 2020: Significant progress in the development of commercial-scale carbon capture, utilization, and storage (CCUS) pilot projects globally.
- 2021: The adoption of renewable energy sources continues to accelerate, leading to increased discussions and planning for hybrid power plant solutions integrating thermal and renewable generation.
- 2022: Implementation of stricter environmental regulations in major economies, pushing utilities to invest in emission control technologies for existing thermal power plants.
- 2023: Several major energy companies announce plans for hydrogen co-firing in existing gas-fired power plants, signaling a shift towards cleaner fuel options.
- 2024: The development of new, more efficient thermal power technologies, including advanced materials for turbines and improved heat recovery systems, gains momentum with renewed R&D focus.
In-Depth Thermal Power Industry Market Outlook
The future of the thermal power industry is one of adaptation and integration. Growth accelerators such as technological advancements in cleaner combustion and carbon capture, coupled with the strategic positioning of natural gas as a vital transition fuel, will shape market expansion. The industry's ability to provide reliable baseload power to complement the intermittency of renewable energy sources will ensure its continued relevance. Strategic partnerships and investments in R&D will be critical for developing and deploying these advanced solutions. Emerging opportunities in untapped markets and the evolving demands for integrated energy systems present a dynamic outlook for the thermal power sector, poised to play a significant role in the global energy transition for years to come.
Thermal Power Industry Segmentation
-
1. Fuel Type
- 1.1. Coal
- 1.2. Gas
- 1.3. Nuclear
- 1.4. Others
Thermal Power Industry Segmentation By Geography
- 1. North America
- 2. Asia Pacific
- 3. Europe
- 4. South America
- 5. Middle East and Africa
Thermal Power Industry Regional Market Share
Geographic Coverage of Thermal Power Industry
Thermal Power Industry REPORT HIGHLIGHTS
| Aspects | Details |
|---|---|
| Study Period | 2020-2034 |
| Base Year | 2025 |
| Estimated Year | 2026 |
| Forecast Period | 2026-2034 |
| Historical Period | 2020-2025 |
| Growth Rate | CAGR of 3% from 2020-2034 |
| Segmentation |
|
Table of Contents
- 1. Introduction
- 1.1. Research Scope
- 1.2. Market Segmentation
- 1.3. Research Objective
- 1.4. Definitions and Assumptions
- 2. Executive Summary
- 2.1. Market Snapshot
- 3. Market Dynamics
- 3.1. Market Drivers
- 3.2. Market Restrains
- 3.3. Market Trends
- 3.4. Market Opportunities
- 4. Market Factor Analysis
- 4.1. Porters Five Forces
- 4.1.1. Bargaining Power of Suppliers
- 4.1.2. Bargaining Power of Buyers
- 4.1.3. Threat of New Entrants
- 4.1.4. Threat of Substitutes
- 4.1.5. Competitive Rivalry
- 4.2. PESTEL analysis
- 4.3. BCG Analysis
- 4.3.1. Stars (High Growth, High Market Share)
- 4.3.2. Cash Cows (Low Growth, High Market Share)
- 4.3.3. Question Mark (High Growth, Low Market Share)
- 4.3.4. Dogs (Low Growth, Low Market Share)
- 4.4. Ansoff Matrix Analysis
- 4.5. Supply Chain Analysis
- 4.6. Regulatory Landscape
- 4.7. Current Market Potential and Opportunity Assessment (TAM–SAM–SOM Framework)
- 4.8. NRP Analyst Note
- 4.1. Porters Five Forces
- 5. Market Analysis, Insights and Forecast 2021-2033
- 5.1. Market Analysis, Insights and Forecast - by Fuel Type
- 5.1.1. Coal
- 5.1.2. Gas
- 5.1.3. Nuclear
- 5.1.4. Others
- 5.2. Market Analysis, Insights and Forecast - by Region
- 5.2.1. North America
- 5.2.2. Asia Pacific
- 5.2.3. Europe
- 5.2.4. South America
- 5.2.5. Middle East and Africa
- 5.1. Market Analysis, Insights and Forecast - by Fuel Type
- 6. Global Thermal Power Industry Analysis, Insights and Forecast, 2021-2033
- 6.1. Market Analysis, Insights and Forecast - by Fuel Type
- 6.1.1. Coal
- 6.1.2. Gas
- 6.1.3. Nuclear
- 6.1.4. Others
- 6.1. Market Analysis, Insights and Forecast - by Fuel Type
- 7. North America Thermal Power Industry Analysis, Insights and Forecast, 2020-2032
- 7.1. Market Analysis, Insights and Forecast - by Fuel Type
- 7.1.1. Coal
- 7.1.2. Gas
- 7.1.3. Nuclear
- 7.1.4. Others
- 7.1. Market Analysis, Insights and Forecast - by Fuel Type
- 8. Asia Pacific Thermal Power Industry Analysis, Insights and Forecast, 2020-2032
- 8.1. Market Analysis, Insights and Forecast - by Fuel Type
- 8.1.1. Coal
- 8.1.2. Gas
- 8.1.3. Nuclear
- 8.1.4. Others
- 8.1. Market Analysis, Insights and Forecast - by Fuel Type
- 9. Europe Thermal Power Industry Analysis, Insights and Forecast, 2020-2032
- 9.1. Market Analysis, Insights and Forecast - by Fuel Type
- 9.1.1. Coal
- 9.1.2. Gas
- 9.1.3. Nuclear
- 9.1.4. Others
- 9.1. Market Analysis, Insights and Forecast - by Fuel Type
- 10. South America Thermal Power Industry Analysis, Insights and Forecast, 2020-2032
- 10.1. Market Analysis, Insights and Forecast - by Fuel Type
- 10.1.1. Coal
- 10.1.2. Gas
- 10.1.3. Nuclear
- 10.1.4. Others
- 10.1. Market Analysis, Insights and Forecast - by Fuel Type
- 11. Middle East and Africa Thermal Power Industry Analysis, Insights and Forecast, 2020-2032
- 11.1. Market Analysis, Insights and Forecast - by Fuel Type
- 11.1.1. Coal
- 11.1.2. Gas
- 11.1.3. Nuclear
- 11.1.4. Others
- 11.1. Market Analysis, Insights and Forecast - by Fuel Type
- 12. Competitive Analysis
- 12.1. Company Profiles
- 12.1.1 Iberdrola S A
- 12.1.1.1. Company Overview
- 12.1.1.2. Products
- 12.1.1.3. Company Financials
- 12.1.1.4. SWOT Analysis
- 12.1.2 Electricite de France S A
- 12.1.2.1. Company Overview
- 12.1.2.2. Products
- 12.1.2.3. Company Financials
- 12.1.2.4. SWOT Analysis
- 12.1.3 Siemens AG
- 12.1.3.1. Company Overview
- 12.1.3.2. Products
- 12.1.3.3. Company Financials
- 12.1.3.4. SWOT Analysis
- 12.1.4 Tokyo Electric Power Company*List Not Exhaustive
- 12.1.4.1. Company Overview
- 12.1.4.2. Products
- 12.1.4.3. Company Financials
- 12.1.4.4. SWOT Analysis
- 12.1.5 ENGIE
- 12.1.5.1. Company Overview
- 12.1.5.2. Products
- 12.1.5.3. Company Financials
- 12.1.5.4. SWOT Analysis
- 12.1.6 National Thermal Power Corporation Limited
- 12.1.6.1. Company Overview
- 12.1.6.2. Products
- 12.1.6.3. Company Financials
- 12.1.6.4. SWOT Analysis
- 12.1.7 General Electric Company
- 12.1.7.1. Company Overview
- 12.1.7.2. Products
- 12.1.7.3. Company Financials
- 12.1.7.4. SWOT Analysis
- 12.1.8 Chubu Electric Power Co Inc
- 12.1.8.1. Company Overview
- 12.1.8.2. Products
- 12.1.8.3. Company Financials
- 12.1.8.4. SWOT Analysis
- 12.1.9 ABB
- 12.1.9.1. Company Overview
- 12.1.9.2. Products
- 12.1.9.3. Company Financials
- 12.1.9.4. SWOT Analysis
- 12.1.10 Bharat Heavy Electricals Limited (BHEL)
- 12.1.10.1. Company Overview
- 12.1.10.2. Products
- 12.1.10.3. Company Financials
- 12.1.10.4. SWOT Analysis
- 12.1.1 Iberdrola S A
- 12.2. Market Entropy
- 12.2.1 Company's Key Areas Served
- 12.2.2 Recent Developments
- 12.3. Company Market Share Analysis 2025
- 12.3.1 Top 5 Companies Market Share Analysis
- 12.3.2 Top 3 Companies Market Share Analysis
- 12.4. List of Potential Customers
- 13. Research Methodology
List of Figures
- Figure 1: Global Thermal Power Industry Revenue Breakdown (USD Billion, %) by Region 2025 & 2033
- Figure 2: Global Thermal Power Industry Volume Breakdown (Megawatt, %) by Region 2025 & 2033
- Figure 3: North America Thermal Power Industry Revenue (USD Billion), by Fuel Type 2025 & 2033
- Figure 4: North America Thermal Power Industry Volume (Megawatt), by Fuel Type 2025 & 2033
- Figure 5: North America Thermal Power Industry Revenue Share (%), by Fuel Type 2025 & 2033
- Figure 6: North America Thermal Power Industry Volume Share (%), by Fuel Type 2025 & 2033
- Figure 7: North America Thermal Power Industry Revenue (USD Billion), by Country 2025 & 2033
- Figure 8: North America Thermal Power Industry Volume (Megawatt), by Country 2025 & 2033
- Figure 9: North America Thermal Power Industry Revenue Share (%), by Country 2025 & 2033
- Figure 10: North America Thermal Power Industry Volume Share (%), by Country 2025 & 2033
- Figure 11: Asia Pacific Thermal Power Industry Revenue (USD Billion), by Fuel Type 2025 & 2033
- Figure 12: Asia Pacific Thermal Power Industry Volume (Megawatt), by Fuel Type 2025 & 2033
- Figure 13: Asia Pacific Thermal Power Industry Revenue Share (%), by Fuel Type 2025 & 2033
- Figure 14: Asia Pacific Thermal Power Industry Volume Share (%), by Fuel Type 2025 & 2033
- Figure 15: Asia Pacific Thermal Power Industry Revenue (USD Billion), by Country 2025 & 2033
- Figure 16: Asia Pacific Thermal Power Industry Volume (Megawatt), by Country 2025 & 2033
- Figure 17: Asia Pacific Thermal Power Industry Revenue Share (%), by Country 2025 & 2033
- Figure 18: Asia Pacific Thermal Power Industry Volume Share (%), by Country 2025 & 2033
- Figure 19: Europe Thermal Power Industry Revenue (USD Billion), by Fuel Type 2025 & 2033
- Figure 20: Europe Thermal Power Industry Volume (Megawatt), by Fuel Type 2025 & 2033
- Figure 21: Europe Thermal Power Industry Revenue Share (%), by Fuel Type 2025 & 2033
- Figure 22: Europe Thermal Power Industry Volume Share (%), by Fuel Type 2025 & 2033
- Figure 23: Europe Thermal Power Industry Revenue (USD Billion), by Country 2025 & 2033
- Figure 24: Europe Thermal Power Industry Volume (Megawatt), by Country 2025 & 2033
- Figure 25: Europe Thermal Power Industry Revenue Share (%), by Country 2025 & 2033
- Figure 26: Europe Thermal Power Industry Volume Share (%), by Country 2025 & 2033
- Figure 27: South America Thermal Power Industry Revenue (USD Billion), by Fuel Type 2025 & 2033
- Figure 28: South America Thermal Power Industry Volume (Megawatt), by Fuel Type 2025 & 2033
- Figure 29: South America Thermal Power Industry Revenue Share (%), by Fuel Type 2025 & 2033
- Figure 30: South America Thermal Power Industry Volume Share (%), by Fuel Type 2025 & 2033
- Figure 31: South America Thermal Power Industry Revenue (USD Billion), by Country 2025 & 2033
- Figure 32: South America Thermal Power Industry Volume (Megawatt), by Country 2025 & 2033
- Figure 33: South America Thermal Power Industry Revenue Share (%), by Country 2025 & 2033
- Figure 34: South America Thermal Power Industry Volume Share (%), by Country 2025 & 2033
- Figure 35: Middle East and Africa Thermal Power Industry Revenue (USD Billion), by Fuel Type 2025 & 2033
- Figure 36: Middle East and Africa Thermal Power Industry Volume (Megawatt), by Fuel Type 2025 & 2033
- Figure 37: Middle East and Africa Thermal Power Industry Revenue Share (%), by Fuel Type 2025 & 2033
- Figure 38: Middle East and Africa Thermal Power Industry Volume Share (%), by Fuel Type 2025 & 2033
- Figure 39: Middle East and Africa Thermal Power Industry Revenue (USD Billion), by Country 2025 & 2033
- Figure 40: Middle East and Africa Thermal Power Industry Volume (Megawatt), by Country 2025 & 2033
- Figure 41: Middle East and Africa Thermal Power Industry Revenue Share (%), by Country 2025 & 2033
- Figure 42: Middle East and Africa Thermal Power Industry Volume Share (%), by Country 2025 & 2033
List of Tables
- Table 1: Global Thermal Power Industry Revenue USD Billion Forecast, by Fuel Type 2020 & 2033
- Table 2: Global Thermal Power Industry Volume Megawatt Forecast, by Fuel Type 2020 & 2033
- Table 3: Global Thermal Power Industry Revenue USD Billion Forecast, by Region 2020 & 2033
- Table 4: Global Thermal Power Industry Volume Megawatt Forecast, by Region 2020 & 2033
- Table 5: Global Thermal Power Industry Revenue USD Billion Forecast, by Fuel Type 2020 & 2033
- Table 6: Global Thermal Power Industry Volume Megawatt Forecast, by Fuel Type 2020 & 2033
- Table 7: Global Thermal Power Industry Revenue USD Billion Forecast, by Country 2020 & 2033
- Table 8: Global Thermal Power Industry Volume Megawatt Forecast, by Country 2020 & 2033
- Table 9: Global Thermal Power Industry Revenue USD Billion Forecast, by Fuel Type 2020 & 2033
- Table 10: Global Thermal Power Industry Volume Megawatt Forecast, by Fuel Type 2020 & 2033
- Table 11: Global Thermal Power Industry Revenue USD Billion Forecast, by Country 2020 & 2033
- Table 12: Global Thermal Power Industry Volume Megawatt Forecast, by Country 2020 & 2033
- Table 13: Global Thermal Power Industry Revenue USD Billion Forecast, by Fuel Type 2020 & 2033
- Table 14: Global Thermal Power Industry Volume Megawatt Forecast, by Fuel Type 2020 & 2033
- Table 15: Global Thermal Power Industry Revenue USD Billion Forecast, by Country 2020 & 2033
- Table 16: Global Thermal Power Industry Volume Megawatt Forecast, by Country 2020 & 2033
- Table 17: Global Thermal Power Industry Revenue USD Billion Forecast, by Fuel Type 2020 & 2033
- Table 18: Global Thermal Power Industry Volume Megawatt Forecast, by Fuel Type 2020 & 2033
- Table 19: Global Thermal Power Industry Revenue USD Billion Forecast, by Country 2020 & 2033
- Table 20: Global Thermal Power Industry Volume Megawatt Forecast, by Country 2020 & 2033
- Table 21: Global Thermal Power Industry Revenue USD Billion Forecast, by Fuel Type 2020 & 2033
- Table 22: Global Thermal Power Industry Volume Megawatt Forecast, by Fuel Type 2020 & 2033
- Table 23: Global Thermal Power Industry Revenue USD Billion Forecast, by Country 2020 & 2033
- Table 24: Global Thermal Power Industry Volume Megawatt Forecast, by Country 2020 & 2033
Frequently Asked Questions
1. What is the projected Compound Annual Growth Rate (CAGR) of the Thermal Power Industry?
The projected CAGR is approximately 3%.
2. Which companies are prominent players in the Thermal Power Industry?
Key companies in the market include Iberdrola S A, Electricite de France S A, Siemens AG, Tokyo Electric Power Company*List Not Exhaustive, ENGIE, National Thermal Power Corporation Limited, General Electric Company, Chubu Electric Power Co Inc, ABB , Bharat Heavy Electricals Limited (BHEL).
3. What are the main segments of the Thermal Power Industry?
The market segments include Fuel Type.
4. Can you provide details about the market size?
The market size is estimated to be USD 1,475.40 USD Billion as of 2022.
5. What are some drivers contributing to market growth?
4.; Increasing investment in the Midstream Sector4.; Increasing Production of Oil and Natural Gas.
6. What are the notable trends driving market growth?
Natural Gas Power Plants to Witness Significant Growth.
7. Are there any restraints impacting market growth?
4.; Inadequate Infrastructure in the Country.
8. Can you provide examples of recent developments in the market?
The development of new, more efficient thermal power technologies
9. What pricing options are available for accessing the report?
Pricing options include single-user, multi-user, and enterprise licenses priced at USD 4750, USD 5250, and USD 8750 respectively.
10. Is the market size provided in terms of value or volume?
The market size is provided in terms of value, measured in USD Billion and volume, measured in Megawatt.
11. Are there any specific market keywords associated with the report?
Yes, the market keyword associated with the report is "Thermal Power Industry," which aids in identifying and referencing the specific market segment covered.
12. How do I determine which pricing option suits my needs best?
The pricing options vary based on user requirements and access needs. Individual users may opt for single-user licenses, while businesses requiring broader access may choose multi-user or enterprise licenses for cost-effective access to the report.
13. Are there any additional resources or data provided in the Thermal Power Industry report?
While the report offers comprehensive insights, it's advisable to review the specific contents or supplementary materials provided to ascertain if additional resources or data are available.
14. How can I stay updated on further developments or reports in the Thermal Power Industry?
To stay informed about further developments, trends, and reports in the Thermal Power Industry, consider subscribing to industry newsletters, following relevant companies and organizations, or regularly checking reputable industry news sources and publications.
Methodology
Step 1 - Identification of Relevant Samples Size from Population Database


Step 2 - Approaches for Defining Global Market Size (Value, Volume* & Price*)

Note*: In applicable scenarios
Step 3 - Data Sources
Primary Research
- Web Analytics
- Survey Reports
- Research Institute
- Latest Research Reports
- Opinion Leaders
Secondary Research
- Annual Reports
- White Paper
- Latest Press Release
- Industry Association
- Paid Database
- Investor Presentations

Step 4 - Data Triangulation
Involves using different sources of information in order to increase the validity of a study
These sources are likely to be stakeholders in a program - participants, other researchers, program staff, other community members, and so on.
Then we put all data in single framework & apply various statistical tools to find out the dynamic on the market.
During the analysis stage, feedback from the stakeholder groups would be compared to determine areas of agreement as well as areas of divergence