

Key Insights
The global armored transportation services market is projected for significant expansion, driven by escalating demand for secure asset logistics, particularly in developing regions with burgeoning financial industries and e-commerce sectors. The market is valued at $4.3 billion in the base year 2025, with an anticipated Compound Annual Growth Rate (CAGR) of 0.6% over the forecast period (2025-2033). Key growth drivers include heightened security concerns, the proliferation of e-commerce necessitating secure transit for high-value goods, and the adoption of advanced technologies such as GPS tracking and real-time monitoring systems. Furthermore, stringent regulatory compliance mandates reinforce the need for secure transportation solutions to effectively manage risks.
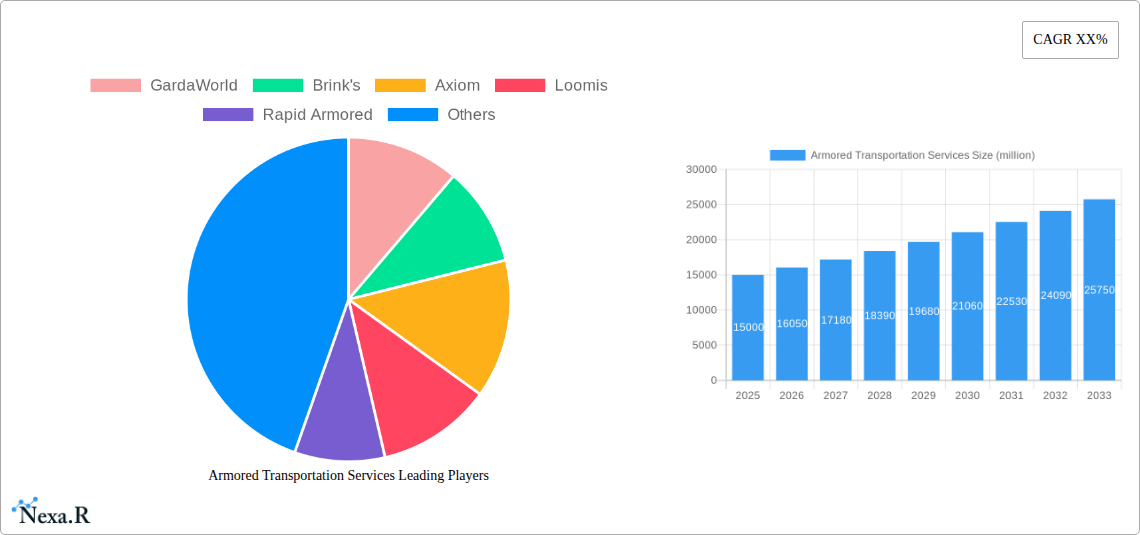
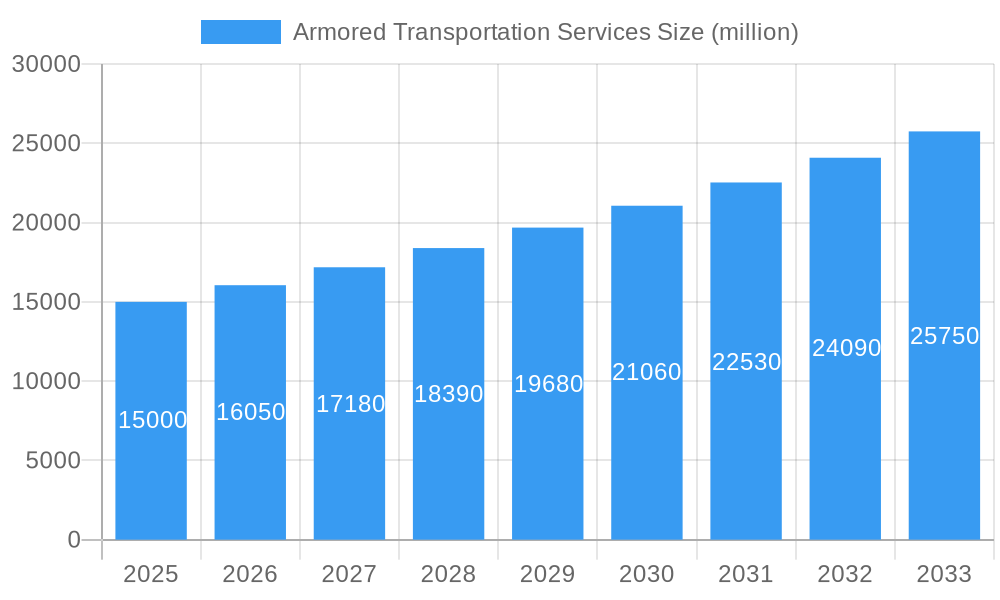
Armored Transportation Services Market Size (In Billion)
Conversely, market expansion faces headwinds from substantial operational expenditures, encompassing insurance, vehicle upkeep, and specialized personnel training. Intense market competition from established operators and new entrants also exerts pressure on profitability. The market is categorized by service type (e.g., cash-in-transit, high-value goods transport), vehicle classification, and geographical distribution. While North America and Europe currently dominate market share, robust economic development in the Asia-Pacific region presents considerable growth prospects. Leading industry participants, including GardaWorld, Brink's, and Loomis, are strategically investing in technological innovation and corporate acquisitions to solidify their market standing and address evolving client requirements. This competitive environment underscores the critical importance of strategic foresight and continuous innovation for sustained success in this evolving market.
Armored Transportation Services Company Market Share
Armored Transportation Services Market Report: 2019-2033
This comprehensive report provides an in-depth analysis of the global armored transportation services market, encompassing historical data (2019-2024), current estimates (2025), and future forecasts (2025-2033). The report examines market dynamics, growth trends, regional variations, competitive landscapes, and emerging opportunities within this crucial sector. This analysis will be invaluable to industry professionals, investors, and strategists seeking a clear understanding of the armored transportation services market. The market is segmented by key players and geographic regions, enabling targeted insights for informed decision-making. The parent market is security services and the child market is specialized transportation.
Armored Transportation Services Market Dynamics & Structure
The global armored transportation services market, valued at $XX billion in 2025, exhibits a moderately concentrated structure. Key players, including GardaWorld, Brink's, and Loomis, hold significant market share, but a fragmented landscape of regional and specialized providers also exists. Technological innovation, driven by advancements in GPS tracking, security systems, and data analytics, is reshaping the industry. Stringent regulatory frameworks governing security protocols, data privacy, and liability significantly influence market operations. Competitive pressures stem from alternative solutions such as secure digital transactions and internal risk mitigation strategies employed by financial institutions. End-user demographics, primarily financial institutions, government agencies, and high-value commodity transporters, play a significant role in market demand. The historical period (2019-2024) witnessed a moderate number of M&A activities, with approximately XX deals annually, primarily driven by consolidation efforts and expansion strategies.
- Market Concentration: Moderately concentrated, with top 5 players holding approximately XX% of market share in 2025.
- Technological Innovation: GPS tracking, advanced security systems, and data analytics are key drivers.
- Regulatory Landscape: Stringent regulations on security, data privacy, and liability significantly impact operations.
- Competitive Substitutes: Increasing reliance on digital transactions and in-house security measures pose competitive threats.
- End-User Demographics: Financial institutions, government agencies, and high-value commodity transporters are key end-users.
- M&A Activity: Average of XX M&A deals annually during 2019-2024.
Armored Transportation Services Growth Trends & Insights
The armored transportation services market demonstrates consistent growth, driven by the increasing need for secure transportation of valuables across various sectors. The historical period (2019-2024) showed a CAGR of XX%, reaching an estimated $XX billion in 2025. This growth trajectory is projected to continue during the forecast period (2025-2033) with a projected CAGR of XX%, reaching $XX billion by 2033. Technological disruptions, such as the integration of IoT and AI, enhance security measures, thus boosting adoption rates. Shifting consumer behavior towards heightened security awareness across financial and commercial sectors furthers the market expansion. The market penetration rate is estimated at XX% in 2025, with potential for growth in emerging markets.
Dominant Regions, Countries, or Segments in Armored Transportation Services
North America currently dominates the armored transportation services market, holding approximately XX% of the global market share in 2025. This dominance is attributed to the robust financial sector, stringent security regulations, and higher disposable incomes. However, Asia-Pacific is poised for substantial growth driven by rapid economic expansion, rising urbanization, and increasing investment in infrastructure development.
- North America: Strong financial sector, stringent regulations, high disposable income.
- Europe: Well-established market, moderate growth potential due to mature financial systems.
- Asia-Pacific: Rapid economic growth, rising urbanization, and increasing infrastructure investment drive growth.
- Rest of the World: Emerging markets with varying growth potential.
Armored Transportation Services Product Landscape
The armored transportation services market offers a range of solutions, from basic cash-in-transit services to specialized transportation of high-value goods like jewelry, pharmaceuticals, and artwork. Product innovation focuses on enhancing security features through advanced GPS tracking, biometric access control, and real-time monitoring systems. These features provide clients with increased visibility and control over their shipments, reducing risk and improving efficiency. Key selling propositions include reliability, security, and compliance with industry-specific regulations.
Key Drivers, Barriers & Challenges in Armored Transportation Services
Key Drivers: Increasing demand for secure transportation of high-value goods, stringent government regulations, rising e-commerce and digital transactions leading to increased cash handling requirements.
Key Challenges: High operational costs, intense competition, stringent security requirements, supply chain disruptions due to unforeseen circumstances, cybersecurity threats, and regulatory changes. For example, a 10% increase in fuel prices could impact operational costs by approximately $XX billion annually.
Emerging Opportunities in Armored Transportation Services
Emerging opportunities lie in specialized transportation solutions for high-value goods, expansion into emerging markets, and integration of advanced technologies such as AI and blockchain for enhanced security and traceability. The focus on sustainable practices within logistics is also creating opportunities for environmentally conscious transportation solutions.
Growth Accelerators in the Armored Transportation Services Industry
Strategic partnerships between armored transportation companies and technology providers are key growth accelerators. Technological advancements, particularly in the field of security and tracking systems, are enhancing operational efficiency and client confidence. Market expansion into underserved regions is also creating lucrative opportunities for growth.
Key Players Shaping the Armored Transportation Services Market
- GardaWorld
- Brink's
- Axiom
- Loomis
- Rapid Armored
- Fortress Armored Services Company
- Eastern Armored Services
- Total Armored Car Service
- Anbang Save-Guard Group
- GRG Banking
- Weibao Finance Yayun
- China Security & Protection Group
- CITIC Outsourcing Service Group
- Kunshan Ping An Special Guard Security Service
Notable Milestones in Armored Transportation Services Sector
- 2020: Introduction of AI-powered security systems by Loomis.
- 2022: Merger between two regional armored transportation companies in Europe.
- 2023: Launch of a new sustainable armored vehicle by GardaWorld.
- 2024: Implementation of advanced GPS tracking technology across Brink’s fleet.
In-Depth Armored Transportation Services Market Outlook
The armored transportation services market is poised for continued growth, driven by technological advancements, expanding e-commerce activities, and increasing demand for secure transportation across various sectors. Strategic partnerships, operational efficiency improvements, and expansion into new markets will further fuel this growth. The market presents significant opportunities for companies that can effectively leverage technology, optimize operations, and meet the evolving needs of their clientele.
Armored Transportation Services Segmentation
-
1. Application
- 1.1. Banking
- 1.2. Government
- 1.3. Personal
- 1.4. Others
-
2. Types
- 2.1. Cash Transportation
- 2.2. Valuables Transportation
- 2.3. Others
Armored Transportation Services Segmentation By Geography
-
1. North America
- 1.1. United States
- 1.2. Canada
- 1.3. Mexico
-
2. South America
- 2.1. Brazil
- 2.2. Argentina
- 2.3. Rest of South America
-
3. Europe
- 3.1. United Kingdom
- 3.2. Germany
- 3.3. France
- 3.4. Italy
- 3.5. Spain
- 3.6. Russia
- 3.7. Benelux
- 3.8. Nordics
- 3.9. Rest of Europe
-
4. Middle East & Africa
- 4.1. Turkey
- 4.2. Israel
- 4.3. GCC
- 4.4. North Africa
- 4.5. South Africa
- 4.6. Rest of Middle East & Africa
-
5. Asia Pacific
- 5.1. China
- 5.2. India
- 5.3. Japan
- 5.4. South Korea
- 5.5. ASEAN
- 5.6. Oceania
- 5.7. Rest of Asia Pacific

Armored Transportation Services Regional Market Share
Geographic Coverage of Armored Transportation Services
Armored Transportation Services REPORT HIGHLIGHTS
| Aspects | Details |
|---|---|
| Study Period | 2020-2034 |
| Base Year | 2025 |
| Estimated Year | 2026 |
| Forecast Period | 2026-2034 |
| Historical Period | 2020-2025 |
| Growth Rate | CAGR of 0.6% from 2020-2034 |
| Segmentation |
|
Table of Contents
- 1. Introduction
- 1.1. Research Scope
- 1.2. Market Segmentation
- 1.3. Research Methodology
- 1.4. Definitions and Assumptions
- 2. Executive Summary
- 2.1. Introduction
- 3. Market Dynamics
- 3.1. Introduction
- 3.2. Market Drivers
- 3.3. Market Restrains
- 3.4. Market Trends
- 4. Market Factor Analysis
- 4.1. Porters Five Forces
- 4.2. Supply/Value Chain
- 4.3. PESTEL analysis
- 4.4. Market Entropy
- 4.5. Patent/Trademark Analysis
- 5. Global Armored Transportation Services Analysis, Insights and Forecast, 2020-2032
- 5.1. Market Analysis, Insights and Forecast - by Application
- 5.1.1. Banking
- 5.1.2. Government
- 5.1.3. Personal
- 5.1.4. Others
- 5.2. Market Analysis, Insights and Forecast - by Types
- 5.2.1. Cash Transportation
- 5.2.2. Valuables Transportation
- 5.2.3. Others
- 5.3. Market Analysis, Insights and Forecast - by Region
- 5.3.1. North America
- 5.3.2. South America
- 5.3.3. Europe
- 5.3.4. Middle East & Africa
- 5.3.5. Asia Pacific
- 5.1. Market Analysis, Insights and Forecast - by Application
- 6. North America Armored Transportation Services Analysis, Insights and Forecast, 2020-2032
- 6.1. Market Analysis, Insights and Forecast - by Application
- 6.1.1. Banking
- 6.1.2. Government
- 6.1.3. Personal
- 6.1.4. Others
- 6.2. Market Analysis, Insights and Forecast - by Types
- 6.2.1. Cash Transportation
- 6.2.2. Valuables Transportation
- 6.2.3. Others
- 6.1. Market Analysis, Insights and Forecast - by Application
- 7. South America Armored Transportation Services Analysis, Insights and Forecast, 2020-2032
- 7.1. Market Analysis, Insights and Forecast - by Application
- 7.1.1. Banking
- 7.1.2. Government
- 7.1.3. Personal
- 7.1.4. Others
- 7.2. Market Analysis, Insights and Forecast - by Types
- 7.2.1. Cash Transportation
- 7.2.2. Valuables Transportation
- 7.2.3. Others
- 7.1. Market Analysis, Insights and Forecast - by Application
- 8. Europe Armored Transportation Services Analysis, Insights and Forecast, 2020-2032
- 8.1. Market Analysis, Insights and Forecast - by Application
- 8.1.1. Banking
- 8.1.2. Government
- 8.1.3. Personal
- 8.1.4. Others
- 8.2. Market Analysis, Insights and Forecast - by Types
- 8.2.1. Cash Transportation
- 8.2.2. Valuables Transportation
- 8.2.3. Others
- 8.1. Market Analysis, Insights and Forecast - by Application
- 9. Middle East & Africa Armored Transportation Services Analysis, Insights and Forecast, 2020-2032
- 9.1. Market Analysis, Insights and Forecast - by Application
- 9.1.1. Banking
- 9.1.2. Government
- 9.1.3. Personal
- 9.1.4. Others
- 9.2. Market Analysis, Insights and Forecast - by Types
- 9.2.1. Cash Transportation
- 9.2.2. Valuables Transportation
- 9.2.3. Others
- 9.1. Market Analysis, Insights and Forecast - by Application
- 10. Asia Pacific Armored Transportation Services Analysis, Insights and Forecast, 2020-2032
- 10.1. Market Analysis, Insights and Forecast - by Application
- 10.1.1. Banking
- 10.1.2. Government
- 10.1.3. Personal
- 10.1.4. Others
- 10.2. Market Analysis, Insights and Forecast - by Types
- 10.2.1. Cash Transportation
- 10.2.2. Valuables Transportation
- 10.2.3. Others
- 10.1. Market Analysis, Insights and Forecast - by Application
- 11. Competitive Analysis
- 11.1. Global Market Share Analysis 2025
- 11.2. Company Profiles
- 11.2.1 GardaWorld
- 11.2.1.1. Overview
- 11.2.1.2. Products
- 11.2.1.3. SWOT Analysis
- 11.2.1.4. Recent Developments
- 11.2.1.5. Financials (Based on Availability)
- 11.2.2 Brink's
- 11.2.2.1. Overview
- 11.2.2.2. Products
- 11.2.2.3. SWOT Analysis
- 11.2.2.4. Recent Developments
- 11.2.2.5. Financials (Based on Availability)
- 11.2.3 Axiom
- 11.2.3.1. Overview
- 11.2.3.2. Products
- 11.2.3.3. SWOT Analysis
- 11.2.3.4. Recent Developments
- 11.2.3.5. Financials (Based on Availability)
- 11.2.4 Loomis
- 11.2.4.1. Overview
- 11.2.4.2. Products
- 11.2.4.3. SWOT Analysis
- 11.2.4.4. Recent Developments
- 11.2.4.5. Financials (Based on Availability)
- 11.2.5 Rapid Armored
- 11.2.5.1. Overview
- 11.2.5.2. Products
- 11.2.5.3. SWOT Analysis
- 11.2.5.4. Recent Developments
- 11.2.5.5. Financials (Based on Availability)
- 11.2.6 Fortress Armored Services Company
- 11.2.6.1. Overview
- 11.2.6.2. Products
- 11.2.6.3. SWOT Analysis
- 11.2.6.4. Recent Developments
- 11.2.6.5. Financials (Based on Availability)
- 11.2.7 Eastern Armored Services
- 11.2.7.1. Overview
- 11.2.7.2. Products
- 11.2.7.3. SWOT Analysis
- 11.2.7.4. Recent Developments
- 11.2.7.5. Financials (Based on Availability)
- 11.2.8 Total Armored Car Service
- 11.2.8.1. Overview
- 11.2.8.2. Products
- 11.2.8.3. SWOT Analysis
- 11.2.8.4. Recent Developments
- 11.2.8.5. Financials (Based on Availability)
- 11.2.9 Anbang Save-Guard Group
- 11.2.9.1. Overview
- 11.2.9.2. Products
- 11.2.9.3. SWOT Analysis
- 11.2.9.4. Recent Developments
- 11.2.9.5. Financials (Based on Availability)
- 11.2.10 GRG Banking
- 11.2.10.1. Overview
- 11.2.10.2. Products
- 11.2.10.3. SWOT Analysis
- 11.2.10.4. Recent Developments
- 11.2.10.5. Financials (Based on Availability)
- 11.2.11 Weibao Finance Yayun
- 11.2.11.1. Overview
- 11.2.11.2. Products
- 11.2.11.3. SWOT Analysis
- 11.2.11.4. Recent Developments
- 11.2.11.5. Financials (Based on Availability)
- 11.2.12 China Security & Protection Group
- 11.2.12.1. Overview
- 11.2.12.2. Products
- 11.2.12.3. SWOT Analysis
- 11.2.12.4. Recent Developments
- 11.2.12.5. Financials (Based on Availability)
- 11.2.13 CITIC Outsourcing Service Group
- 11.2.13.1. Overview
- 11.2.13.2. Products
- 11.2.13.3. SWOT Analysis
- 11.2.13.4. Recent Developments
- 11.2.13.5. Financials (Based on Availability)
- 11.2.14 Kunshan Ping An Special Guard Security Service
- 11.2.14.1. Overview
- 11.2.14.2. Products
- 11.2.14.3. SWOT Analysis
- 11.2.14.4. Recent Developments
- 11.2.14.5. Financials (Based on Availability)
- 11.2.1 GardaWorld
List of Figures
- Figure 1: Global Armored Transportation Services Revenue Breakdown (billion, %) by Region 2025 & 2033
- Figure 2: North America Armored Transportation Services Revenue (billion), by Application 2025 & 2033
- Figure 3: North America Armored Transportation Services Revenue Share (%), by Application 2025 & 2033
- Figure 4: North America Armored Transportation Services Revenue (billion), by Types 2025 & 2033
- Figure 5: North America Armored Transportation Services Revenue Share (%), by Types 2025 & 2033
- Figure 6: North America Armored Transportation Services Revenue (billion), by Country 2025 & 2033
- Figure 7: North America Armored Transportation Services Revenue Share (%), by Country 2025 & 2033
- Figure 8: South America Armored Transportation Services Revenue (billion), by Application 2025 & 2033
- Figure 9: South America Armored Transportation Services Revenue Share (%), by Application 2025 & 2033
- Figure 10: South America Armored Transportation Services Revenue (billion), by Types 2025 & 2033
- Figure 11: South America Armored Transportation Services Revenue Share (%), by Types 2025 & 2033
- Figure 12: South America Armored Transportation Services Revenue (billion), by Country 2025 & 2033
- Figure 13: South America Armored Transportation Services Revenue Share (%), by Country 2025 & 2033
- Figure 14: Europe Armored Transportation Services Revenue (billion), by Application 2025 & 2033
- Figure 15: Europe Armored Transportation Services Revenue Share (%), by Application 2025 & 2033
- Figure 16: Europe Armored Transportation Services Revenue (billion), by Types 2025 & 2033
- Figure 17: Europe Armored Transportation Services Revenue Share (%), by Types 2025 & 2033
- Figure 18: Europe Armored Transportation Services Revenue (billion), by Country 2025 & 2033
- Figure 19: Europe Armored Transportation Services Revenue Share (%), by Country 2025 & 2033
- Figure 20: Middle East & Africa Armored Transportation Services Revenue (billion), by Application 2025 & 2033
- Figure 21: Middle East & Africa Armored Transportation Services Revenue Share (%), by Application 2025 & 2033
- Figure 22: Middle East & Africa Armored Transportation Services Revenue (billion), by Types 2025 & 2033
- Figure 23: Middle East & Africa Armored Transportation Services Revenue Share (%), by Types 2025 & 2033
- Figure 24: Middle East & Africa Armored Transportation Services Revenue (billion), by Country 2025 & 2033
- Figure 25: Middle East & Africa Armored Transportation Services Revenue Share (%), by Country 2025 & 2033
- Figure 26: Asia Pacific Armored Transportation Services Revenue (billion), by Application 2025 & 2033
- Figure 27: Asia Pacific Armored Transportation Services Revenue Share (%), by Application 2025 & 2033
- Figure 28: Asia Pacific Armored Transportation Services Revenue (billion), by Types 2025 & 2033
- Figure 29: Asia Pacific Armored Transportation Services Revenue Share (%), by Types 2025 & 2033
- Figure 30: Asia Pacific Armored Transportation Services Revenue (billion), by Country 2025 & 2033
- Figure 31: Asia Pacific Armored Transportation Services Revenue Share (%), by Country 2025 & 2033
List of Tables
- Table 1: Global Armored Transportation Services Revenue billion Forecast, by Application 2020 & 2033
- Table 2: Global Armored Transportation Services Revenue billion Forecast, by Types 2020 & 2033
- Table 3: Global Armored Transportation Services Revenue billion Forecast, by Region 2020 & 2033
- Table 4: Global Armored Transportation Services Revenue billion Forecast, by Application 2020 & 2033
- Table 5: Global Armored Transportation Services Revenue billion Forecast, by Types 2020 & 2033
- Table 6: Global Armored Transportation Services Revenue billion Forecast, by Country 2020 & 2033
- Table 7: United States Armored Transportation Services Revenue (billion) Forecast, by Application 2020 & 2033
- Table 8: Canada Armored Transportation Services Revenue (billion) Forecast, by Application 2020 & 2033
- Table 9: Mexico Armored Transportation Services Revenue (billion) Forecast, by Application 2020 & 2033
- Table 10: Global Armored Transportation Services Revenue billion Forecast, by Application 2020 & 2033
- Table 11: Global Armored Transportation Services Revenue billion Forecast, by Types 2020 & 2033
- Table 12: Global Armored Transportation Services Revenue billion Forecast, by Country 2020 & 2033
- Table 13: Brazil Armored Transportation Services Revenue (billion) Forecast, by Application 2020 & 2033
- Table 14: Argentina Armored Transportation Services Revenue (billion) Forecast, by Application 2020 & 2033
- Table 15: Rest of South America Armored Transportation Services Revenue (billion) Forecast, by Application 2020 & 2033
- Table 16: Global Armored Transportation Services Revenue billion Forecast, by Application 2020 & 2033
- Table 17: Global Armored Transportation Services Revenue billion Forecast, by Types 2020 & 2033
- Table 18: Global Armored Transportation Services Revenue billion Forecast, by Country 2020 & 2033
- Table 19: United Kingdom Armored Transportation Services Revenue (billion) Forecast, by Application 2020 & 2033
- Table 20: Germany Armored Transportation Services Revenue (billion) Forecast, by Application 2020 & 2033
- Table 21: France Armored Transportation Services Revenue (billion) Forecast, by Application 2020 & 2033
- Table 22: Italy Armored Transportation Services Revenue (billion) Forecast, by Application 2020 & 2033
- Table 23: Spain Armored Transportation Services Revenue (billion) Forecast, by Application 2020 & 2033
- Table 24: Russia Armored Transportation Services Revenue (billion) Forecast, by Application 2020 & 2033
- Table 25: Benelux Armored Transportation Services Revenue (billion) Forecast, by Application 2020 & 2033
- Table 26: Nordics Armored Transportation Services Revenue (billion) Forecast, by Application 2020 & 2033
- Table 27: Rest of Europe Armored Transportation Services Revenue (billion) Forecast, by Application 2020 & 2033
- Table 28: Global Armored Transportation Services Revenue billion Forecast, by Application 2020 & 2033
- Table 29: Global Armored Transportation Services Revenue billion Forecast, by Types 2020 & 2033
- Table 30: Global Armored Transportation Services Revenue billion Forecast, by Country 2020 & 2033
- Table 31: Turkey Armored Transportation Services Revenue (billion) Forecast, by Application 2020 & 2033
- Table 32: Israel Armored Transportation Services Revenue (billion) Forecast, by Application 2020 & 2033
- Table 33: GCC Armored Transportation Services Revenue (billion) Forecast, by Application 2020 & 2033
- Table 34: North Africa Armored Transportation Services Revenue (billion) Forecast, by Application 2020 & 2033
- Table 35: South Africa Armored Transportation Services Revenue (billion) Forecast, by Application 2020 & 2033
- Table 36: Rest of Middle East & Africa Armored Transportation Services Revenue (billion) Forecast, by Application 2020 & 2033
- Table 37: Global Armored Transportation Services Revenue billion Forecast, by Application 2020 & 2033
- Table 38: Global Armored Transportation Services Revenue billion Forecast, by Types 2020 & 2033
- Table 39: Global Armored Transportation Services Revenue billion Forecast, by Country 2020 & 2033
- Table 40: China Armored Transportation Services Revenue (billion) Forecast, by Application 2020 & 2033
- Table 41: India Armored Transportation Services Revenue (billion) Forecast, by Application 2020 & 2033
- Table 42: Japan Armored Transportation Services Revenue (billion) Forecast, by Application 2020 & 2033
- Table 43: South Korea Armored Transportation Services Revenue (billion) Forecast, by Application 2020 & 2033
- Table 44: ASEAN Armored Transportation Services Revenue (billion) Forecast, by Application 2020 & 2033
- Table 45: Oceania Armored Transportation Services Revenue (billion) Forecast, by Application 2020 & 2033
- Table 46: Rest of Asia Pacific Armored Transportation Services Revenue (billion) Forecast, by Application 2020 & 2033
Frequently Asked Questions
1. What is the projected Compound Annual Growth Rate (CAGR) of the Armored Transportation Services?
The projected CAGR is approximately 0.6%.
2. Which companies are prominent players in the Armored Transportation Services?
Key companies in the market include GardaWorld, Brink's, Axiom, Loomis, Rapid Armored, Fortress Armored Services Company, Eastern Armored Services, Total Armored Car Service, Anbang Save-Guard Group, GRG Banking, Weibao Finance Yayun, China Security & Protection Group, CITIC Outsourcing Service Group, Kunshan Ping An Special Guard Security Service.
3. What are the main segments of the Armored Transportation Services?
The market segments include Application, Types.
4. Can you provide details about the market size?
The market size is estimated to be USD 4.3 billion as of 2022.
5. What are some drivers contributing to market growth?
N/A
6. What are the notable trends driving market growth?
N/A
7. Are there any restraints impacting market growth?
N/A
8. Can you provide examples of recent developments in the market?
N/A
9. What pricing options are available for accessing the report?
Pricing options include single-user, multi-user, and enterprise licenses priced at USD 2900.00, USD 4350.00, and USD 5800.00 respectively.
10. Is the market size provided in terms of value or volume?
The market size is provided in terms of value, measured in billion.
11. Are there any specific market keywords associated with the report?
Yes, the market keyword associated with the report is "Armored Transportation Services," which aids in identifying and referencing the specific market segment covered.
12. How do I determine which pricing option suits my needs best?
The pricing options vary based on user requirements and access needs. Individual users may opt for single-user licenses, while businesses requiring broader access may choose multi-user or enterprise licenses for cost-effective access to the report.
13. Are there any additional resources or data provided in the Armored Transportation Services report?
While the report offers comprehensive insights, it's advisable to review the specific contents or supplementary materials provided to ascertain if additional resources or data are available.
14. How can I stay updated on further developments or reports in the Armored Transportation Services?
To stay informed about further developments, trends, and reports in the Armored Transportation Services, consider subscribing to industry newsletters, following relevant companies and organizations, or regularly checking reputable industry news sources and publications.
Methodology
Step 1 - Identification of Relevant Samples Size from Population Database


Step 2 - Approaches for Defining Global Market Size (Value, Volume* & Price*)

Note*: In applicable scenarios
Step 3 - Data Sources
Primary Research
- Web Analytics
- Survey Reports
- Research Institute
- Latest Research Reports
- Opinion Leaders
Secondary Research
- Annual Reports
- White Paper
- Latest Press Release
- Industry Association
- Paid Database
- Investor Presentations

Step 4 - Data Triangulation
Involves using different sources of information in order to increase the validity of a study
These sources are likely to be stakeholders in a program - participants, other researchers, program staff, other community members, and so on.
Then we put all data in single framework & apply various statistical tools to find out the dynamic on the market.
During the analysis stage, feedback from the stakeholder groups would be compared to determine areas of agreement as well as areas of divergence