

Key Insights
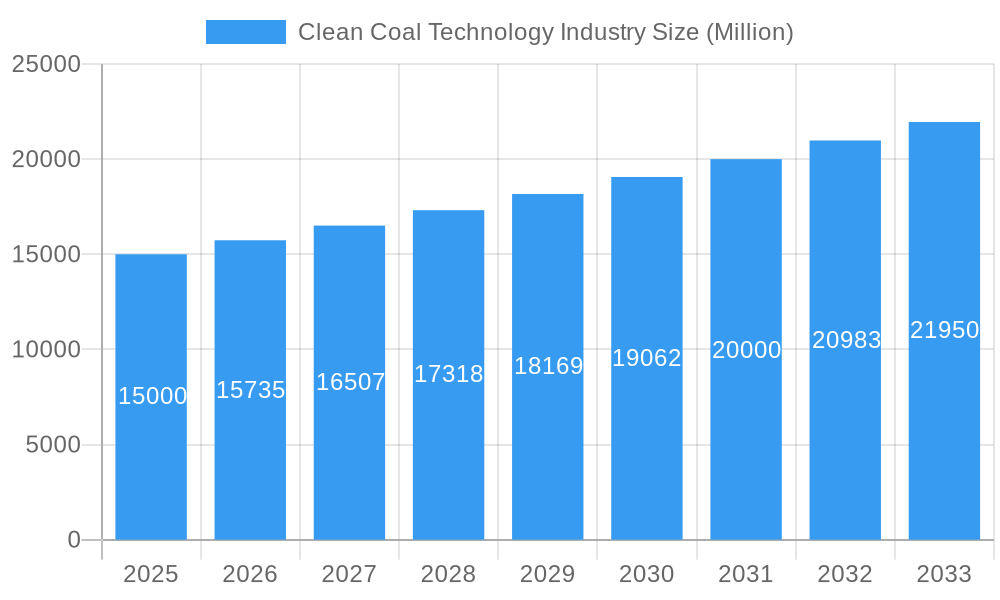
The global Clean Coal Technology (CCT) market is projected to reach $4.57 billion by 2025, with a Compound Annual Growth Rate (CAGR) of 6.39% from 2025 to 2033. This expansion is driven by stringent environmental regulations, growing awareness of climate change, and advancements in technologies such as Carbon Capture and Storage (CCS), advanced combustion, and Flue Gas Desulfurization (FGD). The market is segmented by technology (CCS, advanced combustion, FGD, Selective Catalytic Reduction – SCR) and application (power generation, industrial processes, residential and commercial heating). While power generation currently leads, industrial applications are expected to grow significantly due to increased industrial activity and stricter emission standards. Key market challenges include high implementation costs, energy intensity of some technologies, and ongoing environmental impact debates. North America, Europe, and Asia-Pacific are major market regions due to existing coal infrastructure and regulatory frameworks.
Clean Coal Technology Industry Market Size (In Billion)
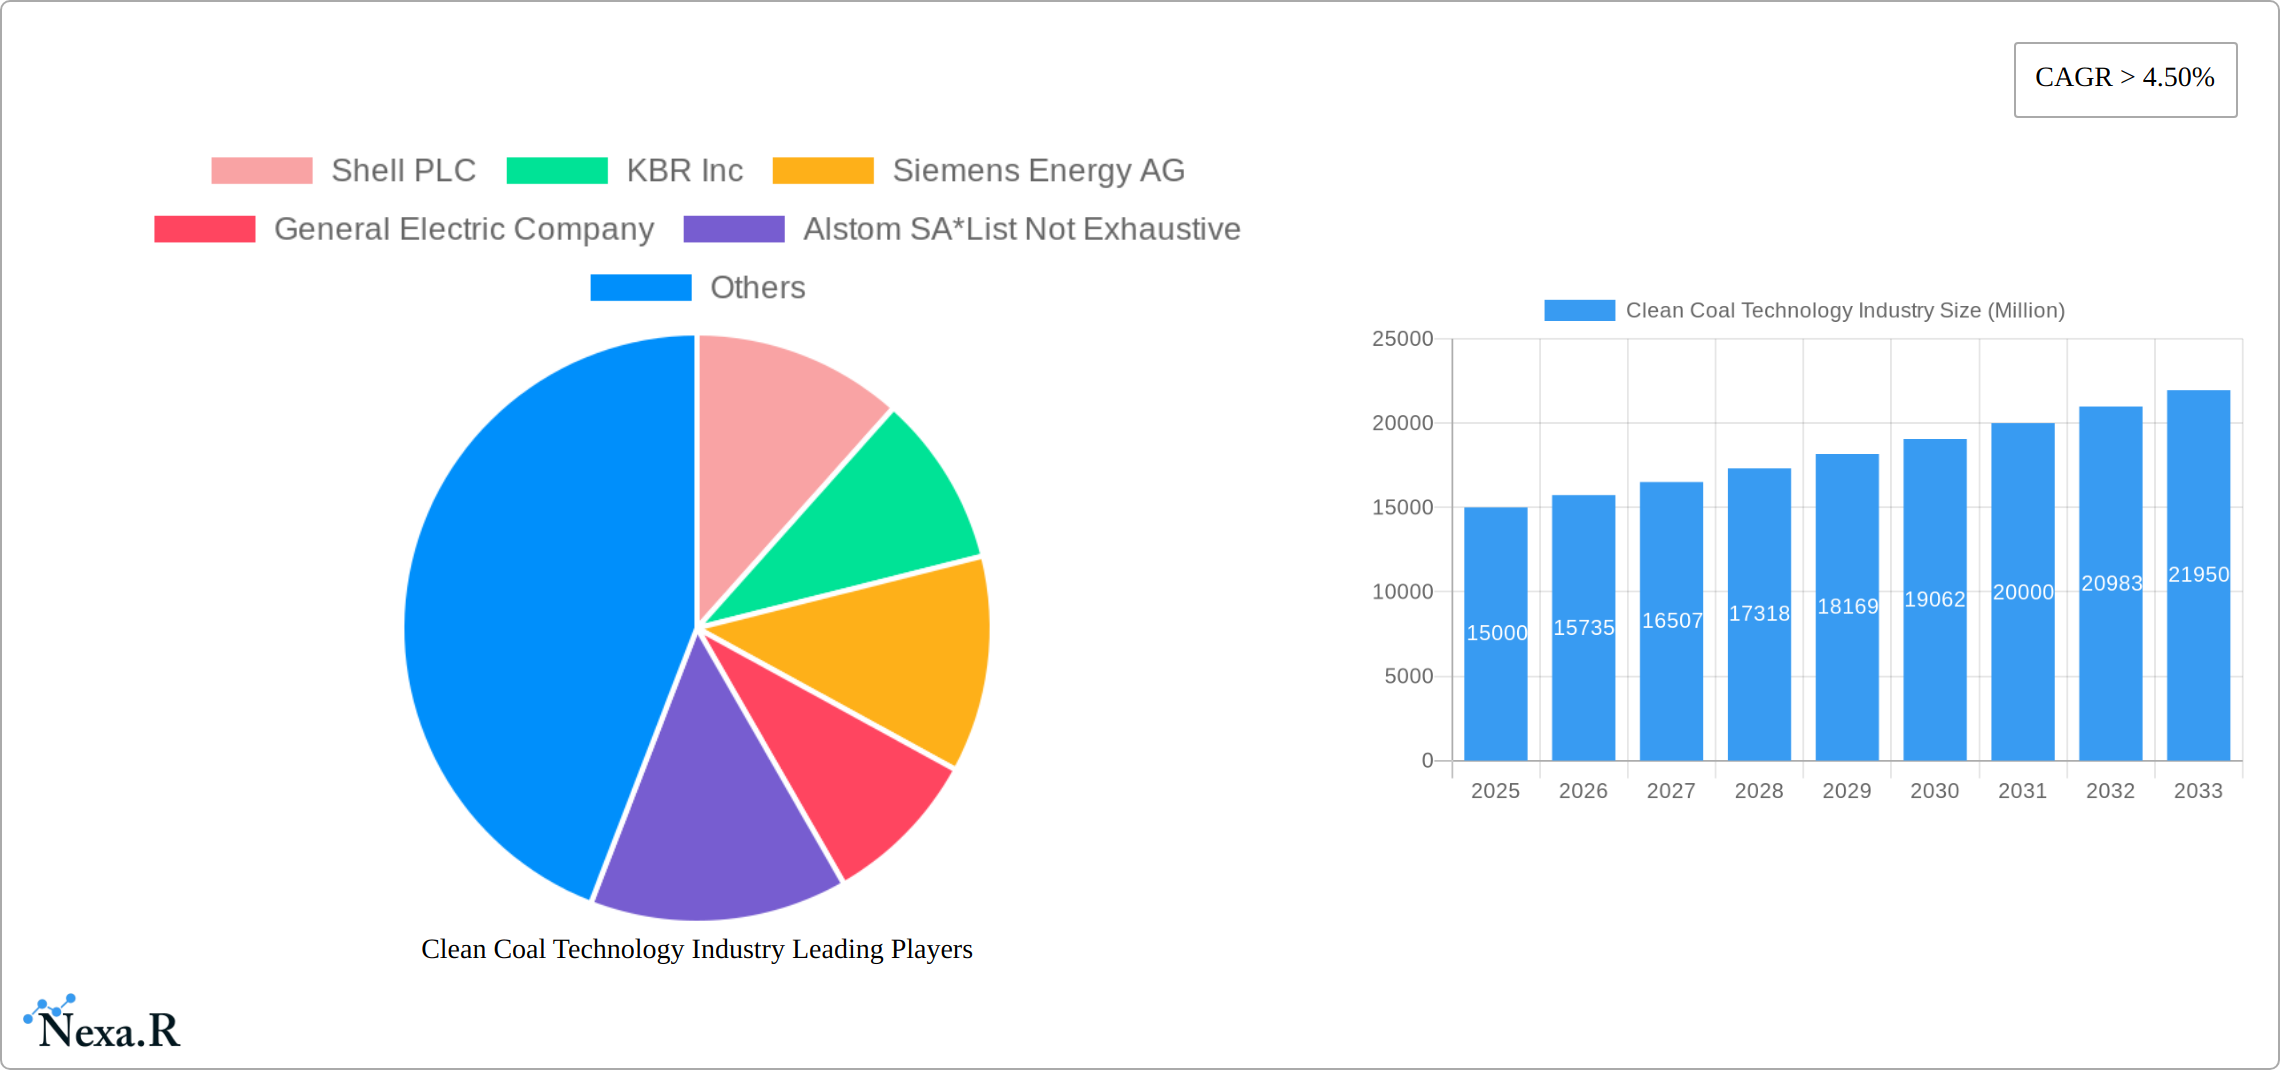
Despite challenges, the CCT market outlook is positive, supported by continuous technological improvements, favorable government policies, and increasing private investment. Carbon pricing and net-zero emission targets are further incentivizing CCT adoption. While competing with renewables, CCT will likely bridge the energy transition in regions with substantial coal reserves. Key players like Shell PLC, KBR Inc., Siemens Energy AG, General Electric, and Alstom are driving innovation and market penetration. Future growth hinges on CCS technology advancements to minimize the carbon footprint of coal-fired power generation.
Clean Coal Technology Industry Company Market Share
Clean Coal Technology Industry Market Report: 2019-2033
This comprehensive report provides a detailed analysis of the Clean Coal Technology (CCT) industry, encompassing market dynamics, growth trends, regional insights, and key player strategies. The study period covers 2019-2033, with a base year of 2025 and a forecast period of 2025-2033. The report uses data from the historical period (2019-2024) to project future market trends and opportunities across various segments, including CCS, advanced combustion, FGD, and SCR technologies, and applications in power generation, industrial processes, and residential/commercial heating. The report identifies key players like Shell PLC, KBR Inc, Siemens Energy AG, General Electric Company, and Alstom SA, among others, providing insights into their market strategies and contributions. The report values are presented in millions.
Clean Coal Technology Industry Market Dynamics & Structure
The Clean Coal Technology (CCT) market is currently characterized by a moderately concentrated landscape, with a select group of major players wielding considerable influence. The primary impetus for market expansion stems from increasingly stringent global environmental regulations designed to curb greenhouse gas emissions and elevate air quality standards. Technological innovation, with a particular emphasis on Carbon Capture and Storage (CCS) advancements, is a pivotal growth driver. However, the market also faces a significant competitive challenge from the growing availability and cost-effectiveness of renewable energy sources. Merger and acquisition (M&A) activity remains steady, primarily driven by strategic imperatives for companies to enhance their technological portfolios and broaden their market penetration.
- Market Concentration: Projections estimate the top 5 players will hold approximately XX% of the market share by 2025, indicating a continued moderate concentration.
- Technological Innovation Drivers: Key drivers include substantial government incentives for the research, development, and deployment of CCS technologies, alongside significant progress in advanced combustion techniques and materials science.
- Regulatory Frameworks: The imposition of rigorous emission standards across diverse geographical regions is a critical factor compelling the adoption and implementation of CCT solutions.
- Competitive Product Substitutes: The escalating adoption and cost-competitiveness of renewable energy sources such as solar and wind power present a notable competitive threat to coal-based energy generation requiring CCT.
- End-User Demographics: The primary consumers of Clean Coal Technologies are power generation companies and large-scale industrial facilities that rely on fossil fuels for their energy needs.
- M&A Trends: The past five years have witnessed approximately XX M&A deals, predominantly focusing on the strategic integration of cutting-edge technologies, particularly CCS, and achieving geographical market expansion.
Clean Coal Technology Industry Growth Trends & Insights
The global Clean Coal Technology market is projected to experience robust growth during the forecast period (2025-2033). Driven by increasing demand for electricity and stringent environmental regulations, the market size is expected to reach xx Million by 2033, exhibiting a CAGR of xx% from 2025. Technological advancements in CCS and advanced combustion techniques are accelerating adoption rates, especially in regions with significant coal-fired power generation capacity. Consumer behavior shifts towards environmentally conscious energy solutions are also influencing market growth, albeit indirectly, by pressuring utilities and industries to adopt cleaner technologies. The increasing focus on improving energy efficiency and reducing carbon footprint across industrial applications is also a significant growth catalyst. Further analysis of the impact of policy changes and technological advancements on consumer behavior and adoption rates are provided.
Dominant Regions, Countries, or Segments in Clean Coal Technology Industry
The Asia-Pacific region is expected to dominate the Clean Coal Technology market during the forecast period, driven by substantial coal-fired power generation capacity and supportive government policies promoting clean coal technologies. China and India are expected to be the leading contributors, followed by other developing economies in the region. Within the technology segments, CCS is experiencing rapid growth, due to its potential for significant CO2 emission reductions. However, FGD and SCR technologies remain prevalent due to their cost-effectiveness and established market penetration. In terms of applications, the power generation sector continues to be the dominant end-user, while industrial processes show promising growth potential.
- Key Drivers in Asia-Pacific:
- Rapid industrialization and growing energy demand.
- Government initiatives to reduce air pollution and greenhouse gas emissions.
- Significant investments in new coal-fired power plants incorporating CCT.
- Dominance Factors:
- Large coal reserves and existing power generation infrastructure.
- Supportive government policies and financial incentives.
- Growing awareness of environmental concerns.
Clean Coal Technology Industry Product Landscape
The Clean Coal Technology industry offers a comprehensive suite of solutions, prominently featuring Carbon Capture and Storage (CCS), advanced combustion systems, Flue Gas Desulfurization (FGD), and Selective Catalytic Reduction (SCR) technologies. Continuous technological advancements are consistently enhancing the efficiency, reliability, and emission reduction capabilities of these products. CCS systems are progressively becoming more economically viable, while advanced combustion technologies are proving highly effective in minimizing NOx and SOx emissions. Furthermore, FGD and SCR systems are undergoing perpetual upgrades to meet and exceed the evolving and increasingly stringent environmental regulations. The core value propositions for these technologies revolve around their proven ability to significantly reduce emissions, improve the operational efficiency of power plants, and ensure compliance with critical environmental mandates.
Key Drivers, Barriers & Challenges in Clean Coal Technology Industry
Key Drivers:
- Stringent environmental regulations pushing for emission reduction.
- Growing demand for electricity, particularly in developing economies.
- Technological advancements leading to increased efficiency and reduced costs.
- Government incentives and subsidies supporting CCT adoption.
Key Challenges:
- High initial capital investment for CCS and other advanced technologies.
- Technological limitations and challenges in CCS deployment at scale.
- Uncertainty surrounding carbon pricing and future regulations.
- Competition from renewable energy sources.
- xx% increase in material costs leading to a predicted xx Million increase in project costs in 2026.
Emerging Opportunities in Clean Coal Technology Industry
Significant emerging opportunities exist within the Clean Coal Technology sector, notably in the synergistic integration of CCT with burgeoning renewable energy infrastructure. The development of even more efficient and cost-effective CCS technologies remains a prime area for innovation and growth. Furthermore, there is substantial potential for market expansion into developing economies that possess a significant existing or planned capacity for coal-fired power generation. Beyond emissions reduction, innovative applications for captured CO2, such as enhanced oil recovery (EOR) and utilization in various industrial processes, represent promising new avenues for value creation.
Growth Accelerators in the Clean Coal Technology Industry
The long-term growth trajectory of the Clean Coal Technology industry is intrinsically linked to sustained technological breakthroughs, particularly in the realm of CCS, focusing on substantial cost reductions and marked improvements in operational efficiency. The fostering of strategic collaborations between technology developers, power generation entities, and leading research institutions is paramount to accelerating both innovation and widespread adoption. Additionally, strategic market penetration into new geographic regions that heavily depend on coal-fired power generation is expected to be a significant contributor to sustained market expansion and growth.
Key Players Shaping the Clean Coal Technology Industry Market
- Shell PLC
- KBR Inc
- Siemens Energy AG
- General Electric Company
- Alstom SA
- List Not Exhaustive
Notable Milestones in Clean Coal Technology Industry Sector
- February 2022: The Indian Institute of Chemical Technology (IICT) announced a collaborative project with Northern Coalfields Limits (NCL) to research sustainable mining and clean coal technologies (CCT). This signifies growing government interest in R&D in India.
- October 2021: Adani Power Limited announced plans to commission the Godda Ultra Super Critical coal thermal power project (1600 MW), boosting demand for CCT in India. This indicates significant future investment in coal power generation with integrated CCT.
In-Depth Clean Coal Technology Industry Market Outlook
The Clean Coal Technology market is poised for significant growth driven by strong demand for efficient and environmentally responsible power generation. Continued technological advancements, supportive government policies, and increasing awareness of environmental concerns will fuel market expansion. Strategic partnerships and investments in research and development will be critical to unlocking the full potential of this market. The focus will shift towards integrating CCT with other technologies and adopting a holistic approach to emissions reduction.
Clean Coal Technology Industry Segmentation
- 1. Production Analysis
- 2. Consumption Analysis
- 3. Import Market Analysis (Value & Volume)
- 4. Export Market Analysis (Value & Volume)
- 5. Price Trend Analysis
Clean Coal Technology Industry Segmentation By Geography
- 1. North America
- 2. Europe
- 3. Asia Pacific
- 4. Middle East and Africa
- 5. South America
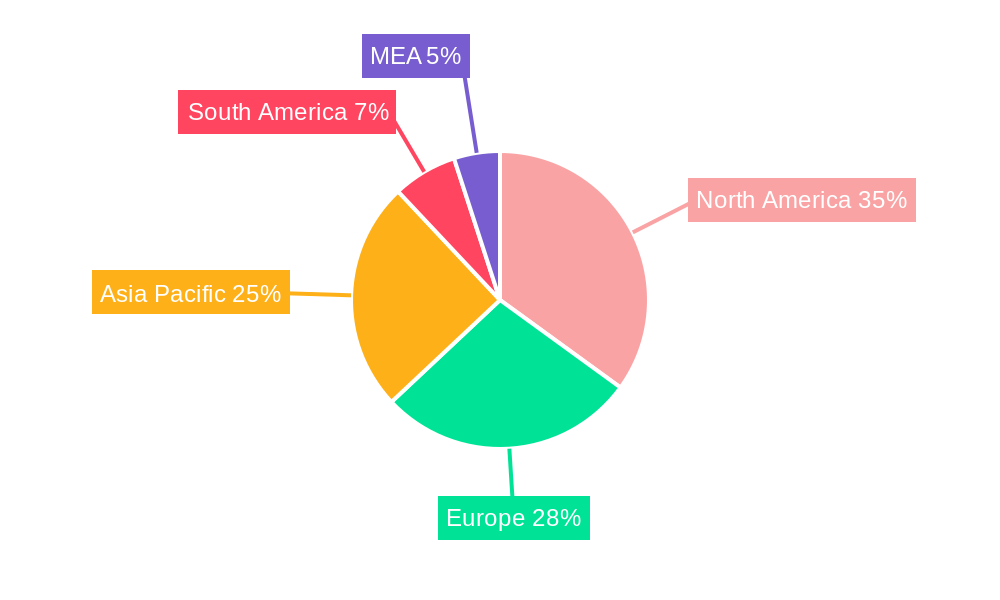
Clean Coal Technology Industry Regional Market Share
Geographic Coverage of Clean Coal Technology Industry
Clean Coal Technology Industry REPORT HIGHLIGHTS
| Aspects | Details |
|---|---|
| Study Period | 2020-2034 |
| Base Year | 2025 |
| Estimated Year | 2026 |
| Forecast Period | 2026-2034 |
| Historical Period | 2020-2025 |
| Growth Rate | CAGR of 6.39% from 2020-2034 |
| Segmentation |
|
Table of Contents
- 1. Introduction
- 1.1. Research Scope
- 1.2. Market Segmentation
- 1.3. Research Objective
- 1.4. Definitions and Assumptions
- 2. Executive Summary
- 2.1. Market Snapshot
- 3. Market Dynamics
- 3.1. Market Drivers
- 3.2. Market Restrains
- 3.3. Market Trends
- 3.4. Market Opportunities
- 4. Market Factor Analysis
- 4.1. Porters Five Forces
- 4.1.1. Bargaining Power of Suppliers
- 4.1.2. Bargaining Power of Buyers
- 4.1.3. Threat of New Entrants
- 4.1.4. Threat of Substitutes
- 4.1.5. Competitive Rivalry
- 4.2. PESTEL analysis
- 4.3. BCG Analysis
- 4.3.1. Stars (High Growth, High Market Share)
- 4.3.2. Cash Cows (Low Growth, High Market Share)
- 4.3.3. Question Mark (High Growth, Low Market Share)
- 4.3.4. Dogs (Low Growth, Low Market Share)
- 4.4. Ansoff Matrix Analysis
- 4.5. Supply Chain Analysis
- 4.6. Regulatory Landscape
- 4.7. Current Market Potential and Opportunity Assessment (TAM–SAM–SOM Framework)
- 4.8. NRP Analyst Note
- 4.1. Porters Five Forces
- 5. Market Analysis, Insights and Forecast 2021-2033
- 5.1. Market Analysis, Insights and Forecast - by Production Analysis
- 5.2. Market Analysis, Insights and Forecast - by Consumption Analysis
- 5.3. Market Analysis, Insights and Forecast - by Import Market Analysis (Value & Volume)
- 5.4. Market Analysis, Insights and Forecast - by Export Market Analysis (Value & Volume)
- 5.5. Market Analysis, Insights and Forecast - by Price Trend Analysis
- 5.6. Market Analysis, Insights and Forecast - by Region
- 5.6.1. North America
- 5.6.2. Europe
- 5.6.3. Asia Pacific
- 5.6.4. Middle East and Africa
- 5.6.5. South America
- 6. Global Clean Coal Technology Industry Analysis, Insights and Forecast, 2021-2033
- 6.1. Market Analysis, Insights and Forecast - by Production Analysis
- 6.2. Market Analysis, Insights and Forecast - by Consumption Analysis
- 6.3. Market Analysis, Insights and Forecast - by Import Market Analysis (Value & Volume)
- 6.4. Market Analysis, Insights and Forecast - by Export Market Analysis (Value & Volume)
- 6.5. Market Analysis, Insights and Forecast - by Price Trend Analysis
- 7. North America Clean Coal Technology Industry Analysis, Insights and Forecast, 2020-2032
- 7.1. Market Analysis, Insights and Forecast - by Production Analysis
- 7.2. Market Analysis, Insights and Forecast - by Consumption Analysis
- 7.3. Market Analysis, Insights and Forecast - by Import Market Analysis (Value & Volume)
- 7.4. Market Analysis, Insights and Forecast - by Export Market Analysis (Value & Volume)
- 7.5. Market Analysis, Insights and Forecast - by Price Trend Analysis
- 8. Europe Clean Coal Technology Industry Analysis, Insights and Forecast, 2020-2032
- 8.1. Market Analysis, Insights and Forecast - by Production Analysis
- 8.2. Market Analysis, Insights and Forecast - by Consumption Analysis
- 8.3. Market Analysis, Insights and Forecast - by Import Market Analysis (Value & Volume)
- 8.4. Market Analysis, Insights and Forecast - by Export Market Analysis (Value & Volume)
- 8.5. Market Analysis, Insights and Forecast - by Price Trend Analysis
- 9. Asia Pacific Clean Coal Technology Industry Analysis, Insights and Forecast, 2020-2032
- 9.1. Market Analysis, Insights and Forecast - by Production Analysis
- 9.2. Market Analysis, Insights and Forecast - by Consumption Analysis
- 9.3. Market Analysis, Insights and Forecast - by Import Market Analysis (Value & Volume)
- 9.4. Market Analysis, Insights and Forecast - by Export Market Analysis (Value & Volume)
- 9.5. Market Analysis, Insights and Forecast - by Price Trend Analysis
- 10. Middle East and Africa Clean Coal Technology Industry Analysis, Insights and Forecast, 2020-2032
- 10.1. Market Analysis, Insights and Forecast - by Production Analysis
- 10.2. Market Analysis, Insights and Forecast - by Consumption Analysis
- 10.3. Market Analysis, Insights and Forecast - by Import Market Analysis (Value & Volume)
- 10.4. Market Analysis, Insights and Forecast - by Export Market Analysis (Value & Volume)
- 10.5. Market Analysis, Insights and Forecast - by Price Trend Analysis
- 11. South America Clean Coal Technology Industry Analysis, Insights and Forecast, 2020-2032
- 11.1. Market Analysis, Insights and Forecast - by Production Analysis
- 11.2. Market Analysis, Insights and Forecast - by Consumption Analysis
- 11.3. Market Analysis, Insights and Forecast - by Import Market Analysis (Value & Volume)
- 11.4. Market Analysis, Insights and Forecast - by Export Market Analysis (Value & Volume)
- 11.5. Market Analysis, Insights and Forecast - by Price Trend Analysis
- 12. Competitive Analysis
- 12.1. Company Profiles
- 12.1.1 Shell PLC
- 12.1.1.1. Company Overview
- 12.1.1.2. Products
- 12.1.1.3. Company Financials
- 12.1.1.4. SWOT Analysis
- 12.1.2 KBR Inc
- 12.1.2.1. Company Overview
- 12.1.2.2. Products
- 12.1.2.3. Company Financials
- 12.1.2.4. SWOT Analysis
- 12.1.3 Siemens Energy AG
- 12.1.3.1. Company Overview
- 12.1.3.2. Products
- 12.1.3.3. Company Financials
- 12.1.3.4. SWOT Analysis
- 12.1.4 General Electric Company
- 12.1.4.1. Company Overview
- 12.1.4.2. Products
- 12.1.4.3. Company Financials
- 12.1.4.4. SWOT Analysis
- 12.1.5 Alstom SA*List Not Exhaustive
- 12.1.5.1. Company Overview
- 12.1.5.2. Products
- 12.1.5.3. Company Financials
- 12.1.5.4. SWOT Analysis
- 12.1.1 Shell PLC
- 12.2. Market Entropy
- 12.2.1 Company's Key Areas Served
- 12.2.2 Recent Developments
- 12.3. Company Market Share Analysis 2025
- 12.3.1 Top 5 Companies Market Share Analysis
- 12.3.2 Top 3 Companies Market Share Analysis
- 12.4. List of Potential Customers
- 13. Research Methodology
List of Figures
- Figure 1: Global Clean Coal Technology Industry Revenue Breakdown (billion, %) by Region 2025 & 2033
- Figure 2: North America Clean Coal Technology Industry Revenue (billion), by Production Analysis 2025 & 2033
- Figure 3: North America Clean Coal Technology Industry Revenue Share (%), by Production Analysis 2025 & 2033
- Figure 4: North America Clean Coal Technology Industry Revenue (billion), by Consumption Analysis 2025 & 2033
- Figure 5: North America Clean Coal Technology Industry Revenue Share (%), by Consumption Analysis 2025 & 2033
- Figure 6: North America Clean Coal Technology Industry Revenue (billion), by Import Market Analysis (Value & Volume) 2025 & 2033
- Figure 7: North America Clean Coal Technology Industry Revenue Share (%), by Import Market Analysis (Value & Volume) 2025 & 2033
- Figure 8: North America Clean Coal Technology Industry Revenue (billion), by Export Market Analysis (Value & Volume) 2025 & 2033
- Figure 9: North America Clean Coal Technology Industry Revenue Share (%), by Export Market Analysis (Value & Volume) 2025 & 2033
- Figure 10: North America Clean Coal Technology Industry Revenue (billion), by Price Trend Analysis 2025 & 2033
- Figure 11: North America Clean Coal Technology Industry Revenue Share (%), by Price Trend Analysis 2025 & 2033
- Figure 12: North America Clean Coal Technology Industry Revenue (billion), by Country 2025 & 2033
- Figure 13: North America Clean Coal Technology Industry Revenue Share (%), by Country 2025 & 2033
- Figure 14: Europe Clean Coal Technology Industry Revenue (billion), by Production Analysis 2025 & 2033
- Figure 15: Europe Clean Coal Technology Industry Revenue Share (%), by Production Analysis 2025 & 2033
- Figure 16: Europe Clean Coal Technology Industry Revenue (billion), by Consumption Analysis 2025 & 2033
- Figure 17: Europe Clean Coal Technology Industry Revenue Share (%), by Consumption Analysis 2025 & 2033
- Figure 18: Europe Clean Coal Technology Industry Revenue (billion), by Import Market Analysis (Value & Volume) 2025 & 2033
- Figure 19: Europe Clean Coal Technology Industry Revenue Share (%), by Import Market Analysis (Value & Volume) 2025 & 2033
- Figure 20: Europe Clean Coal Technology Industry Revenue (billion), by Export Market Analysis (Value & Volume) 2025 & 2033
- Figure 21: Europe Clean Coal Technology Industry Revenue Share (%), by Export Market Analysis (Value & Volume) 2025 & 2033
- Figure 22: Europe Clean Coal Technology Industry Revenue (billion), by Price Trend Analysis 2025 & 2033
- Figure 23: Europe Clean Coal Technology Industry Revenue Share (%), by Price Trend Analysis 2025 & 2033
- Figure 24: Europe Clean Coal Technology Industry Revenue (billion), by Country 2025 & 2033
- Figure 25: Europe Clean Coal Technology Industry Revenue Share (%), by Country 2025 & 2033
- Figure 26: Asia Pacific Clean Coal Technology Industry Revenue (billion), by Production Analysis 2025 & 2033
- Figure 27: Asia Pacific Clean Coal Technology Industry Revenue Share (%), by Production Analysis 2025 & 2033
- Figure 28: Asia Pacific Clean Coal Technology Industry Revenue (billion), by Consumption Analysis 2025 & 2033
- Figure 29: Asia Pacific Clean Coal Technology Industry Revenue Share (%), by Consumption Analysis 2025 & 2033
- Figure 30: Asia Pacific Clean Coal Technology Industry Revenue (billion), by Import Market Analysis (Value & Volume) 2025 & 2033
- Figure 31: Asia Pacific Clean Coal Technology Industry Revenue Share (%), by Import Market Analysis (Value & Volume) 2025 & 2033
- Figure 32: Asia Pacific Clean Coal Technology Industry Revenue (billion), by Export Market Analysis (Value & Volume) 2025 & 2033
- Figure 33: Asia Pacific Clean Coal Technology Industry Revenue Share (%), by Export Market Analysis (Value & Volume) 2025 & 2033
- Figure 34: Asia Pacific Clean Coal Technology Industry Revenue (billion), by Price Trend Analysis 2025 & 2033
- Figure 35: Asia Pacific Clean Coal Technology Industry Revenue Share (%), by Price Trend Analysis 2025 & 2033
- Figure 36: Asia Pacific Clean Coal Technology Industry Revenue (billion), by Country 2025 & 2033
- Figure 37: Asia Pacific Clean Coal Technology Industry Revenue Share (%), by Country 2025 & 2033
- Figure 38: Middle East and Africa Clean Coal Technology Industry Revenue (billion), by Production Analysis 2025 & 2033
- Figure 39: Middle East and Africa Clean Coal Technology Industry Revenue Share (%), by Production Analysis 2025 & 2033
- Figure 40: Middle East and Africa Clean Coal Technology Industry Revenue (billion), by Consumption Analysis 2025 & 2033
- Figure 41: Middle East and Africa Clean Coal Technology Industry Revenue Share (%), by Consumption Analysis 2025 & 2033
- Figure 42: Middle East and Africa Clean Coal Technology Industry Revenue (billion), by Import Market Analysis (Value & Volume) 2025 & 2033
- Figure 43: Middle East and Africa Clean Coal Technology Industry Revenue Share (%), by Import Market Analysis (Value & Volume) 2025 & 2033
- Figure 44: Middle East and Africa Clean Coal Technology Industry Revenue (billion), by Export Market Analysis (Value & Volume) 2025 & 2033
- Figure 45: Middle East and Africa Clean Coal Technology Industry Revenue Share (%), by Export Market Analysis (Value & Volume) 2025 & 2033
- Figure 46: Middle East and Africa Clean Coal Technology Industry Revenue (billion), by Price Trend Analysis 2025 & 2033
- Figure 47: Middle East and Africa Clean Coal Technology Industry Revenue Share (%), by Price Trend Analysis 2025 & 2033
- Figure 48: Middle East and Africa Clean Coal Technology Industry Revenue (billion), by Country 2025 & 2033
- Figure 49: Middle East and Africa Clean Coal Technology Industry Revenue Share (%), by Country 2025 & 2033
- Figure 50: South America Clean Coal Technology Industry Revenue (billion), by Production Analysis 2025 & 2033
- Figure 51: South America Clean Coal Technology Industry Revenue Share (%), by Production Analysis 2025 & 2033
- Figure 52: South America Clean Coal Technology Industry Revenue (billion), by Consumption Analysis 2025 & 2033
- Figure 53: South America Clean Coal Technology Industry Revenue Share (%), by Consumption Analysis 2025 & 2033
- Figure 54: South America Clean Coal Technology Industry Revenue (billion), by Import Market Analysis (Value & Volume) 2025 & 2033
- Figure 55: South America Clean Coal Technology Industry Revenue Share (%), by Import Market Analysis (Value & Volume) 2025 & 2033
- Figure 56: South America Clean Coal Technology Industry Revenue (billion), by Export Market Analysis (Value & Volume) 2025 & 2033
- Figure 57: South America Clean Coal Technology Industry Revenue Share (%), by Export Market Analysis (Value & Volume) 2025 & 2033
- Figure 58: South America Clean Coal Technology Industry Revenue (billion), by Price Trend Analysis 2025 & 2033
- Figure 59: South America Clean Coal Technology Industry Revenue Share (%), by Price Trend Analysis 2025 & 2033
- Figure 60: South America Clean Coal Technology Industry Revenue (billion), by Country 2025 & 2033
- Figure 61: South America Clean Coal Technology Industry Revenue Share (%), by Country 2025 & 2033
List of Tables
- Table 1: Global Clean Coal Technology Industry Revenue billion Forecast, by Production Analysis 2020 & 2033
- Table 2: Global Clean Coal Technology Industry Revenue billion Forecast, by Consumption Analysis 2020 & 2033
- Table 3: Global Clean Coal Technology Industry Revenue billion Forecast, by Import Market Analysis (Value & Volume) 2020 & 2033
- Table 4: Global Clean Coal Technology Industry Revenue billion Forecast, by Export Market Analysis (Value & Volume) 2020 & 2033
- Table 5: Global Clean Coal Technology Industry Revenue billion Forecast, by Price Trend Analysis 2020 & 2033
- Table 6: Global Clean Coal Technology Industry Revenue billion Forecast, by Region 2020 & 2033
- Table 7: Global Clean Coal Technology Industry Revenue billion Forecast, by Production Analysis 2020 & 2033
- Table 8: Global Clean Coal Technology Industry Revenue billion Forecast, by Consumption Analysis 2020 & 2033
- Table 9: Global Clean Coal Technology Industry Revenue billion Forecast, by Import Market Analysis (Value & Volume) 2020 & 2033
- Table 10: Global Clean Coal Technology Industry Revenue billion Forecast, by Export Market Analysis (Value & Volume) 2020 & 2033
- Table 11: Global Clean Coal Technology Industry Revenue billion Forecast, by Price Trend Analysis 2020 & 2033
- Table 12: Global Clean Coal Technology Industry Revenue billion Forecast, by Country 2020 & 2033
- Table 13: Global Clean Coal Technology Industry Revenue billion Forecast, by Production Analysis 2020 & 2033
- Table 14: Global Clean Coal Technology Industry Revenue billion Forecast, by Consumption Analysis 2020 & 2033
- Table 15: Global Clean Coal Technology Industry Revenue billion Forecast, by Import Market Analysis (Value & Volume) 2020 & 2033
- Table 16: Global Clean Coal Technology Industry Revenue billion Forecast, by Export Market Analysis (Value & Volume) 2020 & 2033
- Table 17: Global Clean Coal Technology Industry Revenue billion Forecast, by Price Trend Analysis 2020 & 2033
- Table 18: Global Clean Coal Technology Industry Revenue billion Forecast, by Country 2020 & 2033
- Table 19: Global Clean Coal Technology Industry Revenue billion Forecast, by Production Analysis 2020 & 2033
- Table 20: Global Clean Coal Technology Industry Revenue billion Forecast, by Consumption Analysis 2020 & 2033
- Table 21: Global Clean Coal Technology Industry Revenue billion Forecast, by Import Market Analysis (Value & Volume) 2020 & 2033
- Table 22: Global Clean Coal Technology Industry Revenue billion Forecast, by Export Market Analysis (Value & Volume) 2020 & 2033
- Table 23: Global Clean Coal Technology Industry Revenue billion Forecast, by Price Trend Analysis 2020 & 2033
- Table 24: Global Clean Coal Technology Industry Revenue billion Forecast, by Country 2020 & 2033
- Table 25: Global Clean Coal Technology Industry Revenue billion Forecast, by Production Analysis 2020 & 2033
- Table 26: Global Clean Coal Technology Industry Revenue billion Forecast, by Consumption Analysis 2020 & 2033
- Table 27: Global Clean Coal Technology Industry Revenue billion Forecast, by Import Market Analysis (Value & Volume) 2020 & 2033
- Table 28: Global Clean Coal Technology Industry Revenue billion Forecast, by Export Market Analysis (Value & Volume) 2020 & 2033
- Table 29: Global Clean Coal Technology Industry Revenue billion Forecast, by Price Trend Analysis 2020 & 2033
- Table 30: Global Clean Coal Technology Industry Revenue billion Forecast, by Country 2020 & 2033
- Table 31: Global Clean Coal Technology Industry Revenue billion Forecast, by Production Analysis 2020 & 2033
- Table 32: Global Clean Coal Technology Industry Revenue billion Forecast, by Consumption Analysis 2020 & 2033
- Table 33: Global Clean Coal Technology Industry Revenue billion Forecast, by Import Market Analysis (Value & Volume) 2020 & 2033
- Table 34: Global Clean Coal Technology Industry Revenue billion Forecast, by Export Market Analysis (Value & Volume) 2020 & 2033
- Table 35: Global Clean Coal Technology Industry Revenue billion Forecast, by Price Trend Analysis 2020 & 2033
- Table 36: Global Clean Coal Technology Industry Revenue billion Forecast, by Country 2020 & 2033
Frequently Asked Questions
1. What is the projected Compound Annual Growth Rate (CAGR) of the Clean Coal Technology Industry?
The projected CAGR is approximately 6.39%.
2. Which companies are prominent players in the Clean Coal Technology Industry?
Key companies in the market include Shell PLC, KBR Inc, Siemens Energy AG, General Electric Company, Alstom SA*List Not Exhaustive.
3. What are the main segments of the Clean Coal Technology Industry?
The market segments include Production Analysis, Consumption Analysis, Import Market Analysis (Value & Volume), Export Market Analysis (Value & Volume), Price Trend Analysis.
4. Can you provide details about the market size?
The market size is estimated to be USD 4.57 billion as of 2022.
5. What are some drivers contributing to market growth?
4.; Modernization and Upgrades of Existing Military Aircraft Fleets4.; Increasing Defense Budgets.
6. What are the notable trends driving market growth?
Growth in Power Consumption is Likely to Drive the Market.
7. Are there any restraints impacting market growth?
4.; Shift Toward Unmanned Aircraft.
8. Can you provide examples of recent developments in the market?
In February 2022, the Indian Institute of Chemical Technology (IICT) announced a collaborative project of approximately INR 7.31 core with Northern Coalfields Limits (NCL), Madhya Pradesh (MP), to take up research and development in the field of sustainable mining and clean coal technologies (CCT).
9. What pricing options are available for accessing the report?
Pricing options include single-user, multi-user, and enterprise licenses priced at USD 4750, USD 5250, and USD 8750 respectively.
10. Is the market size provided in terms of value or volume?
The market size is provided in terms of value, measured in billion.
11. Are there any specific market keywords associated with the report?
Yes, the market keyword associated with the report is "Clean Coal Technology Industry," which aids in identifying and referencing the specific market segment covered.
12. How do I determine which pricing option suits my needs best?
The pricing options vary based on user requirements and access needs. Individual users may opt for single-user licenses, while businesses requiring broader access may choose multi-user or enterprise licenses for cost-effective access to the report.
13. Are there any additional resources or data provided in the Clean Coal Technology Industry report?
While the report offers comprehensive insights, it's advisable to review the specific contents or supplementary materials provided to ascertain if additional resources or data are available.
14. How can I stay updated on further developments or reports in the Clean Coal Technology Industry?
To stay informed about further developments, trends, and reports in the Clean Coal Technology Industry, consider subscribing to industry newsletters, following relevant companies and organizations, or regularly checking reputable industry news sources and publications.
Methodology
Step 1 - Identification of Relevant Samples Size from Population Database


Step 2 - Approaches for Defining Global Market Size (Value, Volume* & Price*)

Note*: In applicable scenarios
Step 3 - Data Sources
Primary Research
- Web Analytics
- Survey Reports
- Research Institute
- Latest Research Reports
- Opinion Leaders
Secondary Research
- Annual Reports
- White Paper
- Latest Press Release
- Industry Association
- Paid Database
- Investor Presentations

Step 4 - Data Triangulation
Involves using different sources of information in order to increase the validity of a study
These sources are likely to be stakeholders in a program - participants, other researchers, program staff, other community members, and so on.
Then we put all data in single framework & apply various statistical tools to find out the dynamic on the market.
During the analysis stage, feedback from the stakeholder groups would be compared to determine areas of agreement as well as areas of divergence