

Key Insights
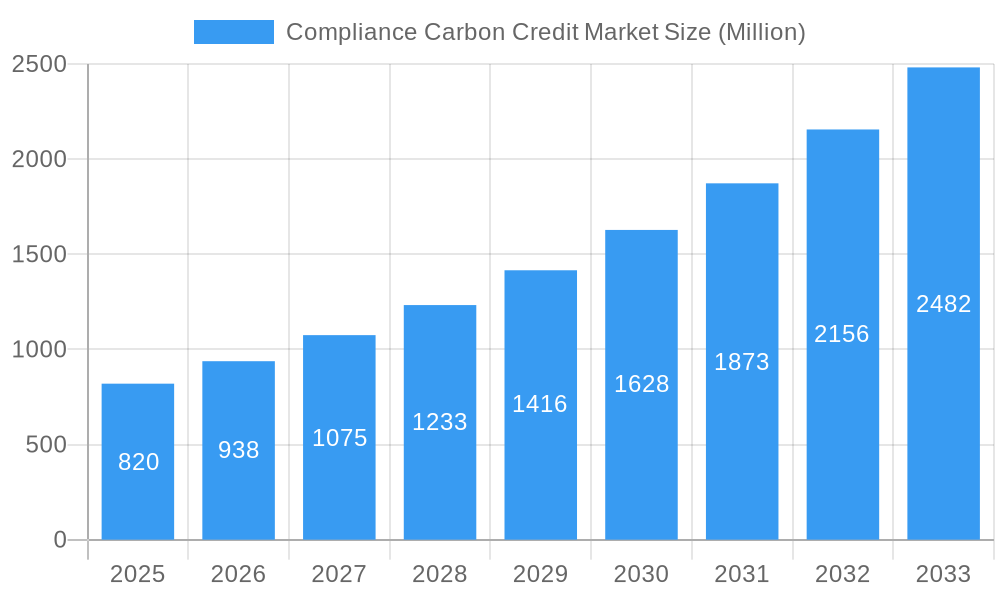
The compliance carbon credit market, valued at $820 million in 2025, is experiencing robust growth, projected to expand at a Compound Annual Growth Rate (CAGR) of 14.81% from 2025 to 2033. This surge is primarily driven by increasing regulatory pressure on businesses to reduce their carbon footprint, coupled with growing awareness of environmental, social, and governance (ESG) factors among investors and consumers. Stringent emission reduction targets set by governments worldwide, particularly within the European Union and North America, are fueling demand for compliance credits. The energy sector, followed by transportation and industrial sectors, are major consumers of these credits, largely due to their significant greenhouse gas emissions. Renewable energy projects constitute a substantial portion of the carbon credit supply, followed by forestry and land use projects which offer a natural carbon sequestration solution. The market's growth is further stimulated by technological advancements enhancing carbon monitoring and verification processes, leading to greater transparency and trust within the carbon credit market. However, challenges remain, including concerns about the accuracy and reliability of carbon credit methodologies and potential for market manipulation. Addressing these concerns through improved standardization and robust verification protocols will be crucial to ensure the market's long-term sustainability and credibility.
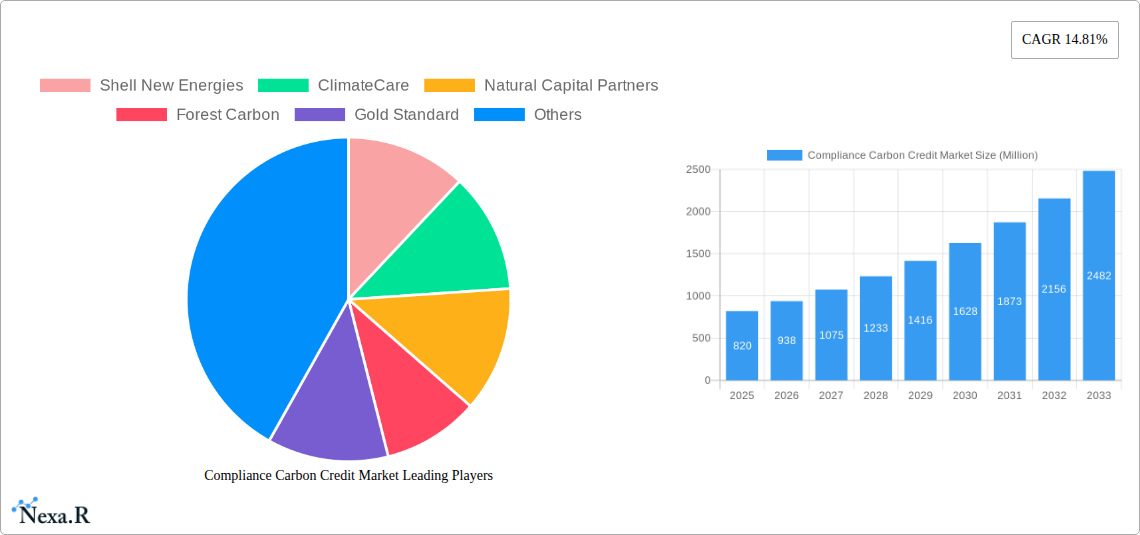
Compliance Carbon Credit Market Market Size (In Million)
Growth within the market is anticipated to be geographically diverse, with North America and Europe maintaining significant market shares due to established regulatory frameworks and strong corporate commitment to sustainability. However, the Asia-Pacific region is projected to witness substantial growth driven by rising industrialization and increasing government initiatives to mitigate climate change. The competitive landscape is characterized by a mix of established players like Shell New Energies and ClimateCare, alongside specialized carbon credit developers and verifiers. Strategic partnerships and collaborations between these companies and businesses seeking to offset their emissions will be vital in driving market expansion. Continued innovation in carbon reduction technologies and project development will be key in fueling future growth, further expanding the available supply of high-quality carbon credits and responding to the escalating demand.
Compliance Carbon Credit Market Company Market Share
Compliance Carbon Credit Market: A Comprehensive Market Report (2019-2033)
This in-depth report provides a comprehensive analysis of the Compliance Carbon Credit Market, encompassing market dynamics, growth trends, regional insights, and key player strategies. With a study period spanning 2019-2033, a base year of 2025, and a forecast period of 2025-2033, this report is an essential resource for industry professionals, investors, and policymakers seeking to understand and navigate this rapidly evolving market. The parent market is the broader carbon market, while the child market focuses specifically on compliance credits. The market is projected to reach xx Million by 2033.
Compliance Carbon Credit Market Market Dynamics & Structure
The Compliance Carbon Credit Market is characterized by a moderately concentrated landscape, with a few dominant players and a growing number of smaller participants. Market concentration is expected to shift in the next decade, with larger players consolidating market share through mergers and acquisitions (M&A). Technological innovation is a key driver, with advancements in monitoring, verification, and trading platforms enhancing market efficiency and transparency. Stringent regulatory frameworks, both nationally and internationally, significantly shape market growth and compliance. The market faces competition from alternative solutions for carbon emission reduction, such as renewable energy investments. End-user demographics are expanding to encompass a wider range of industries, driving market growth.
- Market Concentration: Moderately concentrated, with top 5 players holding approximately xx% market share in 2025.
- Technological Innovation: Blockchain technology, AI-powered monitoring, and improved data analytics are key drivers.
- Regulatory Frameworks: Stringent regulations, such as the EU ETS and California's cap-and-trade program, are crucial drivers of market growth.
- Competitive Substitutes: Renewable energy investments and energy efficiency improvements are competitive substitutes.
- M&A Activity: Significant M&A activity is expected, with an estimated xx deals per year in the forecast period. This contributes to market consolidation.
- End-User Demographics: Expanding beyond traditional energy sectors to include transportation, industry, and agriculture.
Compliance Carbon Credit Market Growth Trends & Insights
The Compliance Carbon Credit Market exhibits robust growth, driven by increasing regulatory pressure, heightened corporate sustainability initiatives, and growing awareness of climate change. The market size witnessed a CAGR of xx% during the historical period (2019-2024) and is projected to grow at a CAGR of xx% during the forecast period (2025-2033), reaching xx Million by 2033. Adoption rates are increasing across various sectors, particularly in response to mandatory carbon reduction targets. Technological disruptions, such as improved verification methodologies, are enhancing market transparency and trust. Consumer behavior is shifting toward increased demand for sustainable products and services, indirectly boosting the market.
Dominant Regions, Countries, or Segments in Compliance Carbon Credit Market
The European Union and North America currently represent the dominant regions in the Compliance Carbon Credit Market, driven by established regulatory frameworks and significant industrial activity. Within the "By Type of Credits" segment, Renewable Energy Projects and Forestry and Land Use currently hold the largest shares. Within "By Sector", the Energy Sector is the most significant consumer of compliance credits. The Western United States and Canada are emerging as major growth regions, with a potential market integration adding further dynamism.
- Key Drivers (EU & North America): Stringent carbon pricing mechanisms, robust regulatory frameworks, and advanced monitoring technologies.
- Growth Potential (Western US & Canada): Potential market linkage between California, Quebec, and Washington will dramatically increase trading volumes.
- Dominant Segments: Renewable Energy Projects and Forestry and Land Use dominate the "By Type of Credits" segment. The Energy Sector dominates the "By Sector" segment.
Compliance Carbon Credit Market Product Landscape
The Compliance Carbon Credit Market offers a range of products, including verified emission reductions (VERs), carbon offsets, and renewable energy certificates (RECs). Product innovation focuses on enhancing transparency, traceability, and standardization to build greater trust and market liquidity. Technological advancements in monitoring, verification, and trading platforms are improving market efficiency and reducing transaction costs. Unique selling propositions increasingly revolve around verified sustainability impact and minimized risk of fraud.
Key Drivers, Barriers & Challenges in Compliance Carbon Credit Market
Key Drivers:
- Increasing regulatory pressure from governments worldwide to reduce carbon emissions.
- Growing corporate social responsibility initiatives and sustainability commitments.
- Technological advancements that improve monitoring and verification processes.
Key Barriers & Challenges:
- Ensuring the environmental integrity and additionality of carbon credits remains a critical challenge. This impacts market trust and adoption.
- Regulatory uncertainty and inconsistencies across different jurisdictions create market fragmentation and complexities.
- The risk of fraud and double counting remains a major concern, negatively impacting market development.
Emerging Opportunities in Compliance Carbon Credit Market
- Expanding into developing economies with growing carbon emission reduction needs.
- Developing innovative carbon credit products, such as nature-based solutions and blue carbon credits.
- Leveraging technology to improve transparency, traceability, and verification of carbon credits.
Growth Accelerators in the Compliance Carbon Credit Market Industry
Technological advancements in monitoring and verification, along with strategic partnerships between market participants and technology providers, will significantly accelerate growth. Expanding into new markets, particularly in developing economies, and the development of innovative carbon credit products targeting specific emission sources will also drive future expansion. Growing corporate commitments to net-zero targets create long-term demand.
Key Players Shaping the Compliance Carbon Credit Market Market
- Shell New Energies
- ClimateCare
- Natural Capital Partners
- Forest Carbon
- Gold Standard
- 3Degrees
- Carbon Trust
- South Pole
- Atmosfair
- 7 Other Companies
- Sustainable Travel International
Notable Milestones in Compliance Carbon Credit Market Sector
- April 2024: Regional efforts in the Western United States and Canada to link carbon markets (California, Quebec, Washington) gain momentum, significantly impacting trading dynamics.
- January 2024: The CFTC issues proposed guidance on listing voluntary carbon credit (VCC) derivatives contracts, paving the way for increased market standardization and liquidity.
In-Depth Compliance Carbon Credit Market Market Outlook
The Compliance Carbon Credit Market is poised for significant growth, driven by increasing regulatory pressure, corporate sustainability targets, and advancements in technology. Strategic partnerships and expansion into new markets will further enhance the market's potential. The development of innovative carbon credit products tailored to specific emission sources will cater to diversified demand and drive long-term market expansion. The market is expected to experience strong growth in the forecast period, creating significant opportunities for market participants.
Compliance Carbon Credit Market Segmentation
-
1. Type of Credits
- 1.1. Renewable Energy Projects
- 1.2. Forestry and Land Use
- 1.3. Energy Efficiency
- 1.4. Industrial Process Improvements
-
2. Sector
- 2.1. Energy Sector
- 2.2. Transportation
- 2.3. Industrial Sector
- 2.4. Agriculture and Forestry
Compliance Carbon Credit Market Segmentation By Geography
-
1. North America
- 1.1. United States
- 1.2. Canada
-
2. Europe
- 2.1. United Kingdom
- 2.2. Germany
- 2.3. France
- 2.4. Rest of Europe
-
3. Asia Pacific
- 3.1. China
- 3.2. Japan
- 3.3. India
- 3.4. South Korea
- 3.5. Rest of Asia Pacific
- 4. Middle East and Africa
- 5. Latin America
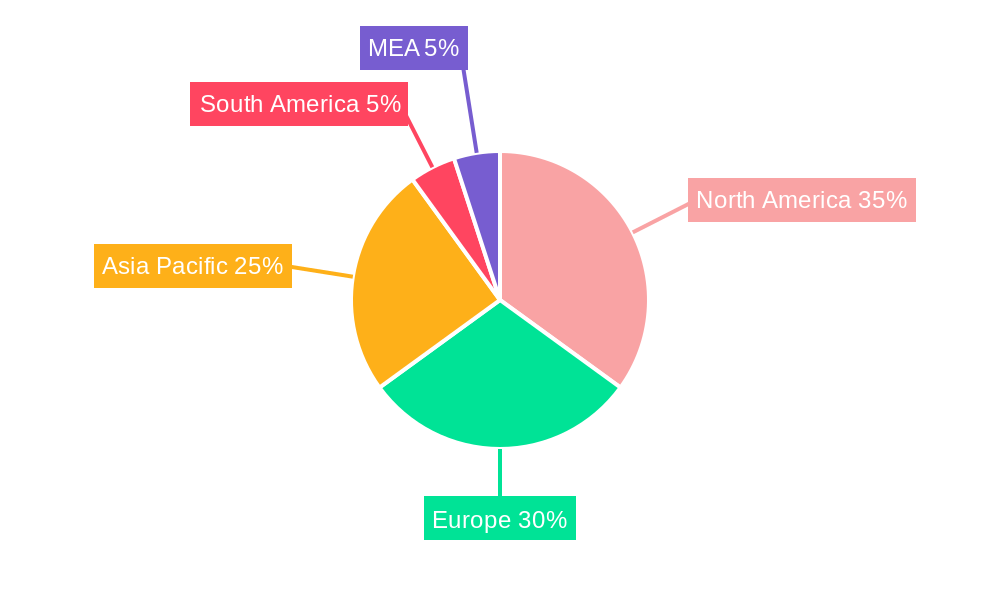
Compliance Carbon Credit Market Regional Market Share
Geographic Coverage of Compliance Carbon Credit Market
Compliance Carbon Credit Market REPORT HIGHLIGHTS
| Aspects | Details |
|---|---|
| Study Period | 2020-2034 |
| Base Year | 2025 |
| Estimated Year | 2026 |
| Forecast Period | 2026-2034 |
| Historical Period | 2020-2025 |
| Growth Rate | CAGR of 14.81% from 2020-2034 |
| Segmentation |
|
Table of Contents
- 1. Introduction
- 1.1. Research Scope
- 1.2. Market Segmentation
- 1.3. Research Objective
- 1.4. Definitions and Assumptions
- 2. Executive Summary
- 2.1. Market Snapshot
- 3. Market Dynamics
- 3.1. Market Drivers
- 3.2. Market Restrains
- 3.3. Market Trends
- 3.4. Market Opportunities
- 4. Market Factor Analysis
- 4.1. Porters Five Forces
- 4.1.1. Bargaining Power of Suppliers
- 4.1.2. Bargaining Power of Buyers
- 4.1.3. Threat of New Entrants
- 4.1.4. Threat of Substitutes
- 4.1.5. Competitive Rivalry
- 4.2. PESTEL analysis
- 4.3. BCG Analysis
- 4.3.1. Stars (High Growth, High Market Share)
- 4.3.2. Cash Cows (Low Growth, High Market Share)
- 4.3.3. Question Mark (High Growth, Low Market Share)
- 4.3.4. Dogs (Low Growth, Low Market Share)
- 4.4. Ansoff Matrix Analysis
- 4.5. Supply Chain Analysis
- 4.6. Regulatory Landscape
- 4.7. Current Market Potential and Opportunity Assessment (TAM–SAM–SOM Framework)
- 4.8. NRP Analyst Note
- 4.1. Porters Five Forces
- 5. Market Analysis, Insights and Forecast 2021-2033
- 5.1. Market Analysis, Insights and Forecast - by Type of Credits
- 5.1.1. Renewable Energy Projects
- 5.1.2. Forestry and Land Use
- 5.1.3. Energy Efficiency
- 5.1.4. Industrial Process Improvements
- 5.2. Market Analysis, Insights and Forecast - by Sector
- 5.2.1. Energy Sector
- 5.2.2. Transportation
- 5.2.3. Industrial Sector
- 5.2.4. Agriculture and Forestry
- 5.3. Market Analysis, Insights and Forecast - by Region
- 5.3.1. North America
- 5.3.2. Europe
- 5.3.3. Asia Pacific
- 5.3.4. Middle East and Africa
- 5.3.5. Latin America
- 5.1. Market Analysis, Insights and Forecast - by Type of Credits
- 6. Global Compliance Carbon Credit Market Analysis, Insights and Forecast, 2021-2033
- 6.1. Market Analysis, Insights and Forecast - by Type of Credits
- 6.1.1. Renewable Energy Projects
- 6.1.2. Forestry and Land Use
- 6.1.3. Energy Efficiency
- 6.1.4. Industrial Process Improvements
- 6.2. Market Analysis, Insights and Forecast - by Sector
- 6.2.1. Energy Sector
- 6.2.2. Transportation
- 6.2.3. Industrial Sector
- 6.2.4. Agriculture and Forestry
- 6.1. Market Analysis, Insights and Forecast - by Type of Credits
- 7. North America Compliance Carbon Credit Market Analysis, Insights and Forecast, 2020-2032
- 7.1. Market Analysis, Insights and Forecast - by Type of Credits
- 7.1.1. Renewable Energy Projects
- 7.1.2. Forestry and Land Use
- 7.1.3. Energy Efficiency
- 7.1.4. Industrial Process Improvements
- 7.2. Market Analysis, Insights and Forecast - by Sector
- 7.2.1. Energy Sector
- 7.2.2. Transportation
- 7.2.3. Industrial Sector
- 7.2.4. Agriculture and Forestry
- 7.1. Market Analysis, Insights and Forecast - by Type of Credits
- 8. Europe Compliance Carbon Credit Market Analysis, Insights and Forecast, 2020-2032
- 8.1. Market Analysis, Insights and Forecast - by Type of Credits
- 8.1.1. Renewable Energy Projects
- 8.1.2. Forestry and Land Use
- 8.1.3. Energy Efficiency
- 8.1.4. Industrial Process Improvements
- 8.2. Market Analysis, Insights and Forecast - by Sector
- 8.2.1. Energy Sector
- 8.2.2. Transportation
- 8.2.3. Industrial Sector
- 8.2.4. Agriculture and Forestry
- 8.1. Market Analysis, Insights and Forecast - by Type of Credits
- 9. Asia Pacific Compliance Carbon Credit Market Analysis, Insights and Forecast, 2020-2032
- 9.1. Market Analysis, Insights and Forecast - by Type of Credits
- 9.1.1. Renewable Energy Projects
- 9.1.2. Forestry and Land Use
- 9.1.3. Energy Efficiency
- 9.1.4. Industrial Process Improvements
- 9.2. Market Analysis, Insights and Forecast - by Sector
- 9.2.1. Energy Sector
- 9.2.2. Transportation
- 9.2.3. Industrial Sector
- 9.2.4. Agriculture and Forestry
- 9.1. Market Analysis, Insights and Forecast - by Type of Credits
- 10. Middle East and Africa Compliance Carbon Credit Market Analysis, Insights and Forecast, 2020-2032
- 10.1. Market Analysis, Insights and Forecast - by Type of Credits
- 10.1.1. Renewable Energy Projects
- 10.1.2. Forestry and Land Use
- 10.1.3. Energy Efficiency
- 10.1.4. Industrial Process Improvements
- 10.2. Market Analysis, Insights and Forecast - by Sector
- 10.2.1. Energy Sector
- 10.2.2. Transportation
- 10.2.3. Industrial Sector
- 10.2.4. Agriculture and Forestry
- 10.1. Market Analysis, Insights and Forecast - by Type of Credits
- 11. Latin America Compliance Carbon Credit Market Analysis, Insights and Forecast, 2020-2032
- 11.1. Market Analysis, Insights and Forecast - by Type of Credits
- 11.1.1. Renewable Energy Projects
- 11.1.2. Forestry and Land Use
- 11.1.3. Energy Efficiency
- 11.1.4. Industrial Process Improvements
- 11.2. Market Analysis, Insights and Forecast - by Sector
- 11.2.1. Energy Sector
- 11.2.2. Transportation
- 11.2.3. Industrial Sector
- 11.2.4. Agriculture and Forestry
- 11.1. Market Analysis, Insights and Forecast - by Type of Credits
- 12. Competitive Analysis
- 12.1. Company Profiles
- 12.1.1 Shell New Energies
- 12.1.1.1. Company Overview
- 12.1.1.2. Products
- 12.1.1.3. Company Financials
- 12.1.1.4. SWOT Analysis
- 12.1.2 ClimateCare
- 12.1.2.1. Company Overview
- 12.1.2.2. Products
- 12.1.2.3. Company Financials
- 12.1.2.4. SWOT Analysis
- 12.1.3 Natural Capital Partners
- 12.1.3.1. Company Overview
- 12.1.3.2. Products
- 12.1.3.3. Company Financials
- 12.1.3.4. SWOT Analysis
- 12.1.4 Forest Carbon
- 12.1.4.1. Company Overview
- 12.1.4.2. Products
- 12.1.4.3. Company Financials
- 12.1.4.4. SWOT Analysis
- 12.1.5 Gold Standard
- 12.1.5.1. Company Overview
- 12.1.5.2. Products
- 12.1.5.3. Company Financials
- 12.1.5.4. SWOT Analysis
- 12.1.6 3Degrees
- 12.1.6.1. Company Overview
- 12.1.6.2. Products
- 12.1.6.3. Company Financials
- 12.1.6.4. SWOT Analysis
- 12.1.7 Carbon Trust
- 12.1.7.1. Company Overview
- 12.1.7.2. Products
- 12.1.7.3. Company Financials
- 12.1.7.4. SWOT Analysis
- 12.1.8 South Pole
- 12.1.8.1. Company Overview
- 12.1.8.2. Products
- 12.1.8.3. Company Financials
- 12.1.8.4. SWOT Analysis
- 12.1.9 Atmosfair**List Not Exhaustive 7 3 Other Companie
- 12.1.9.1. Company Overview
- 12.1.9.2. Products
- 12.1.9.3. Company Financials
- 12.1.9.4. SWOT Analysis
- 12.1.10 Sustainable Travel International
- 12.1.10.1. Company Overview
- 12.1.10.2. Products
- 12.1.10.3. Company Financials
- 12.1.10.4. SWOT Analysis
- 12.1.1 Shell New Energies
- 12.2. Market Entropy
- 12.2.1 Company's Key Areas Served
- 12.2.2 Recent Developments
- 12.3. Company Market Share Analysis 2025
- 12.3.1 Top 5 Companies Market Share Analysis
- 12.3.2 Top 3 Companies Market Share Analysis
- 12.4. List of Potential Customers
- 13. Research Methodology
List of Figures
- Figure 1: Global Compliance Carbon Credit Market Revenue Breakdown (Million, %) by Region 2025 & 2033
- Figure 2: North America Compliance Carbon Credit Market Revenue (Million), by Type of Credits 2025 & 2033
- Figure 3: North America Compliance Carbon Credit Market Revenue Share (%), by Type of Credits 2025 & 2033
- Figure 4: North America Compliance Carbon Credit Market Revenue (Million), by Sector 2025 & 2033
- Figure 5: North America Compliance Carbon Credit Market Revenue Share (%), by Sector 2025 & 2033
- Figure 6: North America Compliance Carbon Credit Market Revenue (Million), by Country 2025 & 2033
- Figure 7: North America Compliance Carbon Credit Market Revenue Share (%), by Country 2025 & 2033
- Figure 8: Europe Compliance Carbon Credit Market Revenue (Million), by Type of Credits 2025 & 2033
- Figure 9: Europe Compliance Carbon Credit Market Revenue Share (%), by Type of Credits 2025 & 2033
- Figure 10: Europe Compliance Carbon Credit Market Revenue (Million), by Sector 2025 & 2033
- Figure 11: Europe Compliance Carbon Credit Market Revenue Share (%), by Sector 2025 & 2033
- Figure 12: Europe Compliance Carbon Credit Market Revenue (Million), by Country 2025 & 2033
- Figure 13: Europe Compliance Carbon Credit Market Revenue Share (%), by Country 2025 & 2033
- Figure 14: Asia Pacific Compliance Carbon Credit Market Revenue (Million), by Type of Credits 2025 & 2033
- Figure 15: Asia Pacific Compliance Carbon Credit Market Revenue Share (%), by Type of Credits 2025 & 2033
- Figure 16: Asia Pacific Compliance Carbon Credit Market Revenue (Million), by Sector 2025 & 2033
- Figure 17: Asia Pacific Compliance Carbon Credit Market Revenue Share (%), by Sector 2025 & 2033
- Figure 18: Asia Pacific Compliance Carbon Credit Market Revenue (Million), by Country 2025 & 2033
- Figure 19: Asia Pacific Compliance Carbon Credit Market Revenue Share (%), by Country 2025 & 2033
- Figure 20: Middle East and Africa Compliance Carbon Credit Market Revenue (Million), by Type of Credits 2025 & 2033
- Figure 21: Middle East and Africa Compliance Carbon Credit Market Revenue Share (%), by Type of Credits 2025 & 2033
- Figure 22: Middle East and Africa Compliance Carbon Credit Market Revenue (Million), by Sector 2025 & 2033
- Figure 23: Middle East and Africa Compliance Carbon Credit Market Revenue Share (%), by Sector 2025 & 2033
- Figure 24: Middle East and Africa Compliance Carbon Credit Market Revenue (Million), by Country 2025 & 2033
- Figure 25: Middle East and Africa Compliance Carbon Credit Market Revenue Share (%), by Country 2025 & 2033
- Figure 26: Latin America Compliance Carbon Credit Market Revenue (Million), by Type of Credits 2025 & 2033
- Figure 27: Latin America Compliance Carbon Credit Market Revenue Share (%), by Type of Credits 2025 & 2033
- Figure 28: Latin America Compliance Carbon Credit Market Revenue (Million), by Sector 2025 & 2033
- Figure 29: Latin America Compliance Carbon Credit Market Revenue Share (%), by Sector 2025 & 2033
- Figure 30: Latin America Compliance Carbon Credit Market Revenue (Million), by Country 2025 & 2033
- Figure 31: Latin America Compliance Carbon Credit Market Revenue Share (%), by Country 2025 & 2033
List of Tables
- Table 1: Global Compliance Carbon Credit Market Revenue Million Forecast, by Type of Credits 2020 & 2033
- Table 2: Global Compliance Carbon Credit Market Revenue Million Forecast, by Sector 2020 & 2033
- Table 3: Global Compliance Carbon Credit Market Revenue Million Forecast, by Region 2020 & 2033
- Table 4: Global Compliance Carbon Credit Market Revenue Million Forecast, by Type of Credits 2020 & 2033
- Table 5: Global Compliance Carbon Credit Market Revenue Million Forecast, by Sector 2020 & 2033
- Table 6: Global Compliance Carbon Credit Market Revenue Million Forecast, by Country 2020 & 2033
- Table 7: United States Compliance Carbon Credit Market Revenue (Million) Forecast, by Application 2020 & 2033
- Table 8: Canada Compliance Carbon Credit Market Revenue (Million) Forecast, by Application 2020 & 2033
- Table 9: Global Compliance Carbon Credit Market Revenue Million Forecast, by Type of Credits 2020 & 2033
- Table 10: Global Compliance Carbon Credit Market Revenue Million Forecast, by Sector 2020 & 2033
- Table 11: Global Compliance Carbon Credit Market Revenue Million Forecast, by Country 2020 & 2033
- Table 12: United Kingdom Compliance Carbon Credit Market Revenue (Million) Forecast, by Application 2020 & 2033
- Table 13: Germany Compliance Carbon Credit Market Revenue (Million) Forecast, by Application 2020 & 2033
- Table 14: France Compliance Carbon Credit Market Revenue (Million) Forecast, by Application 2020 & 2033
- Table 15: Rest of Europe Compliance Carbon Credit Market Revenue (Million) Forecast, by Application 2020 & 2033
- Table 16: Global Compliance Carbon Credit Market Revenue Million Forecast, by Type of Credits 2020 & 2033
- Table 17: Global Compliance Carbon Credit Market Revenue Million Forecast, by Sector 2020 & 2033
- Table 18: Global Compliance Carbon Credit Market Revenue Million Forecast, by Country 2020 & 2033
- Table 19: China Compliance Carbon Credit Market Revenue (Million) Forecast, by Application 2020 & 2033
- Table 20: Japan Compliance Carbon Credit Market Revenue (Million) Forecast, by Application 2020 & 2033
- Table 21: India Compliance Carbon Credit Market Revenue (Million) Forecast, by Application 2020 & 2033
- Table 22: South Korea Compliance Carbon Credit Market Revenue (Million) Forecast, by Application 2020 & 2033
- Table 23: Rest of Asia Pacific Compliance Carbon Credit Market Revenue (Million) Forecast, by Application 2020 & 2033
- Table 24: Global Compliance Carbon Credit Market Revenue Million Forecast, by Type of Credits 2020 & 2033
- Table 25: Global Compliance Carbon Credit Market Revenue Million Forecast, by Sector 2020 & 2033
- Table 26: Global Compliance Carbon Credit Market Revenue Million Forecast, by Country 2020 & 2033
- Table 27: Global Compliance Carbon Credit Market Revenue Million Forecast, by Type of Credits 2020 & 2033
- Table 28: Global Compliance Carbon Credit Market Revenue Million Forecast, by Sector 2020 & 2033
- Table 29: Global Compliance Carbon Credit Market Revenue Million Forecast, by Country 2020 & 2033
Frequently Asked Questions
1. What is the projected Compound Annual Growth Rate (CAGR) of the Compliance Carbon Credit Market?
The projected CAGR is approximately 14.81%.
2. Which companies are prominent players in the Compliance Carbon Credit Market?
Key companies in the market include Shell New Energies, ClimateCare, Natural Capital Partners, Forest Carbon, Gold Standard, 3Degrees, Carbon Trust, South Pole, Atmosfair**List Not Exhaustive 7 3 Other Companie, Sustainable Travel International.
3. What are the main segments of the Compliance Carbon Credit Market?
The market segments include Type of Credits, Sector.
4. Can you provide details about the market size?
The market size is estimated to be USD 0.82 Million as of 2022.
5. What are some drivers contributing to market growth?
Regulatory Mandates and Policies; Growing Corporate Sustainability Initiatives.
6. What are the notable trends driving market growth?
Charting the Course of Carbon Pricing: UK-ETS Post-Brexit.
7. Are there any restraints impacting market growth?
Market Complexity and Uncertainty.
8. Can you provide examples of recent developments in the market?
April 2024: Regional efforts in the Western United States and Canada are gaining momentum as the urgency of combating climate change increases. Plans to link their carbon markets are being drawn up in California, Quebec, and Washington, which could significantly affect trading dynamics. The three authorities intend to work together to create a more extensive carbon credit market as soon as their proposed alliance takes effect.
9. What pricing options are available for accessing the report?
Pricing options include single-user, multi-user, and enterprise licenses priced at USD 4750, USD 5250, and USD 8750 respectively.
10. Is the market size provided in terms of value or volume?
The market size is provided in terms of value, measured in Million.
11. Are there any specific market keywords associated with the report?
Yes, the market keyword associated with the report is "Compliance Carbon Credit Market," which aids in identifying and referencing the specific market segment covered.
12. How do I determine which pricing option suits my needs best?
The pricing options vary based on user requirements and access needs. Individual users may opt for single-user licenses, while businesses requiring broader access may choose multi-user or enterprise licenses for cost-effective access to the report.
13. Are there any additional resources or data provided in the Compliance Carbon Credit Market report?
While the report offers comprehensive insights, it's advisable to review the specific contents or supplementary materials provided to ascertain if additional resources or data are available.
14. How can I stay updated on further developments or reports in the Compliance Carbon Credit Market?
To stay informed about further developments, trends, and reports in the Compliance Carbon Credit Market, consider subscribing to industry newsletters, following relevant companies and organizations, or regularly checking reputable industry news sources and publications.
Methodology
Step 1 - Identification of Relevant Samples Size from Population Database


Step 2 - Approaches for Defining Global Market Size (Value, Volume* & Price*)

Note*: In applicable scenarios
Step 3 - Data Sources
Primary Research
- Web Analytics
- Survey Reports
- Research Institute
- Latest Research Reports
- Opinion Leaders
Secondary Research
- Annual Reports
- White Paper
- Latest Press Release
- Industry Association
- Paid Database
- Investor Presentations

Step 4 - Data Triangulation
Involves using different sources of information in order to increase the validity of a study
These sources are likely to be stakeholders in a program - participants, other researchers, program staff, other community members, and so on.
Then we put all data in single framework & apply various statistical tools to find out the dynamic on the market.
During the analysis stage, feedback from the stakeholder groups would be compared to determine areas of agreement as well as areas of divergence