

Key Insights
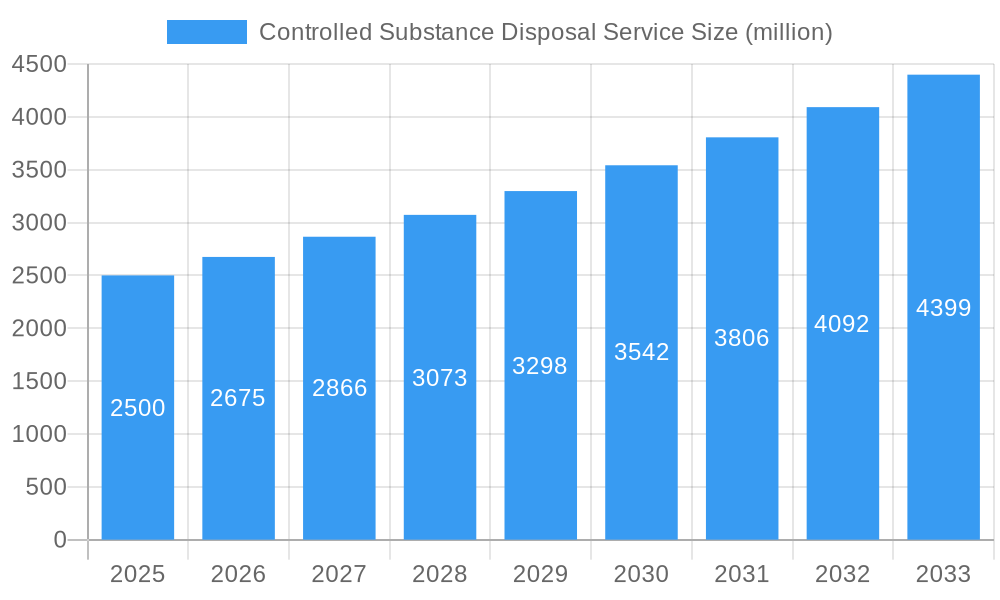
The Controlled Substance Disposal Service market is projected for significant expansion, propelled by increasing regulatory oversight, escalating environmental consciousness, and the growing challenge of opioid addiction. Stringent mandates for secure controlled substance disposal are a primary growth driver, ensuring the prevention of diversion and environmental harm. Healthcare facilities, including hospitals, pharmacies, and clinics, are increasingly relying on specialized service providers to manage complex logistical and compliance demands, a trend that is substantially bolstering market growth. Advances in technology, such as secure collection systems and sophisticated tracking mechanisms, are also contributing to improved industry efficiency and security. The market is segmented by service type (on-site, off-site), end-user (hospitals, pharmacies, clinics, research facilities), and geography. The market size is estimated to reach $2.5 billion by 2025, exhibiting a Compound Annual Growth Rate (CAGR) of 7% from 2025 to 2033.
Controlled Substance Disposal Service Market Size (In Billion)
The competitive arena is characterized by fragmentation, featuring a mix of major global entities and localized providers contending for market dominance. Leading companies are prioritizing strategic mergers and acquisitions, service portfolio enhancements, and technological advancements to solidify their market positions. Key challenges include volatility in raw material costs and the dynamic nature of regulatory frameworks. Nevertheless, the long-term outlook remains optimistic, supported by sustained growth in the healthcare sector, heightened awareness of environmental sustainability, and the persistent demand for secure and compliant controlled substance disposal. The increasing adoption of innovative disposal technologies and advanced data management solutions is expected to further accelerate market expansion. A heightened focus on patient safety and the proactive prevention of drug diversion will continue to fuel consistent market growth.
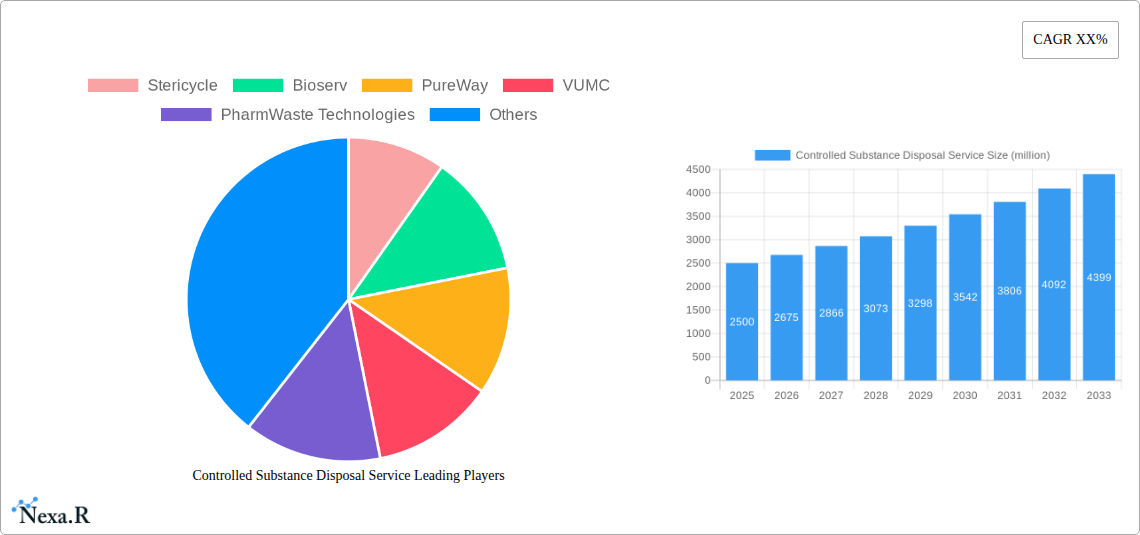
Controlled Substance Disposal Service Company Market Share
Controlled Substance Disposal Service Market Report: 2019-2033
This comprehensive report provides a detailed analysis of the Controlled Substance Disposal Service market, encompassing market dynamics, growth trends, regional insights, competitive landscape, and future outlook. The study period covers 2019-2033, with 2025 as the base and estimated year. This report is crucial for pharmaceutical companies, healthcare providers, waste management firms, regulatory bodies, and investors seeking to understand and capitalize on this rapidly evolving market. The market is projected to reach xx million units by 2033, exhibiting a CAGR of xx% during the forecast period (2025-2033).
Controlled Substance Disposal Service Market Dynamics & Structure
The controlled substance disposal service market is characterized by a moderately concentrated landscape with key players like Stericycle, Waste Management, Inc., and Sharps Compliance Inc. holding significant market share. The market is driven by stringent regulatory frameworks mandating safe disposal practices, increasing awareness of environmental concerns, and technological advancements in secure disposal methods. However, factors such as high disposal costs and complexities in the regulatory landscape present challenges. Mergers and acquisitions (M&A) activity is moderate, with a projected xx deals per year during the forecast period, mainly driven by market consolidation and expansion into new geographical areas.
- Market Concentration: Moderately concentrated, with the top 5 players holding approximately xx% market share in 2025.
- Technological Innovation: Focus on automation, secure tracking, and environmentally friendly disposal methods. Innovation barriers include high initial investment costs and regulatory compliance requirements.
- Regulatory Frameworks: Stringent regulations globally are driving market growth but also pose compliance challenges.
- Competitive Product Substitutes: Limited direct substitutes exist, focusing instead on optimizing existing services for efficiency and safety.
- End-User Demographics: Primarily hospitals, pharmacies, clinics, and research institutions.
- M&A Trends: Consolidation is expected with larger players acquiring smaller companies to expand their geographic reach and service offerings.
Controlled Substance Disposal Service Growth Trends & Insights
The controlled substance disposal service market experienced significant growth during the historical period (2019-2024), driven by increased regulatory scrutiny and heightened environmental awareness. This trend is expected to continue throughout the forecast period (2025-2033). The market size is projected to expand from xx million units in 2025 to xx million units in 2033. Adoption rates are increasing steadily, particularly among smaller healthcare facilities that are increasingly prioritizing compliance and risk mitigation. Technological disruptions, such as the introduction of automated disposal systems and advanced tracking technologies, are further fueling market expansion. Changes in consumer behavior, specifically heightened awareness of the environmental and security implications of improper disposal, also contribute significantly to growth. The market exhibits a steady growth trajectory, influenced by factors such as the increasing volume of controlled substances handled by healthcare facilities and the rising demand for secure and environmentally responsible disposal methods.
Dominant Regions, Countries, or Segments in Controlled Substance Disposal Service
North America (specifically the US) currently dominates the controlled substance disposal service market, accounting for approximately xx% of the global market share in 2025, driven by stringent regulatory environments, high healthcare expenditure, and a significant presence of major market players. Europe follows as a key regional market, exhibiting steady growth due to increased regulatory enforcement and growing environmental concerns.
- Key Drivers in North America: Stringent regulations (DEA, FDA), high healthcare expenditure, and well-established waste management infrastructure.
- Growth Potential in Europe: Increasing regulatory pressure for environmentally friendly disposal and a rising number of healthcare facilities.
- Asia-Pacific: Growth is expected due to increasing healthcare investment and rising awareness of safe disposal practices.
Controlled Substance Disposal Service Product Landscape
The market offers a range of services, including on-site collection, off-site processing, and secure transportation. Innovations focus on enhanced security features such as GPS tracking, tamper-evident containers, and advanced incineration technologies. Key selling points emphasize secure chain of custody, compliance with all relevant regulations, and environmentally responsible disposal methods.
Key Drivers, Barriers & Challenges in Controlled Substance Disposal Service
Key Drivers:
- Increasing regulatory scrutiny and enforcement.
- Growing environmental awareness and the need for sustainable disposal practices.
- Technological advancements in secure disposal methods.
Key Challenges:
- High disposal costs, posing a financial burden for smaller healthcare facilities.
- Complex regulatory compliance requirements, creating hurdles for market entry and operations.
- Potential for illicit diversion of controlled substances throughout the disposal process, requiring rigorous security measures. This is estimated to cost the industry approximately xx million units annually in lost revenue and increased security measures.
Emerging Opportunities in Controlled Substance Disposal Service
- Expansion into emerging markets with growing healthcare sectors and increasing awareness of safe disposal needs.
- Development of innovative technologies, such as on-site destruction units, to further improve security and efficiency.
- Focus on offering comprehensive compliance consulting and training services to assist healthcare facilities in meeting regulatory requirements.
Growth Accelerators in the Controlled Substance Disposal Service Industry
Strategic partnerships between waste management companies and healthcare providers can streamline the disposal process, lowering costs and improving efficiency. Technological advancements, including automated systems and advanced tracking technologies, will further enhance security and sustainability. Expansion into underserved markets and diversification of service offerings will unlock significant growth potential.
Key Players Shaping the Controlled Substance Disposal Service Market
- Stericycle
- Bioserv
- PureWay
- VUMC
- PharmWaste Technologies
- Rx Destroyer
- Sharpsmart
- Clean Harbors
- Clean Earth
- Covanta Holding Corporation
- US Bio-Clean
- Daniels
- San Diego Medical Waste Services
- Sharps Compliance Inc.
- Waste Management, Inc.
Notable Milestones in Controlled Substance Disposal Service Sector
- 2020: Increased regulatory scrutiny following several high-profile incidents of pharmaceutical theft.
- 2021: Introduction of advanced tracking technologies by several leading companies.
- 2022: Significant M&A activity, leading to market consolidation.
- 2023: Launch of several environmentally friendly disposal solutions.
In-Depth Controlled Substance Disposal Service Market Outlook
The controlled substance disposal service market is poised for robust growth, driven by sustained regulatory pressure, technological advancements, and increasing environmental awareness. Strategic investments in automation, security enhancements, and environmentally conscious solutions will be crucial for success. Expansion into new geographic markets and the development of integrated compliance services will create significant opportunities for market players. The long-term outlook is positive, reflecting the growing need for secure and responsible disposal of controlled substances.
Controlled Substance Disposal Service Segmentation
-
1. Application
- 1.1. Hospital
- 1.2. Airport
- 1.3. Others
-
2. Types
- 2.1. Incineration Treatment
- 2.2. Container Management
Controlled Substance Disposal Service Segmentation By Geography
-
1. North America
- 1.1. United States
- 1.2. Canada
- 1.3. Mexico
-
2. South America
- 2.1. Brazil
- 2.2. Argentina
- 2.3. Rest of South America
-
3. Europe
- 3.1. United Kingdom
- 3.2. Germany
- 3.3. France
- 3.4. Italy
- 3.5. Spain
- 3.6. Russia
- 3.7. Benelux
- 3.8. Nordics
- 3.9. Rest of Europe
-
4. Middle East & Africa
- 4.1. Turkey
- 4.2. Israel
- 4.3. GCC
- 4.4. North Africa
- 4.5. South Africa
- 4.6. Rest of Middle East & Africa
-
5. Asia Pacific
- 5.1. China
- 5.2. India
- 5.3. Japan
- 5.4. South Korea
- 5.5. ASEAN
- 5.6. Oceania
- 5.7. Rest of Asia Pacific
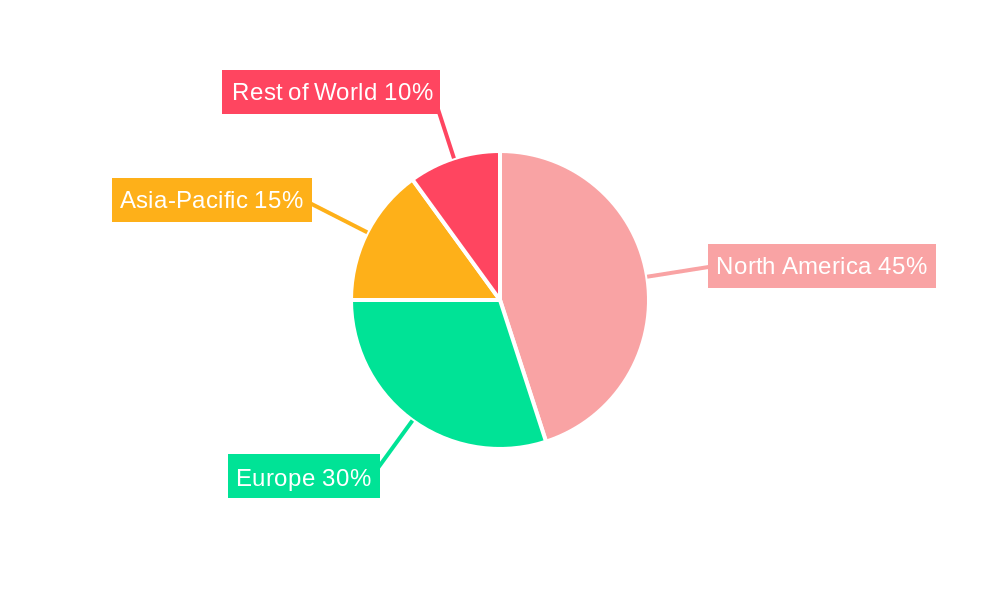
Controlled Substance Disposal Service Regional Market Share
Geographic Coverage of Controlled Substance Disposal Service
Controlled Substance Disposal Service REPORT HIGHLIGHTS
| Aspects | Details |
|---|---|
| Study Period | 2020-2034 |
| Base Year | 2025 |
| Estimated Year | 2026 |
| Forecast Period | 2026-2034 |
| Historical Period | 2020-2025 |
| Growth Rate | CAGR of 7% from 2020-2034 |
| Segmentation |
|
Table of Contents
- 1. Introduction
- 1.1. Research Scope
- 1.2. Market Segmentation
- 1.3. Research Methodology
- 1.4. Definitions and Assumptions
- 2. Executive Summary
- 2.1. Introduction
- 3. Market Dynamics
- 3.1. Introduction
- 3.2. Market Drivers
- 3.3. Market Restrains
- 3.4. Market Trends
- 4. Market Factor Analysis
- 4.1. Porters Five Forces
- 4.2. Supply/Value Chain
- 4.3. PESTEL analysis
- 4.4. Market Entropy
- 4.5. Patent/Trademark Analysis
- 5. Global Controlled Substance Disposal Service Analysis, Insights and Forecast, 2020-2032
- 5.1. Market Analysis, Insights and Forecast - by Application
- 5.1.1. Hospital
- 5.1.2. Airport
- 5.1.3. Others
- 5.2. Market Analysis, Insights and Forecast - by Types
- 5.2.1. Incineration Treatment
- 5.2.2. Container Management
- 5.3. Market Analysis, Insights and Forecast - by Region
- 5.3.1. North America
- 5.3.2. South America
- 5.3.3. Europe
- 5.3.4. Middle East & Africa
- 5.3.5. Asia Pacific
- 5.1. Market Analysis, Insights and Forecast - by Application
- 6. North America Controlled Substance Disposal Service Analysis, Insights and Forecast, 2020-2032
- 6.1. Market Analysis, Insights and Forecast - by Application
- 6.1.1. Hospital
- 6.1.2. Airport
- 6.1.3. Others
- 6.2. Market Analysis, Insights and Forecast - by Types
- 6.2.1. Incineration Treatment
- 6.2.2. Container Management
- 6.1. Market Analysis, Insights and Forecast - by Application
- 7. South America Controlled Substance Disposal Service Analysis, Insights and Forecast, 2020-2032
- 7.1. Market Analysis, Insights and Forecast - by Application
- 7.1.1. Hospital
- 7.1.2. Airport
- 7.1.3. Others
- 7.2. Market Analysis, Insights and Forecast - by Types
- 7.2.1. Incineration Treatment
- 7.2.2. Container Management
- 7.1. Market Analysis, Insights and Forecast - by Application
- 8. Europe Controlled Substance Disposal Service Analysis, Insights and Forecast, 2020-2032
- 8.1. Market Analysis, Insights and Forecast - by Application
- 8.1.1. Hospital
- 8.1.2. Airport
- 8.1.3. Others
- 8.2. Market Analysis, Insights and Forecast - by Types
- 8.2.1. Incineration Treatment
- 8.2.2. Container Management
- 8.1. Market Analysis, Insights and Forecast - by Application
- 9. Middle East & Africa Controlled Substance Disposal Service Analysis, Insights and Forecast, 2020-2032
- 9.1. Market Analysis, Insights and Forecast - by Application
- 9.1.1. Hospital
- 9.1.2. Airport
- 9.1.3. Others
- 9.2. Market Analysis, Insights and Forecast - by Types
- 9.2.1. Incineration Treatment
- 9.2.2. Container Management
- 9.1. Market Analysis, Insights and Forecast - by Application
- 10. Asia Pacific Controlled Substance Disposal Service Analysis, Insights and Forecast, 2020-2032
- 10.1. Market Analysis, Insights and Forecast - by Application
- 10.1.1. Hospital
- 10.1.2. Airport
- 10.1.3. Others
- 10.2. Market Analysis, Insights and Forecast - by Types
- 10.2.1. Incineration Treatment
- 10.2.2. Container Management
- 10.1. Market Analysis, Insights and Forecast - by Application
- 11. Competitive Analysis
- 11.1. Global Market Share Analysis 2025
- 11.2. Company Profiles
- 11.2.1 Stericycle
- 11.2.1.1. Overview
- 11.2.1.2. Products
- 11.2.1.3. SWOT Analysis
- 11.2.1.4. Recent Developments
- 11.2.1.5. Financials (Based on Availability)
- 11.2.2 Bioserv
- 11.2.2.1. Overview
- 11.2.2.2. Products
- 11.2.2.3. SWOT Analysis
- 11.2.2.4. Recent Developments
- 11.2.2.5. Financials (Based on Availability)
- 11.2.3 PureWay
- 11.2.3.1. Overview
- 11.2.3.2. Products
- 11.2.3.3. SWOT Analysis
- 11.2.3.4. Recent Developments
- 11.2.3.5. Financials (Based on Availability)
- 11.2.4 VUMC
- 11.2.4.1. Overview
- 11.2.4.2. Products
- 11.2.4.3. SWOT Analysis
- 11.2.4.4. Recent Developments
- 11.2.4.5. Financials (Based on Availability)
- 11.2.5 PharmWaste Technologies
- 11.2.5.1. Overview
- 11.2.5.2. Products
- 11.2.5.3. SWOT Analysis
- 11.2.5.4. Recent Developments
- 11.2.5.5. Financials (Based on Availability)
- 11.2.6 Rx Destroyer
- 11.2.6.1. Overview
- 11.2.6.2. Products
- 11.2.6.3. SWOT Analysis
- 11.2.6.4. Recent Developments
- 11.2.6.5. Financials (Based on Availability)
- 11.2.7 Sharpsmart
- 11.2.7.1. Overview
- 11.2.7.2. Products
- 11.2.7.3. SWOT Analysis
- 11.2.7.4. Recent Developments
- 11.2.7.5. Financials (Based on Availability)
- 11.2.8 Clean Harbors
- 11.2.8.1. Overview
- 11.2.8.2. Products
- 11.2.8.3. SWOT Analysis
- 11.2.8.4. Recent Developments
- 11.2.8.5. Financials (Based on Availability)
- 11.2.9 Clean Earth
- 11.2.9.1. Overview
- 11.2.9.2. Products
- 11.2.9.3. SWOT Analysis
- 11.2.9.4. Recent Developments
- 11.2.9.5. Financials (Based on Availability)
- 11.2.10 Covanta Holding Corporation
- 11.2.10.1. Overview
- 11.2.10.2. Products
- 11.2.10.3. SWOT Analysis
- 11.2.10.4. Recent Developments
- 11.2.10.5. Financials (Based on Availability)
- 11.2.11 US Bio-Clean
- 11.2.11.1. Overview
- 11.2.11.2. Products
- 11.2.11.3. SWOT Analysis
- 11.2.11.4. Recent Developments
- 11.2.11.5. Financials (Based on Availability)
- 11.2.12 Daniels
- 11.2.12.1. Overview
- 11.2.12.2. Products
- 11.2.12.3. SWOT Analysis
- 11.2.12.4. Recent Developments
- 11.2.12.5. Financials (Based on Availability)
- 11.2.13 San Diego Medical Waste Services
- 11.2.13.1. Overview
- 11.2.13.2. Products
- 11.2.13.3. SWOT Analysis
- 11.2.13.4. Recent Developments
- 11.2.13.5. Financials (Based on Availability)
- 11.2.14 Sharps Compliance Inc.
- 11.2.14.1. Overview
- 11.2.14.2. Products
- 11.2.14.3. SWOT Analysis
- 11.2.14.4. Recent Developments
- 11.2.14.5. Financials (Based on Availability)
- 11.2.15 Waste Management
- 11.2.15.1. Overview
- 11.2.15.2. Products
- 11.2.15.3. SWOT Analysis
- 11.2.15.4. Recent Developments
- 11.2.15.5. Financials (Based on Availability)
- 11.2.16 Inc.
- 11.2.16.1. Overview
- 11.2.16.2. Products
- 11.2.16.3. SWOT Analysis
- 11.2.16.4. Recent Developments
- 11.2.16.5. Financials (Based on Availability)
- 11.2.1 Stericycle
List of Figures
- Figure 1: Global Controlled Substance Disposal Service Revenue Breakdown (billion, %) by Region 2025 & 2033
- Figure 2: North America Controlled Substance Disposal Service Revenue (billion), by Application 2025 & 2033
- Figure 3: North America Controlled Substance Disposal Service Revenue Share (%), by Application 2025 & 2033
- Figure 4: North America Controlled Substance Disposal Service Revenue (billion), by Types 2025 & 2033
- Figure 5: North America Controlled Substance Disposal Service Revenue Share (%), by Types 2025 & 2033
- Figure 6: North America Controlled Substance Disposal Service Revenue (billion), by Country 2025 & 2033
- Figure 7: North America Controlled Substance Disposal Service Revenue Share (%), by Country 2025 & 2033
- Figure 8: South America Controlled Substance Disposal Service Revenue (billion), by Application 2025 & 2033
- Figure 9: South America Controlled Substance Disposal Service Revenue Share (%), by Application 2025 & 2033
- Figure 10: South America Controlled Substance Disposal Service Revenue (billion), by Types 2025 & 2033
- Figure 11: South America Controlled Substance Disposal Service Revenue Share (%), by Types 2025 & 2033
- Figure 12: South America Controlled Substance Disposal Service Revenue (billion), by Country 2025 & 2033
- Figure 13: South America Controlled Substance Disposal Service Revenue Share (%), by Country 2025 & 2033
- Figure 14: Europe Controlled Substance Disposal Service Revenue (billion), by Application 2025 & 2033
- Figure 15: Europe Controlled Substance Disposal Service Revenue Share (%), by Application 2025 & 2033
- Figure 16: Europe Controlled Substance Disposal Service Revenue (billion), by Types 2025 & 2033
- Figure 17: Europe Controlled Substance Disposal Service Revenue Share (%), by Types 2025 & 2033
- Figure 18: Europe Controlled Substance Disposal Service Revenue (billion), by Country 2025 & 2033
- Figure 19: Europe Controlled Substance Disposal Service Revenue Share (%), by Country 2025 & 2033
- Figure 20: Middle East & Africa Controlled Substance Disposal Service Revenue (billion), by Application 2025 & 2033
- Figure 21: Middle East & Africa Controlled Substance Disposal Service Revenue Share (%), by Application 2025 & 2033
- Figure 22: Middle East & Africa Controlled Substance Disposal Service Revenue (billion), by Types 2025 & 2033
- Figure 23: Middle East & Africa Controlled Substance Disposal Service Revenue Share (%), by Types 2025 & 2033
- Figure 24: Middle East & Africa Controlled Substance Disposal Service Revenue (billion), by Country 2025 & 2033
- Figure 25: Middle East & Africa Controlled Substance Disposal Service Revenue Share (%), by Country 2025 & 2033
- Figure 26: Asia Pacific Controlled Substance Disposal Service Revenue (billion), by Application 2025 & 2033
- Figure 27: Asia Pacific Controlled Substance Disposal Service Revenue Share (%), by Application 2025 & 2033
- Figure 28: Asia Pacific Controlled Substance Disposal Service Revenue (billion), by Types 2025 & 2033
- Figure 29: Asia Pacific Controlled Substance Disposal Service Revenue Share (%), by Types 2025 & 2033
- Figure 30: Asia Pacific Controlled Substance Disposal Service Revenue (billion), by Country 2025 & 2033
- Figure 31: Asia Pacific Controlled Substance Disposal Service Revenue Share (%), by Country 2025 & 2033
List of Tables
- Table 1: Global Controlled Substance Disposal Service Revenue billion Forecast, by Application 2020 & 2033
- Table 2: Global Controlled Substance Disposal Service Revenue billion Forecast, by Types 2020 & 2033
- Table 3: Global Controlled Substance Disposal Service Revenue billion Forecast, by Region 2020 & 2033
- Table 4: Global Controlled Substance Disposal Service Revenue billion Forecast, by Application 2020 & 2033
- Table 5: Global Controlled Substance Disposal Service Revenue billion Forecast, by Types 2020 & 2033
- Table 6: Global Controlled Substance Disposal Service Revenue billion Forecast, by Country 2020 & 2033
- Table 7: United States Controlled Substance Disposal Service Revenue (billion) Forecast, by Application 2020 & 2033
- Table 8: Canada Controlled Substance Disposal Service Revenue (billion) Forecast, by Application 2020 & 2033
- Table 9: Mexico Controlled Substance Disposal Service Revenue (billion) Forecast, by Application 2020 & 2033
- Table 10: Global Controlled Substance Disposal Service Revenue billion Forecast, by Application 2020 & 2033
- Table 11: Global Controlled Substance Disposal Service Revenue billion Forecast, by Types 2020 & 2033
- Table 12: Global Controlled Substance Disposal Service Revenue billion Forecast, by Country 2020 & 2033
- Table 13: Brazil Controlled Substance Disposal Service Revenue (billion) Forecast, by Application 2020 & 2033
- Table 14: Argentina Controlled Substance Disposal Service Revenue (billion) Forecast, by Application 2020 & 2033
- Table 15: Rest of South America Controlled Substance Disposal Service Revenue (billion) Forecast, by Application 2020 & 2033
- Table 16: Global Controlled Substance Disposal Service Revenue billion Forecast, by Application 2020 & 2033
- Table 17: Global Controlled Substance Disposal Service Revenue billion Forecast, by Types 2020 & 2033
- Table 18: Global Controlled Substance Disposal Service Revenue billion Forecast, by Country 2020 & 2033
- Table 19: United Kingdom Controlled Substance Disposal Service Revenue (billion) Forecast, by Application 2020 & 2033
- Table 20: Germany Controlled Substance Disposal Service Revenue (billion) Forecast, by Application 2020 & 2033
- Table 21: France Controlled Substance Disposal Service Revenue (billion) Forecast, by Application 2020 & 2033
- Table 22: Italy Controlled Substance Disposal Service Revenue (billion) Forecast, by Application 2020 & 2033
- Table 23: Spain Controlled Substance Disposal Service Revenue (billion) Forecast, by Application 2020 & 2033
- Table 24: Russia Controlled Substance Disposal Service Revenue (billion) Forecast, by Application 2020 & 2033
- Table 25: Benelux Controlled Substance Disposal Service Revenue (billion) Forecast, by Application 2020 & 2033
- Table 26: Nordics Controlled Substance Disposal Service Revenue (billion) Forecast, by Application 2020 & 2033
- Table 27: Rest of Europe Controlled Substance Disposal Service Revenue (billion) Forecast, by Application 2020 & 2033
- Table 28: Global Controlled Substance Disposal Service Revenue billion Forecast, by Application 2020 & 2033
- Table 29: Global Controlled Substance Disposal Service Revenue billion Forecast, by Types 2020 & 2033
- Table 30: Global Controlled Substance Disposal Service Revenue billion Forecast, by Country 2020 & 2033
- Table 31: Turkey Controlled Substance Disposal Service Revenue (billion) Forecast, by Application 2020 & 2033
- Table 32: Israel Controlled Substance Disposal Service Revenue (billion) Forecast, by Application 2020 & 2033
- Table 33: GCC Controlled Substance Disposal Service Revenue (billion) Forecast, by Application 2020 & 2033
- Table 34: North Africa Controlled Substance Disposal Service Revenue (billion) Forecast, by Application 2020 & 2033
- Table 35: South Africa Controlled Substance Disposal Service Revenue (billion) Forecast, by Application 2020 & 2033
- Table 36: Rest of Middle East & Africa Controlled Substance Disposal Service Revenue (billion) Forecast, by Application 2020 & 2033
- Table 37: Global Controlled Substance Disposal Service Revenue billion Forecast, by Application 2020 & 2033
- Table 38: Global Controlled Substance Disposal Service Revenue billion Forecast, by Types 2020 & 2033
- Table 39: Global Controlled Substance Disposal Service Revenue billion Forecast, by Country 2020 & 2033
- Table 40: China Controlled Substance Disposal Service Revenue (billion) Forecast, by Application 2020 & 2033
- Table 41: India Controlled Substance Disposal Service Revenue (billion) Forecast, by Application 2020 & 2033
- Table 42: Japan Controlled Substance Disposal Service Revenue (billion) Forecast, by Application 2020 & 2033
- Table 43: South Korea Controlled Substance Disposal Service Revenue (billion) Forecast, by Application 2020 & 2033
- Table 44: ASEAN Controlled Substance Disposal Service Revenue (billion) Forecast, by Application 2020 & 2033
- Table 45: Oceania Controlled Substance Disposal Service Revenue (billion) Forecast, by Application 2020 & 2033
- Table 46: Rest of Asia Pacific Controlled Substance Disposal Service Revenue (billion) Forecast, by Application 2020 & 2033
Frequently Asked Questions
1. What is the projected Compound Annual Growth Rate (CAGR) of the Controlled Substance Disposal Service?
The projected CAGR is approximately 7%.
2. Which companies are prominent players in the Controlled Substance Disposal Service?
Key companies in the market include Stericycle, Bioserv, PureWay, VUMC, PharmWaste Technologies, Rx Destroyer, Sharpsmart, Clean Harbors, Clean Earth, Covanta Holding Corporation, US Bio-Clean, Daniels, San Diego Medical Waste Services, Sharps Compliance Inc., Waste Management, Inc..
3. What are the main segments of the Controlled Substance Disposal Service?
The market segments include Application, Types.
4. Can you provide details about the market size?
The market size is estimated to be USD 2.5 billion as of 2022.
5. What are some drivers contributing to market growth?
N/A
6. What are the notable trends driving market growth?
N/A
7. Are there any restraints impacting market growth?
N/A
8. Can you provide examples of recent developments in the market?
N/A
9. What pricing options are available for accessing the report?
Pricing options include single-user, multi-user, and enterprise licenses priced at USD 4900.00, USD 7350.00, and USD 9800.00 respectively.
10. Is the market size provided in terms of value or volume?
The market size is provided in terms of value, measured in billion.
11. Are there any specific market keywords associated with the report?
Yes, the market keyword associated with the report is "Controlled Substance Disposal Service," which aids in identifying and referencing the specific market segment covered.
12. How do I determine which pricing option suits my needs best?
The pricing options vary based on user requirements and access needs. Individual users may opt for single-user licenses, while businesses requiring broader access may choose multi-user or enterprise licenses for cost-effective access to the report.
13. Are there any additional resources or data provided in the Controlled Substance Disposal Service report?
While the report offers comprehensive insights, it's advisable to review the specific contents or supplementary materials provided to ascertain if additional resources or data are available.
14. How can I stay updated on further developments or reports in the Controlled Substance Disposal Service?
To stay informed about further developments, trends, and reports in the Controlled Substance Disposal Service, consider subscribing to industry newsletters, following relevant companies and organizations, or regularly checking reputable industry news sources and publications.
Methodology
Step 1 - Identification of Relevant Samples Size from Population Database


Step 2 - Approaches for Defining Global Market Size (Value, Volume* & Price*)

Note*: In applicable scenarios
Step 3 - Data Sources
Primary Research
- Web Analytics
- Survey Reports
- Research Institute
- Latest Research Reports
- Opinion Leaders
Secondary Research
- Annual Reports
- White Paper
- Latest Press Release
- Industry Association
- Paid Database
- Investor Presentations

Step 4 - Data Triangulation
Involves using different sources of information in order to increase the validity of a study
These sources are likely to be stakeholders in a program - participants, other researchers, program staff, other community members, and so on.
Then we put all data in single framework & apply various statistical tools to find out the dynamic on the market.
During the analysis stage, feedback from the stakeholder groups would be compared to determine areas of agreement as well as areas of divergence