

Key Insights
The global Crude Oil Carriers market is projected for robust expansion, anticipating a Compound Annual Growth Rate (CAGR) of 4.6%. The market is forecast to reach 225142.8 million by 2025, fueled by increasing worldwide oil consumption. This demand necessitates efficient shipping across vessel types including Medium Range, Panamax, Aframax, Suezmax, Very Large Crude Carriers (VLCC), and Ultra Large Crude Carriers (ULCC). Leading companies like National Iranian Oil Company (NIOC), Minerva Marine Inc, Teekay Corporation, and China Cosco Shipping Corporation Limited are actively enhancing their fleets and adopting advanced technologies to address growing demand and environmental standards.
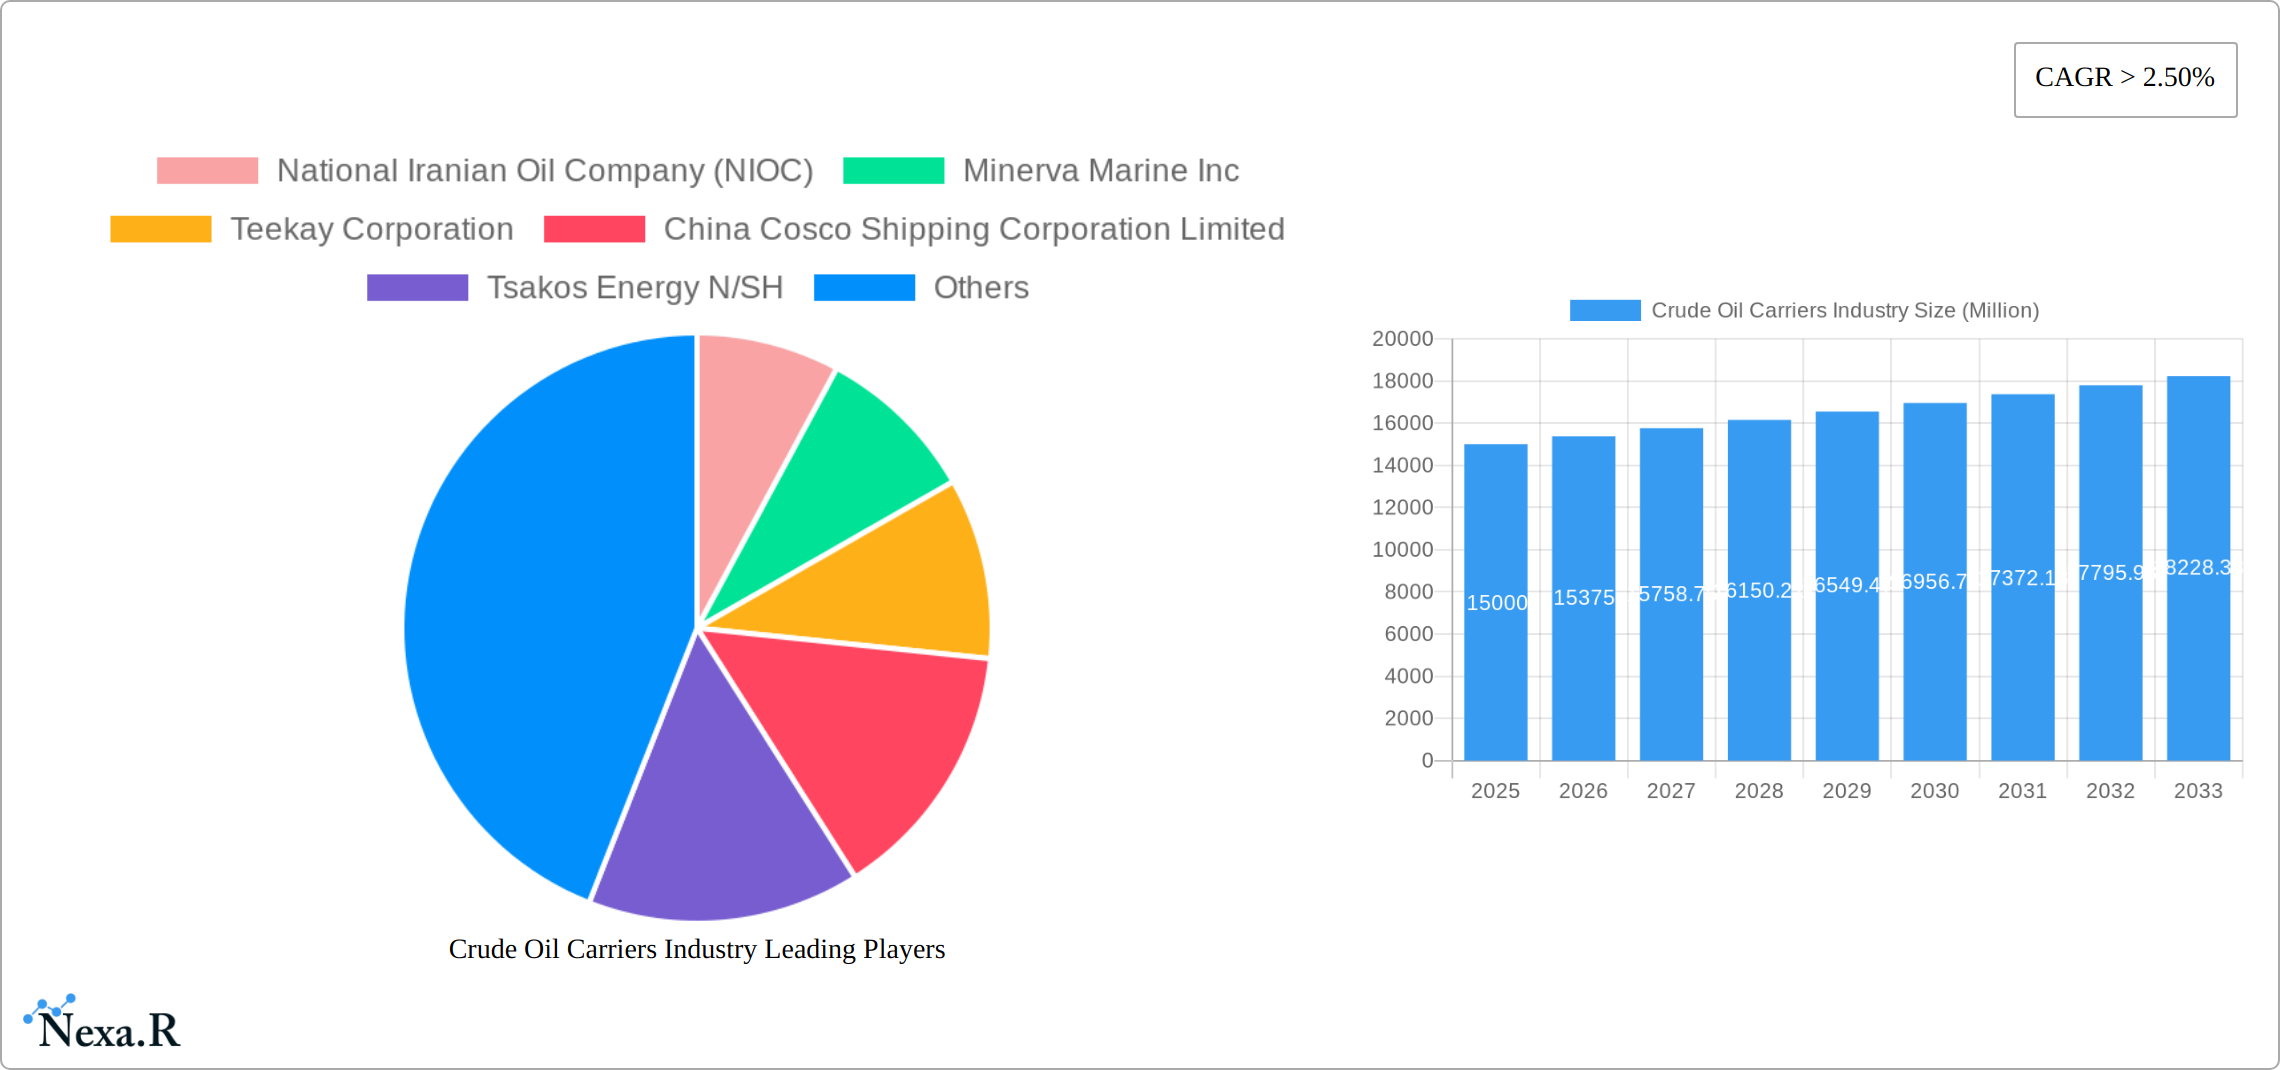
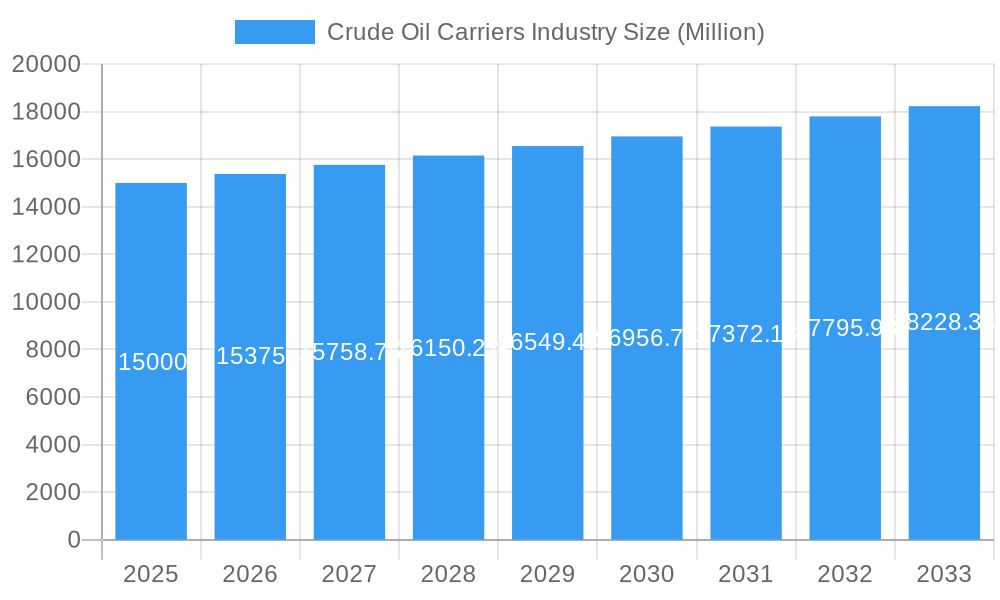
Crude Oil Carriers Industry Market Size (In Billion)
Geographically, the market spans North America, Europe, Asia Pacific, South America, and the Middle East & Africa. Asia Pacific currently dominates, driven by significant oil consumption in China and India. North America and Europe follow, supported by established trade routes. While market dynamics are influenced by volatile oil prices and geopolitical factors, opportunities arise from increased shale oil production and evolving trade networks. This report covers the period from 2019 to 2033, with 2025 as the base year, underscoring the vital role of the Crude Oil Carriers industry in global energy logistics.
Crude Oil Carriers Industry Company Market Share
Crude Oil Carriers Industry Market Report: 2019-2033
This comprehensive report provides an in-depth analysis of the Crude Oil Carriers industry, encompassing market dynamics, growth trends, regional dominance, product landscape, key players, and future outlook. The study period covers 2019-2033, with a base year of 2025 and a forecast period of 2025-2033. The report leverages extensive data analysis to provide actionable insights for industry professionals, investors, and strategic decision-makers. Parent market: Maritime Transportation; Child Market: Crude Oil Transportation.
Crude Oil Carriers Industry Market Dynamics & Structure
The crude oil carrier market, a vital cog in the global energy system, presents a complex interplay of competitive forces, technological advancements, regulatory pressures, and fluctuating market demands. This analysis dissects the market's structure and dynamics from 2019 to 2033, exploring market share fluctuations, mergers and acquisitions (M&A) activity, and the evolving role of key players. The period under review witnessed significant shifts driven by evolving geopolitical landscapes, technological innovations, and stringent environmental regulations.
- Market Concentration and Competition: The market exhibits a moderately concentrated structure, with a handful of major players commanding substantial market share. While the top 10 players controlled approximately xx% of the global market in 2025 (precise figures are detailed in the full report), the competitive landscape is dynamic, influenced by strategic alliances, capacity adjustments, and the emergence of new entrants. Competition extends beyond simply market share, encompassing factors like operational efficiency, chartering strategies, and technological prowess.
- Technological Innovation and Efficiency: The industry is witnessing a continuous drive towards enhanced efficiency and reduced environmental impact. Fuel-efficient engines, advanced hull designs, and digitalization initiatives, including optimized fleet management systems and predictive maintenance, are key technological drivers. Despite significant potential benefits, the high initial investment costs and integration complexities associated with these technologies can present barriers to adoption, particularly for smaller operators.
- Regulatory Landscape and Compliance: The regulatory framework is increasingly stringent, driven by a global focus on environmental sustainability and maritime safety. Compliance with regulations like IMO 2020 (and subsequent stricter emission standards) significantly impacts vessel design, fuel choices (e.g., the shift towards LNG and alternative fuels), and operational practices. The associated compliance costs pose a notable challenge, disproportionately affecting smaller companies with limited financial resources.
- Competitive Landscape and Substitutes: While pipelines and rail transport serve as alternative modes of crude oil transportation, they largely cater to different market segments. Within the crude oil carrier sector, the most direct competition arises from the diversity in vessel sizes. Larger VLCCs (Very Large Crude Carriers) compete on economies of scale for long-haul transportation, while smaller vessels serve niche markets requiring greater port accessibility or specialized handling.
- End-User Dynamics and Demand: Crude oil carriers serve a diverse range of end-users, primarily oil producers, refiners, and traders. Their demand varies significantly based on regional needs, crude oil grades, and overall market conditions. This heterogeneity in demand influences the types and sizes of vessels required, creating opportunities for specialized carriers.
- Mergers & Acquisitions (M&A) Activity: The industry has seen a fluctuating level of M&A activity over recent years. The period from 2019-2024 saw an estimated $xx million in M&A deals (full report details available), driven by factors such as economies of scale, expansion into new markets, and the pursuit of strategic advantages in a competitive and evolving marketplace. Further projections are detailed within the full report.
Crude Oil Carriers Industry Growth Trends & Insights
This section presents a comprehensive analysis of market size evolution, adoption rates, technological disruptions, and consumer behavior shifts.
The global crude oil carrier market is projected to exhibit a Compound Annual Growth Rate (CAGR) of xx% during the forecast period (2025-2033), driven primarily by increasing global oil demand and expansion of offshore oil and gas exploration activities. Market size reached $xx Million in 2024 and is estimated to reach $xx Million in 2025 and $xx Million by 2033. The growth trajectory is influenced by several factors, including fluctuating oil prices, geopolitical events, and advancements in vessel technologies. Technological advancements lead to greater operational efficiency and reduced environmental impact, driving market adoption and expansion. Shifts in consumer behavior, such as the increasing demand for cleaner energy sources, present both challenges and opportunities for the industry. This entails adaptation and investment in cleaner technologies to reduce the carbon footprint of crude oil transportation.
Dominant Regions, Countries, or Segments in Crude Oil Carriers Industry
This section identifies the leading regions and segments within the crude oil carrier market.
The Middle East and Asia-Pacific regions dominate the crude oil carrier market, fueled by high crude oil production and consumption. Specific countries like Saudi Arabia, UAE, China, and India stand out as key contributors.
Vessel Size Segments: Very Large Crude Carriers (VLCCs) and Suezmax vessels hold the largest market share, driven by their economic efficiency in transporting large volumes of crude oil across long distances. However, the Aframax and Panamax segments also demonstrate significant growth potential, catering to specific regional transportation requirements and trade routes. Medium range tankers have their own niches in areas where VLCCs and Suezmax vessels are not suitable.
Key Drivers:
- Strong growth in global oil demand
- Expansion of oil exploration activities
- Increasing trade volumes in key regions
- Investments in infrastructure upgrades such as port facilities
Market Share and Growth Potential: While VLCCs currently hold the largest market share, the Aframax segment is projected to experience faster growth due to its flexibility and suitability for shorter haul routes.
Crude Oil Carriers Industry Product Landscape
The crude oil carrier market is characterized by a diverse range of vessel sizes, each designed to optimize transport efficiency for specific cargo volumes and trade routes. Recent innovations focus on fuel efficiency, enhanced safety features, and environmental compliance (e.g., ballast water management systems and scrubbers). Technological advancements like improved hull designs and the adoption of advanced vessel management systems are aimed at reducing operational costs and enhancing safety. Key features influencing market share include cargo capacity, speed, fuel efficiency, environmental performance, and compliance with relevant regulations.
Key Drivers, Barriers & Challenges in Crude Oil Carriers Industry
Key Drivers:
- Rising global oil demand: The continuous increase in global energy consumption directly fuels the demand for crude oil transport.
- Technological advancements: Improved vessel designs, fuel-efficient engines, and sophisticated navigation systems increase efficiency and reduce operating costs.
- Infrastructure development: Investments in port facilities and supporting infrastructure enhance the efficiency of crude oil transportation.
Key Challenges and Restraints:
- Fluctuating oil prices: Volatile oil prices impact the profitability of oil transportation, influencing investment decisions.
- Stringent environmental regulations: Compliance with increasingly strict emission standards represents significant capital expenditure for companies.
- Geopolitical risks: Political instability and regional conflicts can disrupt oil shipping routes, increasing transportation costs and risks.
Emerging Opportunities in Crude Oil Carriers Industry
The emergence of new oil exploration projects, particularly in deep-water locations, and the growth of new shipping routes are creating significant opportunities in the crude oil carrier industry. Furthermore, investment in liquefied natural gas (LNG) fuelled vessels presents an opportunity to reduce the carbon footprint and comply with stricter environmental regulations.
Growth Accelerators in the Crude Oil Carriers Industry
Long-term growth in the crude oil carrier industry will be driven by several key factors: the continued growth of global oil demand, particularly in emerging economies; ongoing advancements in vessel technologies, focusing on efficiency and environmental sustainability; and strategic partnerships between oil companies and shipping lines to secure efficient and reliable crude oil transportation.
Key Players Shaping the Crude Oil Carriers Industry Market
- National Iranian Oil Company (NIOC)
- Minerva Marine Inc
- Teekay Corporation
- China Cosco Shipping Corporation Limited
- Tsakos Energy N/SH
- China Merchants Group Ltd
- Euronav NV
- Petroliam Nasional Berhad (PETRONAS)
- The National Shipping Co Saudi Arabia
- Angelicoussis Shipping Group Ltd
Notable Milestones in Crude Oil Carriers Industry Sector
- 2020: Implementation of IMO 2020 sulfur cap significantly impacted the industry, leading to investments in scrubbers and alternative fuels.
- 2022: Several significant M&A deals reshaped the competitive landscape.
- 2023: Introduction of new, fuel-efficient vessel designs focused on reducing environmental impact. (Specific details on mergers and new designs available in the full report)
In-Depth Crude Oil Carriers Industry Market Outlook
The future of the crude oil carrier industry is positive, driven by several growth accelerators. While challenges remain, such as environmental regulations and price volatility, strategic investments in newer technologies, expansion into emerging markets, and consolidation within the industry will contribute to the sustained growth of the sector, particularly in the transportation of cleaner fuels and sustainable shipping practices. The industry is poised for continued expansion, although at a potentially moderated pace compared to past periods of rapid growth, influenced by the ongoing transition to cleaner energy sources and evolving global energy demands.
Crude Oil Carriers Industry Segmentation
-
1. Size
- 1.1. Medium Range
- 1.2. Panaxax
- 1.3. Aframax
- 1.4. Suezmax
- 1.5. Very Lar
Crude Oil Carriers Industry Segmentation By Geography
- 1. North America
- 2. Europe
- 3. Asia Pacific
- 4. South America
- 5. Middle East
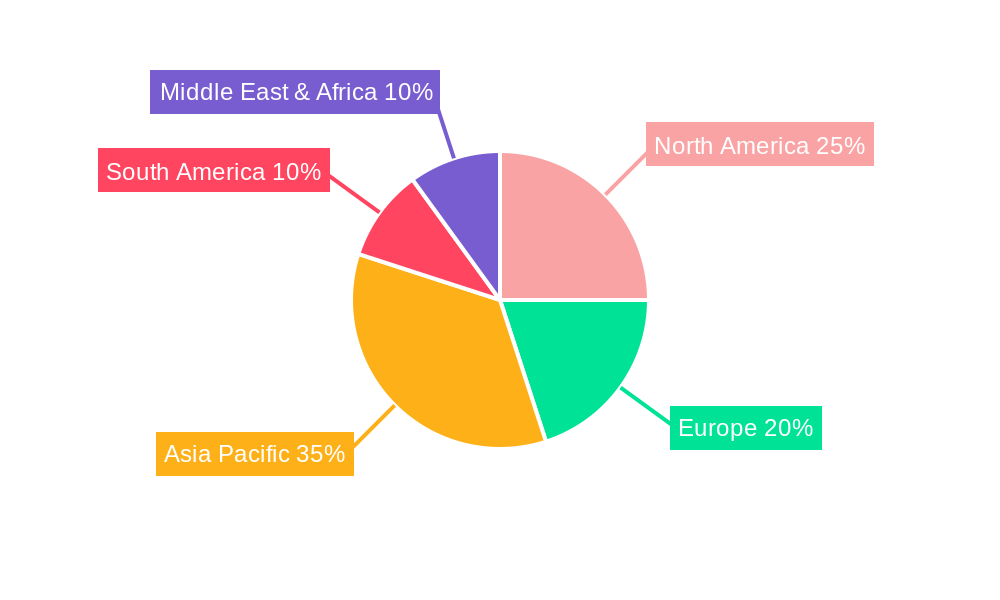
Crude Oil Carriers Industry Regional Market Share
Geographic Coverage of Crude Oil Carriers Industry
Crude Oil Carriers Industry REPORT HIGHLIGHTS
| Aspects | Details |
|---|---|
| Study Period | 2020-2034 |
| Base Year | 2025 |
| Estimated Year | 2026 |
| Forecast Period | 2026-2034 |
| Historical Period | 2020-2025 |
| Growth Rate | CAGR of 4.6% from 2020-2034 |
| Segmentation |
|
Table of Contents
- 1. Introduction
- 1.1. Research Scope
- 1.2. Market Segmentation
- 1.3. Research Objective
- 1.4. Definitions and Assumptions
- 2. Executive Summary
- 2.1. Market Snapshot
- 3. Market Dynamics
- 3.1. Market Drivers
- 3.2. Market Restrains
- 3.3. Market Trends
- 3.4. Market Opportunities
- 4. Market Factor Analysis
- 4.1. Porters Five Forces
- 4.1.1. Bargaining Power of Suppliers
- 4.1.2. Bargaining Power of Buyers
- 4.1.3. Threat of New Entrants
- 4.1.4. Threat of Substitutes
- 4.1.5. Competitive Rivalry
- 4.2. PESTEL analysis
- 4.3. BCG Analysis
- 4.3.1. Stars (High Growth, High Market Share)
- 4.3.2. Cash Cows (Low Growth, High Market Share)
- 4.3.3. Question Mark (High Growth, Low Market Share)
- 4.3.4. Dogs (Low Growth, Low Market Share)
- 4.4. Ansoff Matrix Analysis
- 4.5. Supply Chain Analysis
- 4.6. Regulatory Landscape
- 4.7. Current Market Potential and Opportunity Assessment (TAM–SAM–SOM Framework)
- 4.8. NRP Analyst Note
- 4.1. Porters Five Forces
- 5. Market Analysis, Insights and Forecast 2021-2033
- 5.1. Market Analysis, Insights and Forecast - by Size
- 5.1.1. Medium Range
- 5.1.2. Panaxax
- 5.1.3. Aframax
- 5.1.4. Suezmax
- 5.1.5. Very Lar
- 5.2. Market Analysis, Insights and Forecast - by Region
- 5.2.1. North America
- 5.2.2. Europe
- 5.2.3. Asia Pacific
- 5.2.4. South America
- 5.2.5. Middle East
- 5.1. Market Analysis, Insights and Forecast - by Size
- 6. Global Crude Oil Carriers Industry Analysis, Insights and Forecast, 2021-2033
- 6.1. Market Analysis, Insights and Forecast - by Size
- 6.1.1. Medium Range
- 6.1.2. Panaxax
- 6.1.3. Aframax
- 6.1.4. Suezmax
- 6.1.5. Very Lar
- 6.1. Market Analysis, Insights and Forecast - by Size
- 7. North America Crude Oil Carriers Industry Analysis, Insights and Forecast, 2020-2032
- 7.1. Market Analysis, Insights and Forecast - by Size
- 7.1.1. Medium Range
- 7.1.2. Panaxax
- 7.1.3. Aframax
- 7.1.4. Suezmax
- 7.1.5. Very Lar
- 7.1. Market Analysis, Insights and Forecast - by Size
- 8. Europe Crude Oil Carriers Industry Analysis, Insights and Forecast, 2020-2032
- 8.1. Market Analysis, Insights and Forecast - by Size
- 8.1.1. Medium Range
- 8.1.2. Panaxax
- 8.1.3. Aframax
- 8.1.4. Suezmax
- 8.1.5. Very Lar
- 8.1. Market Analysis, Insights and Forecast - by Size
- 9. Asia Pacific Crude Oil Carriers Industry Analysis, Insights and Forecast, 2020-2032
- 9.1. Market Analysis, Insights and Forecast - by Size
- 9.1.1. Medium Range
- 9.1.2. Panaxax
- 9.1.3. Aframax
- 9.1.4. Suezmax
- 9.1.5. Very Lar
- 9.1. Market Analysis, Insights and Forecast - by Size
- 10. South America Crude Oil Carriers Industry Analysis, Insights and Forecast, 2020-2032
- 10.1. Market Analysis, Insights and Forecast - by Size
- 10.1.1. Medium Range
- 10.1.2. Panaxax
- 10.1.3. Aframax
- 10.1.4. Suezmax
- 10.1.5. Very Lar
- 10.1. Market Analysis, Insights and Forecast - by Size
- 11. Middle East Crude Oil Carriers Industry Analysis, Insights and Forecast, 2020-2032
- 11.1. Market Analysis, Insights and Forecast - by Size
- 11.1.1. Medium Range
- 11.1.2. Panaxax
- 11.1.3. Aframax
- 11.1.4. Suezmax
- 11.1.5. Very Lar
- 11.1. Market Analysis, Insights and Forecast - by Size
- 12. Competitive Analysis
- 12.1. Company Profiles
- 12.1.1 National Iranian Oil Company (NIOC)
- 12.1.1.1. Company Overview
- 12.1.1.2. Products
- 12.1.1.3. Company Financials
- 12.1.1.4. SWOT Analysis
- 12.1.2 Minerva Marine Inc
- 12.1.2.1. Company Overview
- 12.1.2.2. Products
- 12.1.2.3. Company Financials
- 12.1.2.4. SWOT Analysis
- 12.1.3 Teekay Corporation
- 12.1.3.1. Company Overview
- 12.1.3.2. Products
- 12.1.3.3. Company Financials
- 12.1.3.4. SWOT Analysis
- 12.1.4 China Cosco Shipping Corporation Limited
- 12.1.4.1. Company Overview
- 12.1.4.2. Products
- 12.1.4.3. Company Financials
- 12.1.4.4. SWOT Analysis
- 12.1.5 Tsakos Energy N/SH
- 12.1.5.1. Company Overview
- 12.1.5.2. Products
- 12.1.5.3. Company Financials
- 12.1.5.4. SWOT Analysis
- 12.1.6 China Merchants Group Ltd
- 12.1.6.1. Company Overview
- 12.1.6.2. Products
- 12.1.6.3. Company Financials
- 12.1.6.4. SWOT Analysis
- 12.1.7 Euronav NV
- 12.1.7.1. Company Overview
- 12.1.7.2. Products
- 12.1.7.3. Company Financials
- 12.1.7.4. SWOT Analysis
- 12.1.8 Petroliam Nasional Berhad (PETRONAS)*List Not Exhaustive
- 12.1.8.1. Company Overview
- 12.1.8.2. Products
- 12.1.8.3. Company Financials
- 12.1.8.4. SWOT Analysis
- 12.1.9 The National Shipping Co Saudi Arabia
- 12.1.9.1. Company Overview
- 12.1.9.2. Products
- 12.1.9.3. Company Financials
- 12.1.9.4. SWOT Analysis
- 12.1.10 Angelicoussis Shipping Group Ltd
- 12.1.10.1. Company Overview
- 12.1.10.2. Products
- 12.1.10.3. Company Financials
- 12.1.10.4. SWOT Analysis
- 12.1.1 National Iranian Oil Company (NIOC)
- 12.2. Market Entropy
- 12.2.1 Company's Key Areas Served
- 12.2.2 Recent Developments
- 12.3. Company Market Share Analysis 2025
- 12.3.1 Top 5 Companies Market Share Analysis
- 12.3.2 Top 3 Companies Market Share Analysis
- 12.4. List of Potential Customers
- 13. Research Methodology
List of Figures
- Figure 1: Global Crude Oil Carriers Industry Revenue Breakdown (million, %) by Region 2025 & 2033
- Figure 2: Global Crude Oil Carriers Industry Volume Breakdown (metric tonnes, %) by Region 2025 & 2033
- Figure 3: North America Crude Oil Carriers Industry Revenue (million), by Size 2025 & 2033
- Figure 4: North America Crude Oil Carriers Industry Volume (metric tonnes), by Size 2025 & 2033
- Figure 5: North America Crude Oil Carriers Industry Revenue Share (%), by Size 2025 & 2033
- Figure 6: North America Crude Oil Carriers Industry Volume Share (%), by Size 2025 & 2033
- Figure 7: North America Crude Oil Carriers Industry Revenue (million), by Country 2025 & 2033
- Figure 8: North America Crude Oil Carriers Industry Volume (metric tonnes), by Country 2025 & 2033
- Figure 9: North America Crude Oil Carriers Industry Revenue Share (%), by Country 2025 & 2033
- Figure 10: North America Crude Oil Carriers Industry Volume Share (%), by Country 2025 & 2033
- Figure 11: Europe Crude Oil Carriers Industry Revenue (million), by Size 2025 & 2033
- Figure 12: Europe Crude Oil Carriers Industry Volume (metric tonnes), by Size 2025 & 2033
- Figure 13: Europe Crude Oil Carriers Industry Revenue Share (%), by Size 2025 & 2033
- Figure 14: Europe Crude Oil Carriers Industry Volume Share (%), by Size 2025 & 2033
- Figure 15: Europe Crude Oil Carriers Industry Revenue (million), by Country 2025 & 2033
- Figure 16: Europe Crude Oil Carriers Industry Volume (metric tonnes), by Country 2025 & 2033
- Figure 17: Europe Crude Oil Carriers Industry Revenue Share (%), by Country 2025 & 2033
- Figure 18: Europe Crude Oil Carriers Industry Volume Share (%), by Country 2025 & 2033
- Figure 19: Asia Pacific Crude Oil Carriers Industry Revenue (million), by Size 2025 & 2033
- Figure 20: Asia Pacific Crude Oil Carriers Industry Volume (metric tonnes), by Size 2025 & 2033
- Figure 21: Asia Pacific Crude Oil Carriers Industry Revenue Share (%), by Size 2025 & 2033
- Figure 22: Asia Pacific Crude Oil Carriers Industry Volume Share (%), by Size 2025 & 2033
- Figure 23: Asia Pacific Crude Oil Carriers Industry Revenue (million), by Country 2025 & 2033
- Figure 24: Asia Pacific Crude Oil Carriers Industry Volume (metric tonnes), by Country 2025 & 2033
- Figure 25: Asia Pacific Crude Oil Carriers Industry Revenue Share (%), by Country 2025 & 2033
- Figure 26: Asia Pacific Crude Oil Carriers Industry Volume Share (%), by Country 2025 & 2033
- Figure 27: South America Crude Oil Carriers Industry Revenue (million), by Size 2025 & 2033
- Figure 28: South America Crude Oil Carriers Industry Volume (metric tonnes), by Size 2025 & 2033
- Figure 29: South America Crude Oil Carriers Industry Revenue Share (%), by Size 2025 & 2033
- Figure 30: South America Crude Oil Carriers Industry Volume Share (%), by Size 2025 & 2033
- Figure 31: South America Crude Oil Carriers Industry Revenue (million), by Country 2025 & 2033
- Figure 32: South America Crude Oil Carriers Industry Volume (metric tonnes), by Country 2025 & 2033
- Figure 33: South America Crude Oil Carriers Industry Revenue Share (%), by Country 2025 & 2033
- Figure 34: South America Crude Oil Carriers Industry Volume Share (%), by Country 2025 & 2033
- Figure 35: Middle East Crude Oil Carriers Industry Revenue (million), by Size 2025 & 2033
- Figure 36: Middle East Crude Oil Carriers Industry Volume (metric tonnes), by Size 2025 & 2033
- Figure 37: Middle East Crude Oil Carriers Industry Revenue Share (%), by Size 2025 & 2033
- Figure 38: Middle East Crude Oil Carriers Industry Volume Share (%), by Size 2025 & 2033
- Figure 39: Middle East Crude Oil Carriers Industry Revenue (million), by Country 2025 & 2033
- Figure 40: Middle East Crude Oil Carriers Industry Volume (metric tonnes), by Country 2025 & 2033
- Figure 41: Middle East Crude Oil Carriers Industry Revenue Share (%), by Country 2025 & 2033
- Figure 42: Middle East Crude Oil Carriers Industry Volume Share (%), by Country 2025 & 2033
List of Tables
- Table 1: Global Crude Oil Carriers Industry Revenue million Forecast, by Size 2020 & 2033
- Table 2: Global Crude Oil Carriers Industry Volume metric tonnes Forecast, by Size 2020 & 2033
- Table 3: Global Crude Oil Carriers Industry Revenue million Forecast, by Region 2020 & 2033
- Table 4: Global Crude Oil Carriers Industry Volume metric tonnes Forecast, by Region 2020 & 2033
- Table 5: Global Crude Oil Carriers Industry Revenue million Forecast, by Size 2020 & 2033
- Table 6: Global Crude Oil Carriers Industry Volume metric tonnes Forecast, by Size 2020 & 2033
- Table 7: Global Crude Oil Carriers Industry Revenue million Forecast, by Country 2020 & 2033
- Table 8: Global Crude Oil Carriers Industry Volume metric tonnes Forecast, by Country 2020 & 2033
- Table 9: Global Crude Oil Carriers Industry Revenue million Forecast, by Size 2020 & 2033
- Table 10: Global Crude Oil Carriers Industry Volume metric tonnes Forecast, by Size 2020 & 2033
- Table 11: Global Crude Oil Carriers Industry Revenue million Forecast, by Country 2020 & 2033
- Table 12: Global Crude Oil Carriers Industry Volume metric tonnes Forecast, by Country 2020 & 2033
- Table 13: Global Crude Oil Carriers Industry Revenue million Forecast, by Size 2020 & 2033
- Table 14: Global Crude Oil Carriers Industry Volume metric tonnes Forecast, by Size 2020 & 2033
- Table 15: Global Crude Oil Carriers Industry Revenue million Forecast, by Country 2020 & 2033
- Table 16: Global Crude Oil Carriers Industry Volume metric tonnes Forecast, by Country 2020 & 2033
- Table 17: Global Crude Oil Carriers Industry Revenue million Forecast, by Size 2020 & 2033
- Table 18: Global Crude Oil Carriers Industry Volume metric tonnes Forecast, by Size 2020 & 2033
- Table 19: Global Crude Oil Carriers Industry Revenue million Forecast, by Country 2020 & 2033
- Table 20: Global Crude Oil Carriers Industry Volume metric tonnes Forecast, by Country 2020 & 2033
- Table 21: Global Crude Oil Carriers Industry Revenue million Forecast, by Size 2020 & 2033
- Table 22: Global Crude Oil Carriers Industry Volume metric tonnes Forecast, by Size 2020 & 2033
- Table 23: Global Crude Oil Carriers Industry Revenue million Forecast, by Country 2020 & 2033
- Table 24: Global Crude Oil Carriers Industry Volume metric tonnes Forecast, by Country 2020 & 2033
Frequently Asked Questions
1. What is the projected Compound Annual Growth Rate (CAGR) of the Crude Oil Carriers Industry?
The projected CAGR is approximately 4.6%.
2. Which companies are prominent players in the Crude Oil Carriers Industry?
Key companies in the market include National Iranian Oil Company (NIOC), Minerva Marine Inc, Teekay Corporation, China Cosco Shipping Corporation Limited, Tsakos Energy N/SH, China Merchants Group Ltd, Euronav NV, Petroliam Nasional Berhad (PETRONAS)*List Not Exhaustive, The National Shipping Co Saudi Arabia, Angelicoussis Shipping Group Ltd.
3. What are the main segments of the Crude Oil Carriers Industry?
The market segments include Size.
4. Can you provide details about the market size?
The market size is estimated to be USD 225142.8 million as of 2022.
5. What are some drivers contributing to market growth?
Increasing Electricity Demand; Rising Investments in the Coal Industry.
6. What are the notable trends driving market growth?
Very Large Crude Carrier to Dominate the Market.
7. Are there any restraints impacting market growth?
Increasing Installation of Renewable Energy Sources.
8. Can you provide examples of recent developments in the market?
N/A
9. What pricing options are available for accessing the report?
Pricing options include single-user, multi-user, and enterprise licenses priced at USD 4750, USD 5250, and USD 8750 respectively.
10. Is the market size provided in terms of value or volume?
The market size is provided in terms of value, measured in million and volume, measured in metric tonnes.
11. Are there any specific market keywords associated with the report?
Yes, the market keyword associated with the report is "Crude Oil Carriers Industry," which aids in identifying and referencing the specific market segment covered.
12. How do I determine which pricing option suits my needs best?
The pricing options vary based on user requirements and access needs. Individual users may opt for single-user licenses, while businesses requiring broader access may choose multi-user or enterprise licenses for cost-effective access to the report.
13. Are there any additional resources or data provided in the Crude Oil Carriers Industry report?
While the report offers comprehensive insights, it's advisable to review the specific contents or supplementary materials provided to ascertain if additional resources or data are available.
14. How can I stay updated on further developments or reports in the Crude Oil Carriers Industry?
To stay informed about further developments, trends, and reports in the Crude Oil Carriers Industry, consider subscribing to industry newsletters, following relevant companies and organizations, or regularly checking reputable industry news sources and publications.
Methodology
Step 1 - Identification of Relevant Samples Size from Population Database


Step 2 - Approaches for Defining Global Market Size (Value, Volume* & Price*)

Note*: In applicable scenarios
Step 3 - Data Sources
Primary Research
- Web Analytics
- Survey Reports
- Research Institute
- Latest Research Reports
- Opinion Leaders
Secondary Research
- Annual Reports
- White Paper
- Latest Press Release
- Industry Association
- Paid Database
- Investor Presentations

Step 4 - Data Triangulation
Involves using different sources of information in order to increase the validity of a study
These sources are likely to be stakeholders in a program - participants, other researchers, program staff, other community members, and so on.
Then we put all data in single framework & apply various statistical tools to find out the dynamic on the market.
During the analysis stage, feedback from the stakeholder groups would be compared to determine areas of agreement as well as areas of divergence