

Key Insights
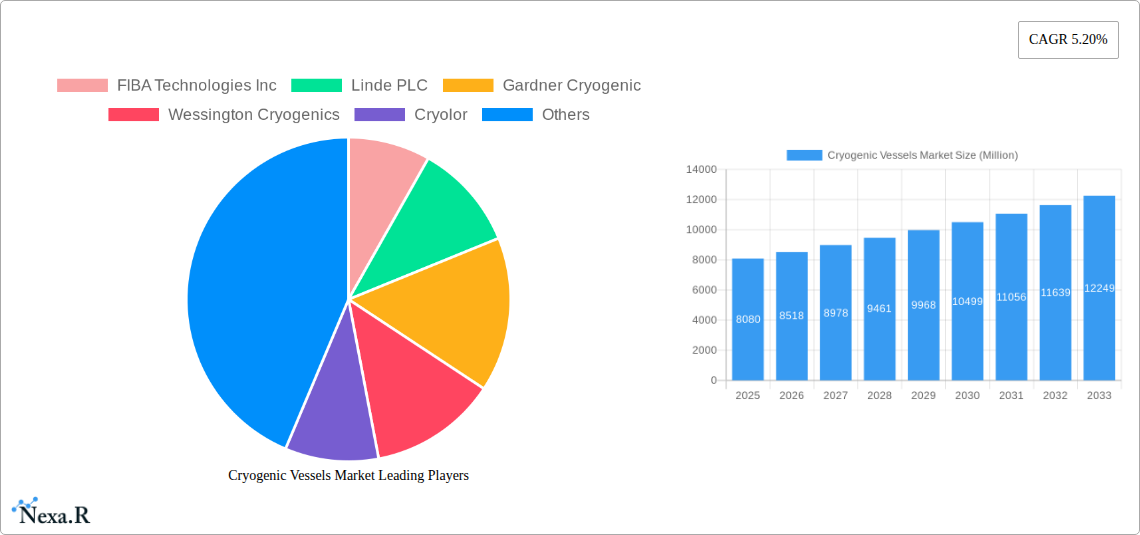
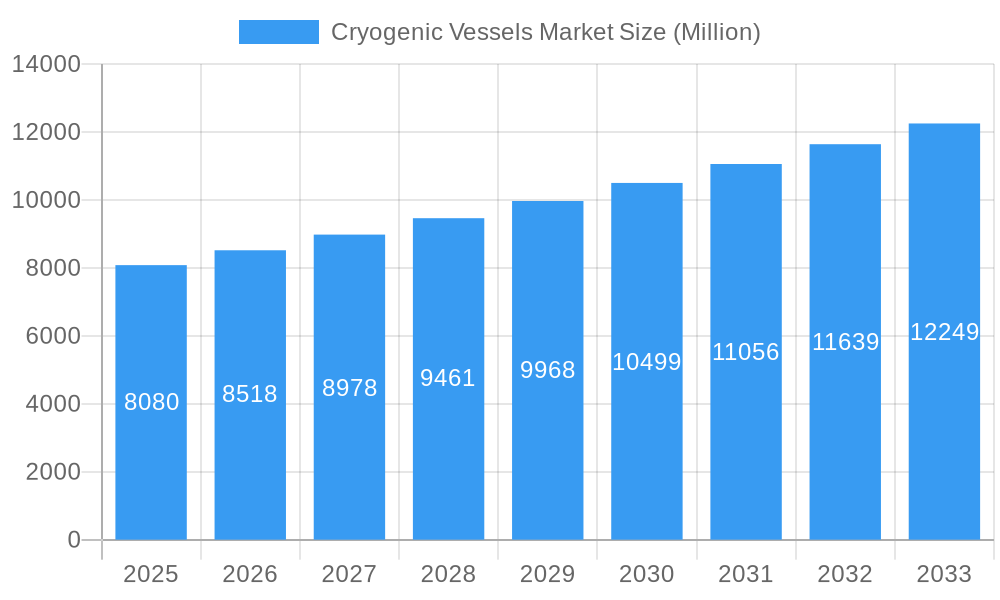
The global cryogenic vessels market, valued at $8.08 billion in 2025, is projected to experience robust growth, exhibiting a compound annual growth rate (CAGR) of 5.20% from 2025 to 2033. This expansion is fueled by several key drivers. The burgeoning energy sector, particularly the increasing demand for liquefied natural gas (LNG) for power generation and transportation, significantly contributes to market growth. Advancements in cryogenic technologies, leading to improved vessel efficiency and safety, further stimulate adoption. The healthcare sector's reliance on cryogenic storage for medical samples and pharmaceuticals also fuels demand. Furthermore, the expanding food and beverage industry, utilizing cryogenic freezing for preservation, presents a significant market opportunity. Growth is also observed across various vessel applications, including storage and transportation, reflecting a diversified market landscape. While material costs and stringent regulatory compliance present some challenges, the overall market outlook remains positive, driven by technological advancements and growing demand across diverse end-user industries.
Cryogenic Vessels Market Market Size (In Billion)
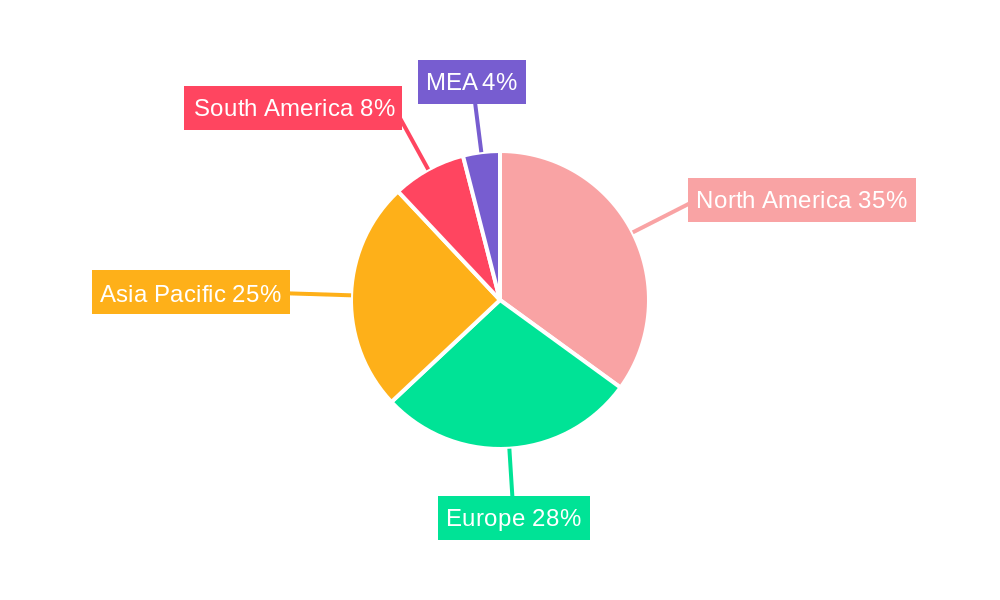
The market segmentation reveals significant contributions from various cryogenic liquids, with LNG commanding a substantial share. Steel remains a dominant raw material, although the adoption of advanced alloys like nickel and aluminum is expected to increase due to their superior performance at cryogenic temperatures. Geographically, North America and Asia-Pacific are expected to remain key market regions, driven by significant investments in energy infrastructure and industrial expansion. However, the growing adoption of cryogenic technologies in emerging economies across Europe, South America, and the Middle East & Africa (MEA) is expected to unlock new growth opportunities. Competitive dynamics are shaped by a mix of established players and emerging companies, with ongoing innovations in vessel design, materials, and manufacturing processes contributing to market evolution. The forecast period suggests a continued upward trajectory, with market value exceeding $12 billion by 2033, highlighting the significant growth potential of the cryogenic vessels market.
Cryogenic Vessels Market Company Market Share
Cryogenic Vessels Market: A Comprehensive Report (2019-2033)
This comprehensive report provides an in-depth analysis of the Cryogenic Vessels Market, encompassing market dynamics, growth trends, regional dominance, product landscape, and key players shaping the industry's future. The report covers the historical period (2019-2024), base year (2025), and forecast period (2025-2033), offering invaluable insights for industry professionals, investors, and strategic decision-makers. The total market size is predicted to reach xx Million by 2033.
Cryogenic Vessels Market Dynamics & Structure
The Cryogenic Vessels market, a sub-segment of the larger Industrial Gas Equipment market, is characterized by moderate concentration, with key players holding significant market share. Technological innovation, particularly in materials science and cryogenic tank design, is a major driver. Stringent safety regulations and environmental concerns influence market dynamics. Competitive pressures arise from substitute technologies and the emergence of new players. M&A activity has been relatively modest in recent years, with xx deals recorded between 2019 and 2024, representing a xx% market share change.
- Market Concentration: Moderately concentrated, with top 10 players holding approximately xx% market share in 2024.
- Technological Innovation: Focus on advanced materials (e.g., high-strength alloys, composites), improved insulation, and efficient designs drive market growth.
- Regulatory Frameworks: Stringent safety and environmental regulations (e.g., regarding pressure vessel design and material usage) significantly impact market operations.
- Competitive Product Substitutes: Limited direct substitutes, but alternative storage and transport methods pose indirect competition.
- End-User Demographics: Dominated by energy generation, healthcare, and food & beverage sectors, with growing demand from emerging sectors like metal processing and aerospace.
- M&A Trends: Consolidation is expected to increase, driven by economies of scale and access to technology.
Cryogenic Vessels Market Growth Trends & Insights
The Cryogenic Vessels market has witnessed steady growth from 2019 to 2024, expanding at a CAGR of xx%. This growth is attributed to rising demand for cryogenic liquids like LNG, LN2, LOX, and LH2 across various sectors. Technological advancements, including improved insulation and material selection, have increased efficiency and reduced operational costs, further boosting adoption. Shifting consumer preferences towards sustainable and environmentally friendly solutions are also driving the market. Market penetration in emerging economies is expected to increase significantly in the forecast period.
The market is poised for significant expansion, driven by several factors, including increasing demand for clean energy (propelling the growth of liquid hydrogen storage), enhanced cold chain logistics, and technological advancements in cryogenic tank design. Growth in the forecast period is projected at a CAGR of xx%, reaching xx Million by 2033.
Dominant Regions, Countries, or Segments in Cryogenic Vessels Market
North America and Europe currently dominate the Cryogenic Vessels market, accounting for approximately xx% and xx% of the global market share respectively in 2024. However, the Asia-Pacific region is expected to witness the fastest growth during the forecast period, driven by substantial investments in infrastructure development and expanding industrial activity. The LNG segment within Cryogenic Liquids holds the largest market share due to the expansion of LNG-based power generation and transportation.
- Key Drivers:
- North America: Robust energy sector, growing demand for LH2, advanced technology adoption.
- Europe: Stringent environmental regulations promoting cleaner energy solutions, investments in LH2 infrastructure.
- Asia-Pacific: Rapid industrialization, rising energy demand, and significant investments in LNG infrastructure.
- Dominant Segments: LNG (Cryogenic Liquid), Steel (Raw Material), Storage (Application), and Energy Generation (End-User Industry) represent the largest market shares.
- Growth Potential: Asia-Pacific offers the highest growth potential due to rapid industrialization and increasing investments in cryogenic infrastructure.
Cryogenic Vessels Market Product Landscape
Cryogenic vessels are evolving towards improved efficiency, durability, and safety. Modern vessels incorporate advanced materials like composite fibers and high-strength alloys, resulting in lighter, stronger, and more cost-effective designs. Innovations in insulation technologies are minimizing boil-off rates, reducing operational costs and environmental impact. Unique selling propositions often focus on superior thermal performance, enhanced safety features, and customized solutions tailored to specific end-user requirements.
Key Drivers, Barriers & Challenges in Cryogenic Vessels Market
Key Drivers: Increasing demand for cryogenic liquids across various sectors (especially LNG and LH2), technological advancements leading to improved efficiency and safety, and government support for clean energy initiatives are key drivers.
Key Challenges & Restraints: High initial investment costs, stringent safety regulations, complex supply chain logistics, and potential material shortages can hinder market growth. The impact of these restraints is estimated to reduce the market growth by approximately xx% in the forecast period.
Emerging Opportunities in Cryogenic Vessels Market
Growing demand for cryogenic storage and transport solutions in emerging economies, particularly for LNG and LH2, presents significant opportunities. Advancements in composite materials and lighter vessel designs are opening new avenues for the market. Moreover, the rising demand for sustainable and efficient cold chain logistics in the food and pharmaceutical industries creates significant growth potential.
Growth Accelerators in the Cryogenic Vessels Market Industry
Technological innovations, especially in materials science and insulation technologies, are accelerating market growth. Strategic collaborations between equipment manufacturers and end-users are fostering technological development and market expansion. Government initiatives promoting clean energy and investment in LNG and LH2 infrastructure further stimulate growth.
Key Players Shaping the Cryogenic Vessels Market Market
- FIBA Technologies Inc
- Linde PLC
- Gardner Cryogenic
- Wessington Cryogenics
- Cryolor
- Air Water Inc
- Cryofab Inc
- INOX India Ltd
- Chart Industries Inc
- ISISAN A S
Notable Milestones in Cryogenic Vessels Market Sector
- March 2023: INOXCVA's new manufacturing facility in India significantly expands production capacity, potentially impacting supply and pricing dynamics.
- April 2023: The NCC's program to test composite cryogenic storage tanks for LH2 indicates a shift towards lighter and more efficient materials, impacting future product designs.
In-Depth Cryogenic Vessels Market Market Outlook
The Cryogenic Vessels market is poised for strong growth, driven by increasing demand across key sectors and the ongoing adoption of advanced technologies. Strategic partnerships, investments in R&D, and expansion into emerging markets will be crucial for success. The market's future potential is significant, with opportunities in both established and developing economies. The long-term outlook is positive, with a projected CAGR of xx% during the forecast period, indicating a substantial expansion in market size.
Cryogenic Vessels Market Segmentation
-
1. Application
- 1.1. Storage
- 1.2. Transport
-
2. End-User Industry
- 2.1. Energy Generation
- 2.2. Metal Processing
- 2.3. Healthcare
- 2.4. Food and Beverages
- 2.5. Other End-User Industries
-
3. Cryogenic Liquid
- 3.1. LNG
- 3.2. Liquid Nitrogen
- 3.3. Liquid Oxygen
- 3.4. Liquid Hydrogen
- 3.5. Other Cryogenic Liquids
-
4. Raw Material
- 4.1. Steel
- 4.2. Nickel Alloy
- 4.3. Aluminum Alloy
- 4.4. Other Raw Materials
Cryogenic Vessels Market Segmentation By Geography
-
1. North America
- 1.1. United States
- 1.2. Canada
- 1.3. Rest of North America
-
2. Europe
- 2.1. Germany
- 2.2. France
- 2.3. United Kingdom
- 2.4. Russia
- 2.5. Rest of Europe
-
3. Asia Pacific
- 3.1. China
- 3.2. India
- 3.3. Australia
- 3.4. Japan
- 3.5. Malaysia
- 3.6. Rest of Asia Pacific
-
4. Middle East and Africa
- 4.1. Saudi Arabia
- 4.2. UAE
- 4.3. Nigeria
- 4.4. South Africa
- 4.5. Rest of Middle East and Africa
-
5. South America
- 5.1. Brazil
- 5.2. Argentina
- 5.3. Chile
- 5.4. Rest of South America
Cryogenic Vessels Market Regional Market Share
Geographic Coverage of Cryogenic Vessels Market
Cryogenic Vessels Market REPORT HIGHLIGHTS
| Aspects | Details |
|---|---|
| Study Period | 2020-2034 |
| Base Year | 2025 |
| Estimated Year | 2026 |
| Forecast Period | 2026-2034 |
| Historical Period | 2020-2025 |
| Growth Rate | CAGR of 5.20% from 2020-2034 |
| Segmentation |
|
Table of Contents
- 1. Introduction
- 1.1. Research Scope
- 1.2. Market Segmentation
- 1.3. Research Objective
- 1.4. Definitions and Assumptions
- 2. Executive Summary
- 2.1. Market Snapshot
- 3. Market Dynamics
- 3.1. Market Drivers
- 3.2. Market Restrains
- 3.3. Market Trends
- 3.4. Market Opportunities
- 4. Market Factor Analysis
- 4.1. Porters Five Forces
- 4.1.1. Bargaining Power of Suppliers
- 4.1.2. Bargaining Power of Buyers
- 4.1.3. Threat of New Entrants
- 4.1.4. Threat of Substitutes
- 4.1.5. Competitive Rivalry
- 4.2. PESTEL analysis
- 4.3. BCG Analysis
- 4.3.1. Stars (High Growth, High Market Share)
- 4.3.2. Cash Cows (Low Growth, High Market Share)
- 4.3.3. Question Mark (High Growth, Low Market Share)
- 4.3.4. Dogs (Low Growth, Low Market Share)
- 4.4. Ansoff Matrix Analysis
- 4.5. Supply Chain Analysis
- 4.6. Regulatory Landscape
- 4.7. Current Market Potential and Opportunity Assessment (TAM–SAM–SOM Framework)
- 4.8. NRP Analyst Note
- 4.1. Porters Five Forces
- 5. Market Analysis, Insights and Forecast 2021-2033
- 5.1. Market Analysis, Insights and Forecast - by Application
- 5.1.1. Storage
- 5.1.2. Transport
- 5.2. Market Analysis, Insights and Forecast - by End-User Industry
- 5.2.1. Energy Generation
- 5.2.2. Metal Processing
- 5.2.3. Healthcare
- 5.2.4. Food and Beverages
- 5.2.5. Other End-User Industries
- 5.3. Market Analysis, Insights and Forecast - by Cryogenic Liquid
- 5.3.1. LNG
- 5.3.2. Liquid Nitrogen
- 5.3.3. Liquid Oxygen
- 5.3.4. Liquid Hydrogen
- 5.3.5. Other Cryogenic Liquids
- 5.4. Market Analysis, Insights and Forecast - by Raw Material
- 5.4.1. Steel
- 5.4.2. Nickel Alloy
- 5.4.3. Aluminum Alloy
- 5.4.4. Other Raw Materials
- 5.5. Market Analysis, Insights and Forecast - by Region
- 5.5.1. North America
- 5.5.2. Europe
- 5.5.3. Asia Pacific
- 5.5.4. Middle East and Africa
- 5.5.5. South America
- 5.1. Market Analysis, Insights and Forecast - by Application
- 6. Global Cryogenic Vessels Market Analysis, Insights and Forecast, 2021-2033
- 6.1. Market Analysis, Insights and Forecast - by Application
- 6.1.1. Storage
- 6.1.2. Transport
- 6.2. Market Analysis, Insights and Forecast - by End-User Industry
- 6.2.1. Energy Generation
- 6.2.2. Metal Processing
- 6.2.3. Healthcare
- 6.2.4. Food and Beverages
- 6.2.5. Other End-User Industries
- 6.3. Market Analysis, Insights and Forecast - by Cryogenic Liquid
- 6.3.1. LNG
- 6.3.2. Liquid Nitrogen
- 6.3.3. Liquid Oxygen
- 6.3.4. Liquid Hydrogen
- 6.3.5. Other Cryogenic Liquids
- 6.4. Market Analysis, Insights and Forecast - by Raw Material
- 6.4.1. Steel
- 6.4.2. Nickel Alloy
- 6.4.3. Aluminum Alloy
- 6.4.4. Other Raw Materials
- 6.1. Market Analysis, Insights and Forecast - by Application
- 7. North America Cryogenic Vessels Market Analysis, Insights and Forecast, 2020-2032
- 7.1. Market Analysis, Insights and Forecast - by Application
- 7.1.1. Storage
- 7.1.2. Transport
- 7.2. Market Analysis, Insights and Forecast - by End-User Industry
- 7.2.1. Energy Generation
- 7.2.2. Metal Processing
- 7.2.3. Healthcare
- 7.2.4. Food and Beverages
- 7.2.5. Other End-User Industries
- 7.3. Market Analysis, Insights and Forecast - by Cryogenic Liquid
- 7.3.1. LNG
- 7.3.2. Liquid Nitrogen
- 7.3.3. Liquid Oxygen
- 7.3.4. Liquid Hydrogen
- 7.3.5. Other Cryogenic Liquids
- 7.4. Market Analysis, Insights and Forecast - by Raw Material
- 7.4.1. Steel
- 7.4.2. Nickel Alloy
- 7.4.3. Aluminum Alloy
- 7.4.4. Other Raw Materials
- 7.1. Market Analysis, Insights and Forecast - by Application
- 8. Europe Cryogenic Vessels Market Analysis, Insights and Forecast, 2020-2032
- 8.1. Market Analysis, Insights and Forecast - by Application
- 8.1.1. Storage
- 8.1.2. Transport
- 8.2. Market Analysis, Insights and Forecast - by End-User Industry
- 8.2.1. Energy Generation
- 8.2.2. Metal Processing
- 8.2.3. Healthcare
- 8.2.4. Food and Beverages
- 8.2.5. Other End-User Industries
- 8.3. Market Analysis, Insights and Forecast - by Cryogenic Liquid
- 8.3.1. LNG
- 8.3.2. Liquid Nitrogen
- 8.3.3. Liquid Oxygen
- 8.3.4. Liquid Hydrogen
- 8.3.5. Other Cryogenic Liquids
- 8.4. Market Analysis, Insights and Forecast - by Raw Material
- 8.4.1. Steel
- 8.4.2. Nickel Alloy
- 8.4.3. Aluminum Alloy
- 8.4.4. Other Raw Materials
- 8.1. Market Analysis, Insights and Forecast - by Application
- 9. Asia Pacific Cryogenic Vessels Market Analysis, Insights and Forecast, 2020-2032
- 9.1. Market Analysis, Insights and Forecast - by Application
- 9.1.1. Storage
- 9.1.2. Transport
- 9.2. Market Analysis, Insights and Forecast - by End-User Industry
- 9.2.1. Energy Generation
- 9.2.2. Metal Processing
- 9.2.3. Healthcare
- 9.2.4. Food and Beverages
- 9.2.5. Other End-User Industries
- 9.3. Market Analysis, Insights and Forecast - by Cryogenic Liquid
- 9.3.1. LNG
- 9.3.2. Liquid Nitrogen
- 9.3.3. Liquid Oxygen
- 9.3.4. Liquid Hydrogen
- 9.3.5. Other Cryogenic Liquids
- 9.4. Market Analysis, Insights and Forecast - by Raw Material
- 9.4.1. Steel
- 9.4.2. Nickel Alloy
- 9.4.3. Aluminum Alloy
- 9.4.4. Other Raw Materials
- 9.1. Market Analysis, Insights and Forecast - by Application
- 10. Middle East and Africa Cryogenic Vessels Market Analysis, Insights and Forecast, 2020-2032
- 10.1. Market Analysis, Insights and Forecast - by Application
- 10.1.1. Storage
- 10.1.2. Transport
- 10.2. Market Analysis, Insights and Forecast - by End-User Industry
- 10.2.1. Energy Generation
- 10.2.2. Metal Processing
- 10.2.3. Healthcare
- 10.2.4. Food and Beverages
- 10.2.5. Other End-User Industries
- 10.3. Market Analysis, Insights and Forecast - by Cryogenic Liquid
- 10.3.1. LNG
- 10.3.2. Liquid Nitrogen
- 10.3.3. Liquid Oxygen
- 10.3.4. Liquid Hydrogen
- 10.3.5. Other Cryogenic Liquids
- 10.4. Market Analysis, Insights and Forecast - by Raw Material
- 10.4.1. Steel
- 10.4.2. Nickel Alloy
- 10.4.3. Aluminum Alloy
- 10.4.4. Other Raw Materials
- 10.1. Market Analysis, Insights and Forecast - by Application
- 11. South America Cryogenic Vessels Market Analysis, Insights and Forecast, 2020-2032
- 11.1. Market Analysis, Insights and Forecast - by Application
- 11.1.1. Storage
- 11.1.2. Transport
- 11.2. Market Analysis, Insights and Forecast - by End-User Industry
- 11.2.1. Energy Generation
- 11.2.2. Metal Processing
- 11.2.3. Healthcare
- 11.2.4. Food and Beverages
- 11.2.5. Other End-User Industries
- 11.3. Market Analysis, Insights and Forecast - by Cryogenic Liquid
- 11.3.1. LNG
- 11.3.2. Liquid Nitrogen
- 11.3.3. Liquid Oxygen
- 11.3.4. Liquid Hydrogen
- 11.3.5. Other Cryogenic Liquids
- 11.4. Market Analysis, Insights and Forecast - by Raw Material
- 11.4.1. Steel
- 11.4.2. Nickel Alloy
- 11.4.3. Aluminum Alloy
- 11.4.4. Other Raw Materials
- 11.1. Market Analysis, Insights and Forecast - by Application
- 12. Competitive Analysis
- 12.1. Company Profiles
- 12.1.1 FIBA Technologies Inc
- 12.1.1.1. Company Overview
- 12.1.1.2. Products
- 12.1.1.3. Company Financials
- 12.1.1.4. SWOT Analysis
- 12.1.2 Linde PLC
- 12.1.2.1. Company Overview
- 12.1.2.2. Products
- 12.1.2.3. Company Financials
- 12.1.2.4. SWOT Analysis
- 12.1.3 Gardner Cryogenic
- 12.1.3.1. Company Overview
- 12.1.3.2. Products
- 12.1.3.3. Company Financials
- 12.1.3.4. SWOT Analysis
- 12.1.4 Wessington Cryogenics
- 12.1.4.1. Company Overview
- 12.1.4.2. Products
- 12.1.4.3. Company Financials
- 12.1.4.4. SWOT Analysis
- 12.1.5 Cryolor
- 12.1.5.1. Company Overview
- 12.1.5.2. Products
- 12.1.5.3. Company Financials
- 12.1.5.4. SWOT Analysis
- 12.1.6 Air Water Inc
- 12.1.6.1. Company Overview
- 12.1.6.2. Products
- 12.1.6.3. Company Financials
- 12.1.6.4. SWOT Analysis
- 12.1.7 Cryofab Inc
- 12.1.7.1. Company Overview
- 12.1.7.2. Products
- 12.1.7.3. Company Financials
- 12.1.7.4. SWOT Analysis
- 12.1.8 INOX India Ltd
- 12.1.8.1. Company Overview
- 12.1.8.2. Products
- 12.1.8.3. Company Financials
- 12.1.8.4. SWOT Analysis
- 12.1.9 Chart Industries Inc
- 12.1.9.1. Company Overview
- 12.1.9.2. Products
- 12.1.9.3. Company Financials
- 12.1.9.4. SWOT Analysis
- 12.1.10 ISISAN A S
- 12.1.10.1. Company Overview
- 12.1.10.2. Products
- 12.1.10.3. Company Financials
- 12.1.10.4. SWOT Analysis
- 12.1.1 FIBA Technologies Inc
- 12.2. Market Entropy
- 12.2.1 Company's Key Areas Served
- 12.2.2 Recent Developments
- 12.3. Company Market Share Analysis 2025
- 12.3.1 Top 5 Companies Market Share Analysis
- 12.3.2 Top 3 Companies Market Share Analysis
- 12.4. List of Potential Customers
- 13. Research Methodology
List of Figures
- Figure 1: Global Cryogenic Vessels Market Revenue Breakdown (Million, %) by Region 2025 & 2033
- Figure 2: Global Cryogenic Vessels Market Volume Breakdown (K Unit, %) by Region 2025 & 2033
- Figure 3: North America Cryogenic Vessels Market Revenue (Million), by Application 2025 & 2033
- Figure 4: North America Cryogenic Vessels Market Volume (K Unit), by Application 2025 & 2033
- Figure 5: North America Cryogenic Vessels Market Revenue Share (%), by Application 2025 & 2033
- Figure 6: North America Cryogenic Vessels Market Volume Share (%), by Application 2025 & 2033
- Figure 7: North America Cryogenic Vessels Market Revenue (Million), by End-User Industry 2025 & 2033
- Figure 8: North America Cryogenic Vessels Market Volume (K Unit), by End-User Industry 2025 & 2033
- Figure 9: North America Cryogenic Vessels Market Revenue Share (%), by End-User Industry 2025 & 2033
- Figure 10: North America Cryogenic Vessels Market Volume Share (%), by End-User Industry 2025 & 2033
- Figure 11: North America Cryogenic Vessels Market Revenue (Million), by Cryogenic Liquid 2025 & 2033
- Figure 12: North America Cryogenic Vessels Market Volume (K Unit), by Cryogenic Liquid 2025 & 2033
- Figure 13: North America Cryogenic Vessels Market Revenue Share (%), by Cryogenic Liquid 2025 & 2033
- Figure 14: North America Cryogenic Vessels Market Volume Share (%), by Cryogenic Liquid 2025 & 2033
- Figure 15: North America Cryogenic Vessels Market Revenue (Million), by Raw Material 2025 & 2033
- Figure 16: North America Cryogenic Vessels Market Volume (K Unit), by Raw Material 2025 & 2033
- Figure 17: North America Cryogenic Vessels Market Revenue Share (%), by Raw Material 2025 & 2033
- Figure 18: North America Cryogenic Vessels Market Volume Share (%), by Raw Material 2025 & 2033
- Figure 19: North America Cryogenic Vessels Market Revenue (Million), by Country 2025 & 2033
- Figure 20: North America Cryogenic Vessels Market Volume (K Unit), by Country 2025 & 2033
- Figure 21: North America Cryogenic Vessels Market Revenue Share (%), by Country 2025 & 2033
- Figure 22: North America Cryogenic Vessels Market Volume Share (%), by Country 2025 & 2033
- Figure 23: Europe Cryogenic Vessels Market Revenue (Million), by Application 2025 & 2033
- Figure 24: Europe Cryogenic Vessels Market Volume (K Unit), by Application 2025 & 2033
- Figure 25: Europe Cryogenic Vessels Market Revenue Share (%), by Application 2025 & 2033
- Figure 26: Europe Cryogenic Vessels Market Volume Share (%), by Application 2025 & 2033
- Figure 27: Europe Cryogenic Vessels Market Revenue (Million), by End-User Industry 2025 & 2033
- Figure 28: Europe Cryogenic Vessels Market Volume (K Unit), by End-User Industry 2025 & 2033
- Figure 29: Europe Cryogenic Vessels Market Revenue Share (%), by End-User Industry 2025 & 2033
- Figure 30: Europe Cryogenic Vessels Market Volume Share (%), by End-User Industry 2025 & 2033
- Figure 31: Europe Cryogenic Vessels Market Revenue (Million), by Cryogenic Liquid 2025 & 2033
- Figure 32: Europe Cryogenic Vessels Market Volume (K Unit), by Cryogenic Liquid 2025 & 2033
- Figure 33: Europe Cryogenic Vessels Market Revenue Share (%), by Cryogenic Liquid 2025 & 2033
- Figure 34: Europe Cryogenic Vessels Market Volume Share (%), by Cryogenic Liquid 2025 & 2033
- Figure 35: Europe Cryogenic Vessels Market Revenue (Million), by Raw Material 2025 & 2033
- Figure 36: Europe Cryogenic Vessels Market Volume (K Unit), by Raw Material 2025 & 2033
- Figure 37: Europe Cryogenic Vessels Market Revenue Share (%), by Raw Material 2025 & 2033
- Figure 38: Europe Cryogenic Vessels Market Volume Share (%), by Raw Material 2025 & 2033
- Figure 39: Europe Cryogenic Vessels Market Revenue (Million), by Country 2025 & 2033
- Figure 40: Europe Cryogenic Vessels Market Volume (K Unit), by Country 2025 & 2033
- Figure 41: Europe Cryogenic Vessels Market Revenue Share (%), by Country 2025 & 2033
- Figure 42: Europe Cryogenic Vessels Market Volume Share (%), by Country 2025 & 2033
- Figure 43: Asia Pacific Cryogenic Vessels Market Revenue (Million), by Application 2025 & 2033
- Figure 44: Asia Pacific Cryogenic Vessels Market Volume (K Unit), by Application 2025 & 2033
- Figure 45: Asia Pacific Cryogenic Vessels Market Revenue Share (%), by Application 2025 & 2033
- Figure 46: Asia Pacific Cryogenic Vessels Market Volume Share (%), by Application 2025 & 2033
- Figure 47: Asia Pacific Cryogenic Vessels Market Revenue (Million), by End-User Industry 2025 & 2033
- Figure 48: Asia Pacific Cryogenic Vessels Market Volume (K Unit), by End-User Industry 2025 & 2033
- Figure 49: Asia Pacific Cryogenic Vessels Market Revenue Share (%), by End-User Industry 2025 & 2033
- Figure 50: Asia Pacific Cryogenic Vessels Market Volume Share (%), by End-User Industry 2025 & 2033
- Figure 51: Asia Pacific Cryogenic Vessels Market Revenue (Million), by Cryogenic Liquid 2025 & 2033
- Figure 52: Asia Pacific Cryogenic Vessels Market Volume (K Unit), by Cryogenic Liquid 2025 & 2033
- Figure 53: Asia Pacific Cryogenic Vessels Market Revenue Share (%), by Cryogenic Liquid 2025 & 2033
- Figure 54: Asia Pacific Cryogenic Vessels Market Volume Share (%), by Cryogenic Liquid 2025 & 2033
- Figure 55: Asia Pacific Cryogenic Vessels Market Revenue (Million), by Raw Material 2025 & 2033
- Figure 56: Asia Pacific Cryogenic Vessels Market Volume (K Unit), by Raw Material 2025 & 2033
- Figure 57: Asia Pacific Cryogenic Vessels Market Revenue Share (%), by Raw Material 2025 & 2033
- Figure 58: Asia Pacific Cryogenic Vessels Market Volume Share (%), by Raw Material 2025 & 2033
- Figure 59: Asia Pacific Cryogenic Vessels Market Revenue (Million), by Country 2025 & 2033
- Figure 60: Asia Pacific Cryogenic Vessels Market Volume (K Unit), by Country 2025 & 2033
- Figure 61: Asia Pacific Cryogenic Vessels Market Revenue Share (%), by Country 2025 & 2033
- Figure 62: Asia Pacific Cryogenic Vessels Market Volume Share (%), by Country 2025 & 2033
- Figure 63: Middle East and Africa Cryogenic Vessels Market Revenue (Million), by Application 2025 & 2033
- Figure 64: Middle East and Africa Cryogenic Vessels Market Volume (K Unit), by Application 2025 & 2033
- Figure 65: Middle East and Africa Cryogenic Vessels Market Revenue Share (%), by Application 2025 & 2033
- Figure 66: Middle East and Africa Cryogenic Vessels Market Volume Share (%), by Application 2025 & 2033
- Figure 67: Middle East and Africa Cryogenic Vessels Market Revenue (Million), by End-User Industry 2025 & 2033
- Figure 68: Middle East and Africa Cryogenic Vessels Market Volume (K Unit), by End-User Industry 2025 & 2033
- Figure 69: Middle East and Africa Cryogenic Vessels Market Revenue Share (%), by End-User Industry 2025 & 2033
- Figure 70: Middle East and Africa Cryogenic Vessels Market Volume Share (%), by End-User Industry 2025 & 2033
- Figure 71: Middle East and Africa Cryogenic Vessels Market Revenue (Million), by Cryogenic Liquid 2025 & 2033
- Figure 72: Middle East and Africa Cryogenic Vessels Market Volume (K Unit), by Cryogenic Liquid 2025 & 2033
- Figure 73: Middle East and Africa Cryogenic Vessels Market Revenue Share (%), by Cryogenic Liquid 2025 & 2033
- Figure 74: Middle East and Africa Cryogenic Vessels Market Volume Share (%), by Cryogenic Liquid 2025 & 2033
- Figure 75: Middle East and Africa Cryogenic Vessels Market Revenue (Million), by Raw Material 2025 & 2033
- Figure 76: Middle East and Africa Cryogenic Vessels Market Volume (K Unit), by Raw Material 2025 & 2033
- Figure 77: Middle East and Africa Cryogenic Vessels Market Revenue Share (%), by Raw Material 2025 & 2033
- Figure 78: Middle East and Africa Cryogenic Vessels Market Volume Share (%), by Raw Material 2025 & 2033
- Figure 79: Middle East and Africa Cryogenic Vessels Market Revenue (Million), by Country 2025 & 2033
- Figure 80: Middle East and Africa Cryogenic Vessels Market Volume (K Unit), by Country 2025 & 2033
- Figure 81: Middle East and Africa Cryogenic Vessels Market Revenue Share (%), by Country 2025 & 2033
- Figure 82: Middle East and Africa Cryogenic Vessels Market Volume Share (%), by Country 2025 & 2033
- Figure 83: South America Cryogenic Vessels Market Revenue (Million), by Application 2025 & 2033
- Figure 84: South America Cryogenic Vessels Market Volume (K Unit), by Application 2025 & 2033
- Figure 85: South America Cryogenic Vessels Market Revenue Share (%), by Application 2025 & 2033
- Figure 86: South America Cryogenic Vessels Market Volume Share (%), by Application 2025 & 2033
- Figure 87: South America Cryogenic Vessels Market Revenue (Million), by End-User Industry 2025 & 2033
- Figure 88: South America Cryogenic Vessels Market Volume (K Unit), by End-User Industry 2025 & 2033
- Figure 89: South America Cryogenic Vessels Market Revenue Share (%), by End-User Industry 2025 & 2033
- Figure 90: South America Cryogenic Vessels Market Volume Share (%), by End-User Industry 2025 & 2033
- Figure 91: South America Cryogenic Vessels Market Revenue (Million), by Cryogenic Liquid 2025 & 2033
- Figure 92: South America Cryogenic Vessels Market Volume (K Unit), by Cryogenic Liquid 2025 & 2033
- Figure 93: South America Cryogenic Vessels Market Revenue Share (%), by Cryogenic Liquid 2025 & 2033
- Figure 94: South America Cryogenic Vessels Market Volume Share (%), by Cryogenic Liquid 2025 & 2033
- Figure 95: South America Cryogenic Vessels Market Revenue (Million), by Raw Material 2025 & 2033
- Figure 96: South America Cryogenic Vessels Market Volume (K Unit), by Raw Material 2025 & 2033
- Figure 97: South America Cryogenic Vessels Market Revenue Share (%), by Raw Material 2025 & 2033
- Figure 98: South America Cryogenic Vessels Market Volume Share (%), by Raw Material 2025 & 2033
- Figure 99: South America Cryogenic Vessels Market Revenue (Million), by Country 2025 & 2033
- Figure 100: South America Cryogenic Vessels Market Volume (K Unit), by Country 2025 & 2033
- Figure 101: South America Cryogenic Vessels Market Revenue Share (%), by Country 2025 & 2033
- Figure 102: South America Cryogenic Vessels Market Volume Share (%), by Country 2025 & 2033
List of Tables
- Table 1: Global Cryogenic Vessels Market Revenue Million Forecast, by Application 2020 & 2033
- Table 2: Global Cryogenic Vessels Market Volume K Unit Forecast, by Application 2020 & 2033
- Table 3: Global Cryogenic Vessels Market Revenue Million Forecast, by End-User Industry 2020 & 2033
- Table 4: Global Cryogenic Vessels Market Volume K Unit Forecast, by End-User Industry 2020 & 2033
- Table 5: Global Cryogenic Vessels Market Revenue Million Forecast, by Cryogenic Liquid 2020 & 2033
- Table 6: Global Cryogenic Vessels Market Volume K Unit Forecast, by Cryogenic Liquid 2020 & 2033
- Table 7: Global Cryogenic Vessels Market Revenue Million Forecast, by Raw Material 2020 & 2033
- Table 8: Global Cryogenic Vessels Market Volume K Unit Forecast, by Raw Material 2020 & 2033
- Table 9: Global Cryogenic Vessels Market Revenue Million Forecast, by Region 2020 & 2033
- Table 10: Global Cryogenic Vessels Market Volume K Unit Forecast, by Region 2020 & 2033
- Table 11: Global Cryogenic Vessels Market Revenue Million Forecast, by Application 2020 & 2033
- Table 12: Global Cryogenic Vessels Market Volume K Unit Forecast, by Application 2020 & 2033
- Table 13: Global Cryogenic Vessels Market Revenue Million Forecast, by End-User Industry 2020 & 2033
- Table 14: Global Cryogenic Vessels Market Volume K Unit Forecast, by End-User Industry 2020 & 2033
- Table 15: Global Cryogenic Vessels Market Revenue Million Forecast, by Cryogenic Liquid 2020 & 2033
- Table 16: Global Cryogenic Vessels Market Volume K Unit Forecast, by Cryogenic Liquid 2020 & 2033
- Table 17: Global Cryogenic Vessels Market Revenue Million Forecast, by Raw Material 2020 & 2033
- Table 18: Global Cryogenic Vessels Market Volume K Unit Forecast, by Raw Material 2020 & 2033
- Table 19: Global Cryogenic Vessels Market Revenue Million Forecast, by Country 2020 & 2033
- Table 20: Global Cryogenic Vessels Market Volume K Unit Forecast, by Country 2020 & 2033
- Table 21: United States Cryogenic Vessels Market Revenue (Million) Forecast, by Application 2020 & 2033
- Table 22: United States Cryogenic Vessels Market Volume (K Unit) Forecast, by Application 2020 & 2033
- Table 23: Canada Cryogenic Vessels Market Revenue (Million) Forecast, by Application 2020 & 2033
- Table 24: Canada Cryogenic Vessels Market Volume (K Unit) Forecast, by Application 2020 & 2033
- Table 25: Rest of North America Cryogenic Vessels Market Revenue (Million) Forecast, by Application 2020 & 2033
- Table 26: Rest of North America Cryogenic Vessels Market Volume (K Unit) Forecast, by Application 2020 & 2033
- Table 27: Global Cryogenic Vessels Market Revenue Million Forecast, by Application 2020 & 2033
- Table 28: Global Cryogenic Vessels Market Volume K Unit Forecast, by Application 2020 & 2033
- Table 29: Global Cryogenic Vessels Market Revenue Million Forecast, by End-User Industry 2020 & 2033
- Table 30: Global Cryogenic Vessels Market Volume K Unit Forecast, by End-User Industry 2020 & 2033
- Table 31: Global Cryogenic Vessels Market Revenue Million Forecast, by Cryogenic Liquid 2020 & 2033
- Table 32: Global Cryogenic Vessels Market Volume K Unit Forecast, by Cryogenic Liquid 2020 & 2033
- Table 33: Global Cryogenic Vessels Market Revenue Million Forecast, by Raw Material 2020 & 2033
- Table 34: Global Cryogenic Vessels Market Volume K Unit Forecast, by Raw Material 2020 & 2033
- Table 35: Global Cryogenic Vessels Market Revenue Million Forecast, by Country 2020 & 2033
- Table 36: Global Cryogenic Vessels Market Volume K Unit Forecast, by Country 2020 & 2033
- Table 37: Germany Cryogenic Vessels Market Revenue (Million) Forecast, by Application 2020 & 2033
- Table 38: Germany Cryogenic Vessels Market Volume (K Unit) Forecast, by Application 2020 & 2033
- Table 39: France Cryogenic Vessels Market Revenue (Million) Forecast, by Application 2020 & 2033
- Table 40: France Cryogenic Vessels Market Volume (K Unit) Forecast, by Application 2020 & 2033
- Table 41: United Kingdom Cryogenic Vessels Market Revenue (Million) Forecast, by Application 2020 & 2033
- Table 42: United Kingdom Cryogenic Vessels Market Volume (K Unit) Forecast, by Application 2020 & 2033
- Table 43: Russia Cryogenic Vessels Market Revenue (Million) Forecast, by Application 2020 & 2033
- Table 44: Russia Cryogenic Vessels Market Volume (K Unit) Forecast, by Application 2020 & 2033
- Table 45: Rest of Europe Cryogenic Vessels Market Revenue (Million) Forecast, by Application 2020 & 2033
- Table 46: Rest of Europe Cryogenic Vessels Market Volume (K Unit) Forecast, by Application 2020 & 2033
- Table 47: Global Cryogenic Vessels Market Revenue Million Forecast, by Application 2020 & 2033
- Table 48: Global Cryogenic Vessels Market Volume K Unit Forecast, by Application 2020 & 2033
- Table 49: Global Cryogenic Vessels Market Revenue Million Forecast, by End-User Industry 2020 & 2033
- Table 50: Global Cryogenic Vessels Market Volume K Unit Forecast, by End-User Industry 2020 & 2033
- Table 51: Global Cryogenic Vessels Market Revenue Million Forecast, by Cryogenic Liquid 2020 & 2033
- Table 52: Global Cryogenic Vessels Market Volume K Unit Forecast, by Cryogenic Liquid 2020 & 2033
- Table 53: Global Cryogenic Vessels Market Revenue Million Forecast, by Raw Material 2020 & 2033
- Table 54: Global Cryogenic Vessels Market Volume K Unit Forecast, by Raw Material 2020 & 2033
- Table 55: Global Cryogenic Vessels Market Revenue Million Forecast, by Country 2020 & 2033
- Table 56: Global Cryogenic Vessels Market Volume K Unit Forecast, by Country 2020 & 2033
- Table 57: China Cryogenic Vessels Market Revenue (Million) Forecast, by Application 2020 & 2033
- Table 58: China Cryogenic Vessels Market Volume (K Unit) Forecast, by Application 2020 & 2033
- Table 59: India Cryogenic Vessels Market Revenue (Million) Forecast, by Application 2020 & 2033
- Table 60: India Cryogenic Vessels Market Volume (K Unit) Forecast, by Application 2020 & 2033
- Table 61: Australia Cryogenic Vessels Market Revenue (Million) Forecast, by Application 2020 & 2033
- Table 62: Australia Cryogenic Vessels Market Volume (K Unit) Forecast, by Application 2020 & 2033
- Table 63: Japan Cryogenic Vessels Market Revenue (Million) Forecast, by Application 2020 & 2033
- Table 64: Japan Cryogenic Vessels Market Volume (K Unit) Forecast, by Application 2020 & 2033
- Table 65: Malaysia Cryogenic Vessels Market Revenue (Million) Forecast, by Application 2020 & 2033
- Table 66: Malaysia Cryogenic Vessels Market Volume (K Unit) Forecast, by Application 2020 & 2033
- Table 67: Rest of Asia Pacific Cryogenic Vessels Market Revenue (Million) Forecast, by Application 2020 & 2033
- Table 68: Rest of Asia Pacific Cryogenic Vessels Market Volume (K Unit) Forecast, by Application 2020 & 2033
- Table 69: Global Cryogenic Vessels Market Revenue Million Forecast, by Application 2020 & 2033
- Table 70: Global Cryogenic Vessels Market Volume K Unit Forecast, by Application 2020 & 2033
- Table 71: Global Cryogenic Vessels Market Revenue Million Forecast, by End-User Industry 2020 & 2033
- Table 72: Global Cryogenic Vessels Market Volume K Unit Forecast, by End-User Industry 2020 & 2033
- Table 73: Global Cryogenic Vessels Market Revenue Million Forecast, by Cryogenic Liquid 2020 & 2033
- Table 74: Global Cryogenic Vessels Market Volume K Unit Forecast, by Cryogenic Liquid 2020 & 2033
- Table 75: Global Cryogenic Vessels Market Revenue Million Forecast, by Raw Material 2020 & 2033
- Table 76: Global Cryogenic Vessels Market Volume K Unit Forecast, by Raw Material 2020 & 2033
- Table 77: Global Cryogenic Vessels Market Revenue Million Forecast, by Country 2020 & 2033
- Table 78: Global Cryogenic Vessels Market Volume K Unit Forecast, by Country 2020 & 2033
- Table 79: Saudi Arabia Cryogenic Vessels Market Revenue (Million) Forecast, by Application 2020 & 2033
- Table 80: Saudi Arabia Cryogenic Vessels Market Volume (K Unit) Forecast, by Application 2020 & 2033
- Table 81: UAE Cryogenic Vessels Market Revenue (Million) Forecast, by Application 2020 & 2033
- Table 82: UAE Cryogenic Vessels Market Volume (K Unit) Forecast, by Application 2020 & 2033
- Table 83: Nigeria Cryogenic Vessels Market Revenue (Million) Forecast, by Application 2020 & 2033
- Table 84: Nigeria Cryogenic Vessels Market Volume (K Unit) Forecast, by Application 2020 & 2033
- Table 85: South Africa Cryogenic Vessels Market Revenue (Million) Forecast, by Application 2020 & 2033
- Table 86: South Africa Cryogenic Vessels Market Volume (K Unit) Forecast, by Application 2020 & 2033
- Table 87: Rest of Middle East and Africa Cryogenic Vessels Market Revenue (Million) Forecast, by Application 2020 & 2033
- Table 88: Rest of Middle East and Africa Cryogenic Vessels Market Volume (K Unit) Forecast, by Application 2020 & 2033
- Table 89: Global Cryogenic Vessels Market Revenue Million Forecast, by Application 2020 & 2033
- Table 90: Global Cryogenic Vessels Market Volume K Unit Forecast, by Application 2020 & 2033
- Table 91: Global Cryogenic Vessels Market Revenue Million Forecast, by End-User Industry 2020 & 2033
- Table 92: Global Cryogenic Vessels Market Volume K Unit Forecast, by End-User Industry 2020 & 2033
- Table 93: Global Cryogenic Vessels Market Revenue Million Forecast, by Cryogenic Liquid 2020 & 2033
- Table 94: Global Cryogenic Vessels Market Volume K Unit Forecast, by Cryogenic Liquid 2020 & 2033
- Table 95: Global Cryogenic Vessels Market Revenue Million Forecast, by Raw Material 2020 & 2033
- Table 96: Global Cryogenic Vessels Market Volume K Unit Forecast, by Raw Material 2020 & 2033
- Table 97: Global Cryogenic Vessels Market Revenue Million Forecast, by Country 2020 & 2033
- Table 98: Global Cryogenic Vessels Market Volume K Unit Forecast, by Country 2020 & 2033
- Table 99: Brazil Cryogenic Vessels Market Revenue (Million) Forecast, by Application 2020 & 2033
- Table 100: Brazil Cryogenic Vessels Market Volume (K Unit) Forecast, by Application 2020 & 2033
- Table 101: Argentina Cryogenic Vessels Market Revenue (Million) Forecast, by Application 2020 & 2033
- Table 102: Argentina Cryogenic Vessels Market Volume (K Unit) Forecast, by Application 2020 & 2033
- Table 103: Chile Cryogenic Vessels Market Revenue (Million) Forecast, by Application 2020 & 2033
- Table 104: Chile Cryogenic Vessels Market Volume (K Unit) Forecast, by Application 2020 & 2033
- Table 105: Rest of South America Cryogenic Vessels Market Revenue (Million) Forecast, by Application 2020 & 2033
- Table 106: Rest of South America Cryogenic Vessels Market Volume (K Unit) Forecast, by Application 2020 & 2033
Frequently Asked Questions
1. What is the projected Compound Annual Growth Rate (CAGR) of the Cryogenic Vessels Market?
The projected CAGR is approximately 5.20%.
2. Which companies are prominent players in the Cryogenic Vessels Market?
Key companies in the market include FIBA Technologies Inc, Linde PLC, Gardner Cryogenic, Wessington Cryogenics, Cryolor, Air Water Inc, Cryofab Inc, INOX India Ltd, Chart Industries Inc, ISISAN A S.
3. What are the main segments of the Cryogenic Vessels Market?
The market segments include Application, End-User Industry, Cryogenic Liquid, Raw Material.
4. Can you provide details about the market size?
The market size is estimated to be USD 8.08 Million as of 2022.
5. What are some drivers contributing to market growth?
4.; Increasing Demand for Liquefied Natural Gas (LNG).
6. What are the notable trends driving market growth?
Metal Processing Industry To Dominate The Market.
7. Are there any restraints impacting market growth?
4.; High Operational and Maintenance Costs.
8. Can you provide examples of recent developments in the market?
April 2023: The National Composites Centre (NCC), located in Bristol, U.K., unveiled a program dedicated to testing composite cryogenic storage tanks within the United Kingdom. This initiative aims to validate and expedite the capabilities to design, manufacture, and test such tanks. The program is projected to evaluate a linerless carbon fiber tank that stores liquid hydrogen (LH2).
9. What pricing options are available for accessing the report?
Pricing options include single-user, multi-user, and enterprise licenses priced at USD 4750, USD 5250, and USD 8750 respectively.
10. Is the market size provided in terms of value or volume?
The market size is provided in terms of value, measured in Million and volume, measured in K Unit.
11. Are there any specific market keywords associated with the report?
Yes, the market keyword associated with the report is "Cryogenic Vessels Market," which aids in identifying and referencing the specific market segment covered.
12. How do I determine which pricing option suits my needs best?
The pricing options vary based on user requirements and access needs. Individual users may opt for single-user licenses, while businesses requiring broader access may choose multi-user or enterprise licenses for cost-effective access to the report.
13. Are there any additional resources or data provided in the Cryogenic Vessels Market report?
While the report offers comprehensive insights, it's advisable to review the specific contents or supplementary materials provided to ascertain if additional resources or data are available.
14. How can I stay updated on further developments or reports in the Cryogenic Vessels Market?
To stay informed about further developments, trends, and reports in the Cryogenic Vessels Market, consider subscribing to industry newsletters, following relevant companies and organizations, or regularly checking reputable industry news sources and publications.
Methodology
Step 1 - Identification of Relevant Samples Size from Population Database


Step 2 - Approaches for Defining Global Market Size (Value, Volume* & Price*)

Note*: In applicable scenarios
Step 3 - Data Sources
Primary Research
- Web Analytics
- Survey Reports
- Research Institute
- Latest Research Reports
- Opinion Leaders
Secondary Research
- Annual Reports
- White Paper
- Latest Press Release
- Industry Association
- Paid Database
- Investor Presentations

Step 4 - Data Triangulation
Involves using different sources of information in order to increase the validity of a study
These sources are likely to be stakeholders in a program - participants, other researchers, program staff, other community members, and so on.
Then we put all data in single framework & apply various statistical tools to find out the dynamic on the market.
During the analysis stage, feedback from the stakeholder groups would be compared to determine areas of agreement as well as areas of divergence