

Key Insights
The Electronic Design Automation (EDA) and Computer-Aided Design (CAD) workstation market, a critical sector for hardware and software solutions, is experiencing substantial expansion. This growth is propelled by the escalating complexity of electronic systems and the surging demand for cutting-edge technologies such as Artificial Intelligence (AI), 5G, and the Internet of Things (IoT). The market, projected to reach $3.45 billion by the base year 2025, is forecasted to grow at a Compound Annual Growth Rate (CAGR) of 9.62%. This robust expansion is attributed to several pivotal factors: the increasing adoption of advanced semiconductor processes necessitating sophisticated EDA tools, the heightened requirement for high-performance computing in design simulations, and the growing preference for scalable and collaborative cloud-based EDA solutions. Leading technology providers like Nvidia, AMD, and Intel are instrumental in this growth through their advanced GPU and CPU offerings, complemented by software innovators such as Cadence and Mentor Graphics driving advancements in design software capabilities.
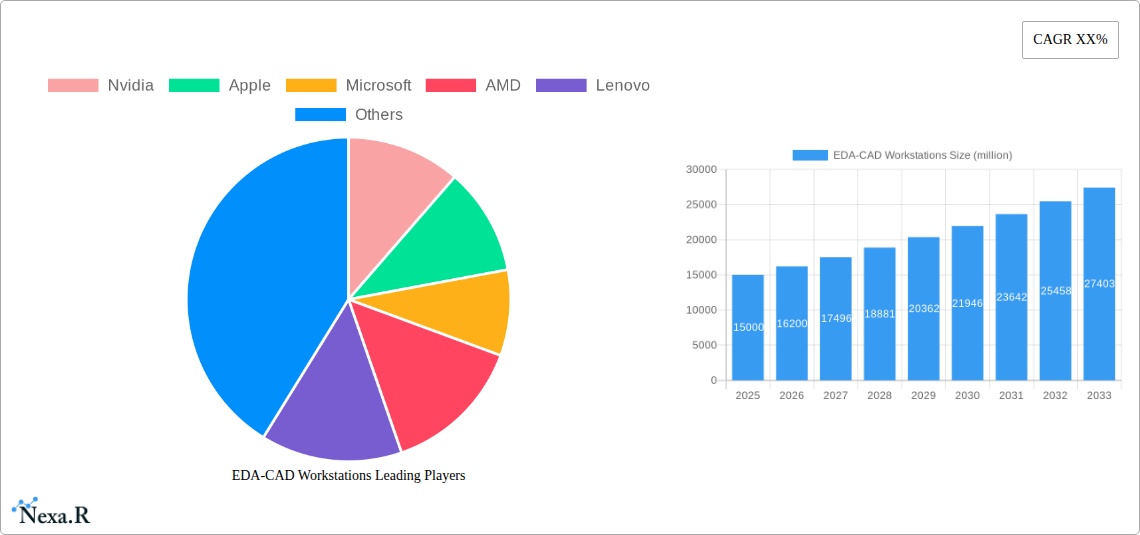
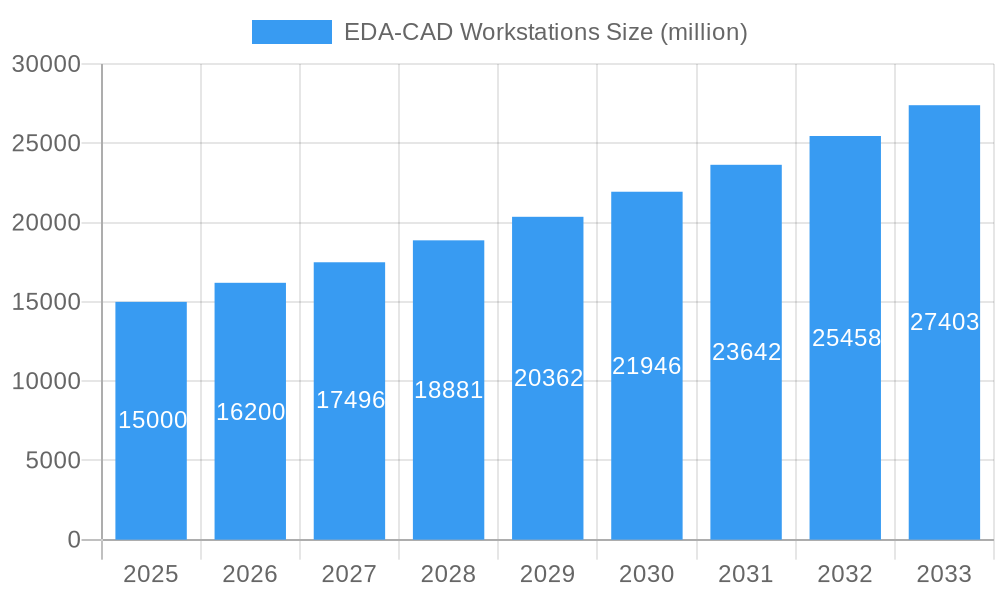
EDA-CAD Workstations Market Size (In Billion)
Significant regional disparities are evident, with North America and Asia-Pacific dominating the market due to a high concentration of semiconductor firms and rapid adoption of advanced technologies. While challenges such as the high cost of workstations and the necessity for specialized expertise may present headwinds, continuous technological advancements and the escalating demand for efficient design solutions are anticipated to overcome these constraints. Market segmentation caters to diverse requirements, from premium workstations for large-scale Integrated Circuit (IC) design to more accessible options for smaller design entities. The competitive environment is defined by incumbent players consistently investing in research and development to boost performance and market share, alongside emerging entrants introducing novel and specialized offerings. This dynamic interaction between established and new companies will likely foster continued innovation and market growth.
EDA-CAD Workstations Company Market Share
EDA-CAD Workstations Market Report: 2019-2033
This comprehensive report provides an in-depth analysis of the EDA-CAD workstations market, encompassing market dynamics, growth trends, regional segmentation, product landscape, key players, and future outlook. The report covers the period from 2019 to 2033, with a base year of 2025 and a forecast period of 2025-2033. The study leverages extensive primary and secondary research to deliver actionable insights for industry professionals, investors, and strategic decision-makers. The global EDA-CAD workstation market is projected to reach xx million units by 2033.
EDA-CAD Workstations Market Dynamics & Structure
The EDA-CAD workstation market is characterized by a moderately concentrated landscape, with key players vying for market share through technological innovation and strategic partnerships. The market is driven by increasing demand for high-performance computing in electronics design, particularly in the semiconductor and automotive industries. Regulatory frameworks concerning data security and environmental compliance impact market players. Competitive substitutes, such as cloud-based EDA solutions, pose a challenge to traditional workstation vendors. The market's end-user demographics primarily consist of engineers, designers, and researchers in various industries. Recent years have witnessed several mergers and acquisitions, with deal volumes estimated at xx million units.
- Market Concentration: Moderately concentrated, with top 5 players holding approximately xx% market share in 2025.
- Technological Innovation: Driven by advancements in processors (e.g., GPUs, CPUs), memory, and storage technologies.
- Regulatory Framework: Compliance with data security regulations (e.g., GDPR) and environmental standards influences product development and operations.
- Competitive Substitutes: Cloud-based EDA solutions present an alternative to traditional workstations.
- End-User Demographics: Primarily engineers, designers, and researchers in electronics, automotive, aerospace, and other related industries.
- M&A Trends: Significant M&A activity observed in the historical period (2019-2024), with xx million units worth of deals. A slight decrease is predicted for the forecast period.
EDA-CAD Workstations Growth Trends & Insights
The EDA-CAD workstation market experienced robust growth during the historical period (2019-2024), driven by factors such as increasing complexity of electronic designs and the growing adoption of advanced manufacturing technologies like 5G and AI. The market size is estimated to be xx million units in 2025, exhibiting a CAGR of xx% during the historical period. Technological disruptions, such as the rise of AI-powered design tools, are transforming the industry. Consumer behavior shifts towards cloud-based solutions and subscription models are also influencing market dynamics. The adoption rate of high-end workstations is expected to continue increasing, fueled by the demand for faster processing power and improved graphics capabilities. The market penetration rate is expected to reach xx% by 2033.
Dominant Regions, Countries, or Segments in EDA-CAD Workstations
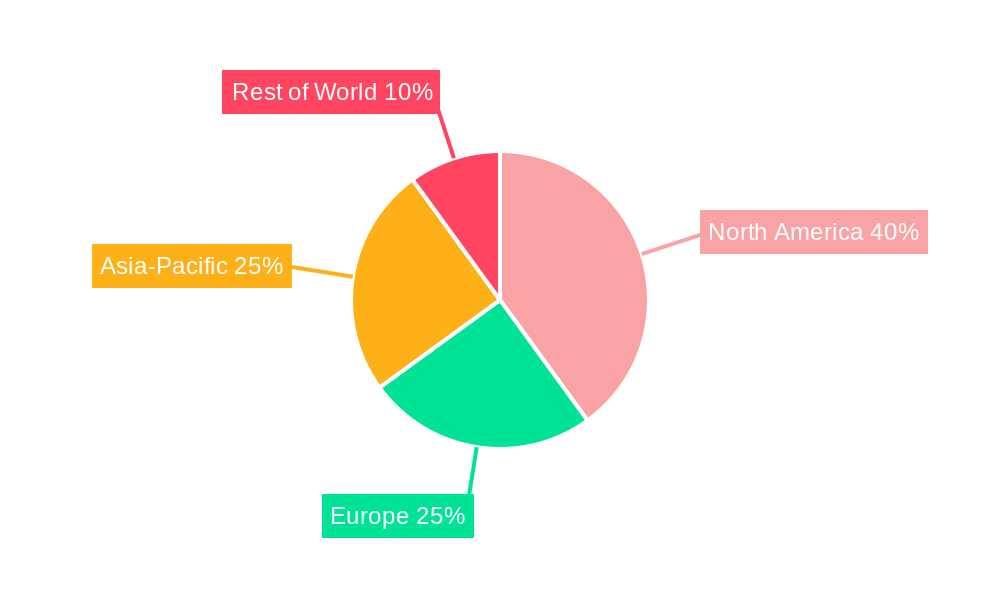
North America currently holds the largest market share in the EDA-CAD workstation market, driven by strong presence of major technology companies, robust R&D investments, and high adoption rates in key industries like semiconductors and aerospace. Asia-Pacific is projected to witness significant growth during the forecast period, fuelled by expanding electronics manufacturing and rising government investments in technology infrastructure.
- Key Drivers in North America: Strong presence of major technology companies, high R&D spending, and early adoption of new technologies.
- Key Drivers in Asia-Pacific: Expansion of electronics manufacturing, rising government investment in technology, and increasing demand from emerging economies.
- Market Share: North America holds approximately xx% market share in 2025, while Asia-Pacific is projected to reach xx% by 2033.
- Growth Potential: High growth potential for Asia-Pacific due to rapid industrialization and technological advancements.
EDA-CAD Workstations Product Landscape
The EDA-CAD workstation market offers a range of products, from entry-level systems for smaller design teams to high-end configurations optimized for complex simulations and rendering. Key features include powerful processors (CPUs and GPUs), high-capacity memory (RAM), and fast storage (SSDs). Recent innovations include AI-accelerated design tools and improved virtualization capabilities, enhancing efficiency and collaboration. Unique selling propositions center around performance, reliability, and specialized software integrations.
Key Drivers, Barriers & Challenges in EDA-CAD Workstations
Key Drivers:
- Increasing complexity of electronic designs.
- Growing demand for advanced simulation and analysis capabilities.
- Rising adoption of advanced manufacturing technologies (e.g., 5G, AI).
Key Challenges:
- High initial investment costs for workstations.
- Supply chain disruptions impacting component availability.
- Intense competition among vendors, leading to price pressure.
- xx million units of lost revenue is estimated due to supply chain issues in 2024.
Emerging Opportunities in EDA-CAD Workstations
- Expansion into emerging markets with high growth potential.
- Development of specialized workstations for specific applications (e.g., automotive design, AI development).
- Increased adoption of cloud-based and hybrid EDA solutions.
Growth Accelerators in the EDA-CAD Workstations Industry
Technological advancements, strategic partnerships, and market expansion strategies are key growth accelerators. Advancements in GPU technology and AI are significantly enhancing the capabilities of EDA-CAD workstations. Strategic collaborations between hardware and software providers are fostering innovation. Expanding into new markets and segments will drive market growth.
Notable Milestones in EDA-CAD Workstations Sector
- 2022 Q4: Nvidia launches new generation of professional GPUs optimized for EDA applications.
- 2023 Q1: AMD announces a new high-performance CPU designed for workstation applications.
- 2024 Q2: Lenovo and HP announce strategic partnerships with EDA software providers.
In-Depth EDA-CAD Workstations Market Outlook
The EDA-CAD workstation market is poised for continued growth driven by technological advancements, industry adoption, and expanding applications. Strategic investments in R&D, coupled with strategic partnerships, will be crucial for companies to maintain a competitive edge. The long-term outlook is positive, with significant opportunities for innovation and market expansion.
EDA-CAD Workstations Segmentation
-
1. Application
- 1.1. Aerospace
- 1.2. Automotive
- 1.3. Ship
- 1.4. Architecture
- 1.5. Art
- 1.6. Others
-
2. Types
- 2.1. Fixed
- 2.2. Mobile
EDA-CAD Workstations Segmentation By Geography
-
1. North America
- 1.1. United States
- 1.2. Canada
- 1.3. Mexico
-
2. South America
- 2.1. Brazil
- 2.2. Argentina
- 2.3. Rest of South America
-
3. Europe
- 3.1. United Kingdom
- 3.2. Germany
- 3.3. France
- 3.4. Italy
- 3.5. Spain
- 3.6. Russia
- 3.7. Benelux
- 3.8. Nordics
- 3.9. Rest of Europe
-
4. Middle East & Africa
- 4.1. Turkey
- 4.2. Israel
- 4.3. GCC
- 4.4. North Africa
- 4.5. South Africa
- 4.6. Rest of Middle East & Africa
-
5. Asia Pacific
- 5.1. China
- 5.2. India
- 5.3. Japan
- 5.4. South Korea
- 5.5. ASEAN
- 5.6. Oceania
- 5.7. Rest of Asia Pacific
EDA-CAD Workstations Regional Market Share
Geographic Coverage of EDA-CAD Workstations
EDA-CAD Workstations REPORT HIGHLIGHTS
| Aspects | Details |
|---|---|
| Study Period | 2020-2034 |
| Base Year | 2025 |
| Estimated Year | 2026 |
| Forecast Period | 2026-2034 |
| Historical Period | 2020-2025 |
| Growth Rate | CAGR of 9.62% from 2020-2034 |
| Segmentation |
|
Table of Contents
- 1. Introduction
- 1.1. Research Scope
- 1.2. Market Segmentation
- 1.3. Research Methodology
- 1.4. Definitions and Assumptions
- 2. Executive Summary
- 2.1. Introduction
- 3. Market Dynamics
- 3.1. Introduction
- 3.2. Market Drivers
- 3.3. Market Restrains
- 3.4. Market Trends
- 4. Market Factor Analysis
- 4.1. Porters Five Forces
- 4.2. Supply/Value Chain
- 4.3. PESTEL analysis
- 4.4. Market Entropy
- 4.5. Patent/Trademark Analysis
- 5. Global EDA-CAD Workstations Analysis, Insights and Forecast, 2020-2032
- 5.1. Market Analysis, Insights and Forecast - by Application
- 5.1.1. Aerospace
- 5.1.2. Automotive
- 5.1.3. Ship
- 5.1.4. Architecture
- 5.1.5. Art
- 5.1.6. Others
- 5.2. Market Analysis, Insights and Forecast - by Types
- 5.2.1. Fixed
- 5.2.2. Mobile
- 5.3. Market Analysis, Insights and Forecast - by Region
- 5.3.1. North America
- 5.3.2. South America
- 5.3.3. Europe
- 5.3.4. Middle East & Africa
- 5.3.5. Asia Pacific
- 5.1. Market Analysis, Insights and Forecast - by Application
- 6. North America EDA-CAD Workstations Analysis, Insights and Forecast, 2020-2032
- 6.1. Market Analysis, Insights and Forecast - by Application
- 6.1.1. Aerospace
- 6.1.2. Automotive
- 6.1.3. Ship
- 6.1.4. Architecture
- 6.1.5. Art
- 6.1.6. Others
- 6.2. Market Analysis, Insights and Forecast - by Types
- 6.2.1. Fixed
- 6.2.2. Mobile
- 6.1. Market Analysis, Insights and Forecast - by Application
- 7. South America EDA-CAD Workstations Analysis, Insights and Forecast, 2020-2032
- 7.1. Market Analysis, Insights and Forecast - by Application
- 7.1.1. Aerospace
- 7.1.2. Automotive
- 7.1.3. Ship
- 7.1.4. Architecture
- 7.1.5. Art
- 7.1.6. Others
- 7.2. Market Analysis, Insights and Forecast - by Types
- 7.2.1. Fixed
- 7.2.2. Mobile
- 7.1. Market Analysis, Insights and Forecast - by Application
- 8. Europe EDA-CAD Workstations Analysis, Insights and Forecast, 2020-2032
- 8.1. Market Analysis, Insights and Forecast - by Application
- 8.1.1. Aerospace
- 8.1.2. Automotive
- 8.1.3. Ship
- 8.1.4. Architecture
- 8.1.5. Art
- 8.1.6. Others
- 8.2. Market Analysis, Insights and Forecast - by Types
- 8.2.1. Fixed
- 8.2.2. Mobile
- 8.1. Market Analysis, Insights and Forecast - by Application
- 9. Middle East & Africa EDA-CAD Workstations Analysis, Insights and Forecast, 2020-2032
- 9.1. Market Analysis, Insights and Forecast - by Application
- 9.1.1. Aerospace
- 9.1.2. Automotive
- 9.1.3. Ship
- 9.1.4. Architecture
- 9.1.5. Art
- 9.1.6. Others
- 9.2. Market Analysis, Insights and Forecast - by Types
- 9.2.1. Fixed
- 9.2.2. Mobile
- 9.1. Market Analysis, Insights and Forecast - by Application
- 10. Asia Pacific EDA-CAD Workstations Analysis, Insights and Forecast, 2020-2032
- 10.1. Market Analysis, Insights and Forecast - by Application
- 10.1.1. Aerospace
- 10.1.2. Automotive
- 10.1.3. Ship
- 10.1.4. Architecture
- 10.1.5. Art
- 10.1.6. Others
- 10.2. Market Analysis, Insights and Forecast - by Types
- 10.2.1. Fixed
- 10.2.2. Mobile
- 10.1. Market Analysis, Insights and Forecast - by Application
- 11. Competitive Analysis
- 11.1. Global Market Share Analysis 2025
- 11.2. Company Profiles
- 11.2.1 Nvidia
- 11.2.1.1. Overview
- 11.2.1.2. Products
- 11.2.1.3. SWOT Analysis
- 11.2.1.4. Recent Developments
- 11.2.1.5. Financials (Based on Availability)
- 11.2.2 Apple
- 11.2.2.1. Overview
- 11.2.2.2. Products
- 11.2.2.3. SWOT Analysis
- 11.2.2.4. Recent Developments
- 11.2.2.5. Financials (Based on Availability)
- 11.2.3 Microsoft
- 11.2.3.1. Overview
- 11.2.3.2. Products
- 11.2.3.3. SWOT Analysis
- 11.2.3.4. Recent Developments
- 11.2.3.5. Financials (Based on Availability)
- 11.2.4 AMD
- 11.2.4.1. Overview
- 11.2.4.2. Products
- 11.2.4.3. SWOT Analysis
- 11.2.4.4. Recent Developments
- 11.2.4.5. Financials (Based on Availability)
- 11.2.5 Lenovo
- 11.2.5.1. Overview
- 11.2.5.2. Products
- 11.2.5.3. SWOT Analysis
- 11.2.5.4. Recent Developments
- 11.2.5.5. Financials (Based on Availability)
- 11.2.6 HP
- 11.2.6.1. Overview
- 11.2.6.2. Products
- 11.2.6.3. SWOT Analysis
- 11.2.6.4. Recent Developments
- 11.2.6.5. Financials (Based on Availability)
- 11.2.7 Dell
- 11.2.7.1. Overview
- 11.2.7.2. Products
- 11.2.7.3. SWOT Analysis
- 11.2.7.4. Recent Developments
- 11.2.7.5. Financials (Based on Availability)
- 11.2.8 Fujitsu
- 11.2.8.1. Overview
- 11.2.8.2. Products
- 11.2.8.3. SWOT Analysis
- 11.2.8.4. Recent Developments
- 11.2.8.5. Financials (Based on Availability)
- 11.2.9 SYMMATRIX
- 11.2.9.1. Overview
- 11.2.9.2. Products
- 11.2.9.3. SWOT Analysis
- 11.2.9.4. Recent Developments
- 11.2.9.5. Financials (Based on Availability)
- 11.2.10 CADnetwork
- 11.2.10.1. Overview
- 11.2.10.2. Products
- 11.2.10.3. SWOT Analysis
- 11.2.10.4. Recent Developments
- 11.2.10.5. Financials (Based on Availability)
- 11.2.11 Signa
- 11.2.11.1. Overview
- 11.2.11.2. Products
- 11.2.11.3. SWOT Analysis
- 11.2.11.4. Recent Developments
- 11.2.11.5. Financials (Based on Availability)
- 11.2.12 Supermicro
- 11.2.12.1. Overview
- 11.2.12.2. Products
- 11.2.12.3. SWOT Analysis
- 11.2.12.4. Recent Developments
- 11.2.12.5. Financials (Based on Availability)
- 11.2.13 Acer
- 11.2.13.1. Overview
- 11.2.13.2. Products
- 11.2.13.3. SWOT Analysis
- 11.2.13.4. Recent Developments
- 11.2.13.5. Financials (Based on Availability)
- 11.2.14 Cadence
- 11.2.14.1. Overview
- 11.2.14.2. Products
- 11.2.14.3. SWOT Analysis
- 11.2.14.4. Recent Developments
- 11.2.14.5. Financials (Based on Availability)
- 11.2.15 Broadberry
- 11.2.15.1. Overview
- 11.2.15.2. Products
- 11.2.15.3. SWOT Analysis
- 11.2.15.4. Recent Developments
- 11.2.15.5. Financials (Based on Availability)
- 11.2.16 Novatech
- 11.2.16.1. Overview
- 11.2.16.2. Products
- 11.2.16.3. SWOT Analysis
- 11.2.16.4. Recent Developments
- 11.2.16.5. Financials (Based on Availability)
- 11.2.17 Titan Computers
- 11.2.17.1. Overview
- 11.2.17.2. Products
- 11.2.17.3. SWOT Analysis
- 11.2.17.4. Recent Developments
- 11.2.17.5. Financials (Based on Availability)
- 11.2.18 AVADirect
- 11.2.18.1. Overview
- 11.2.18.2. Products
- 11.2.18.3. SWOT Analysis
- 11.2.18.4. Recent Developments
- 11.2.18.5. Financials (Based on Availability)
- 11.2.19 Scan 3XS
- 11.2.19.1. Overview
- 11.2.19.2. Products
- 11.2.19.3. SWOT Analysis
- 11.2.19.4. Recent Developments
- 11.2.19.5. Financials (Based on Availability)
- 11.2.20 Mentor Graphics
- 11.2.20.1. Overview
- 11.2.20.2. Products
- 11.2.20.3. SWOT Analysis
- 11.2.20.4. Recent Developments
- 11.2.20.5. Financials (Based on Availability)
- 11.2.21 Beelink
- 11.2.21.1. Overview
- 11.2.21.2. Products
- 11.2.21.3. SWOT Analysis
- 11.2.21.4. Recent Developments
- 11.2.21.5. Financials (Based on Availability)
- 11.2.22 Xi An Kunlong Computer Technology
- 11.2.22.1. Overview
- 11.2.22.2. Products
- 11.2.22.3. SWOT Analysis
- 11.2.22.4. Recent Developments
- 11.2.22.5. Financials (Based on Availability)
- 11.2.1 Nvidia
List of Figures
- Figure 1: Global EDA-CAD Workstations Revenue Breakdown (billion, %) by Region 2025 & 2033
- Figure 2: North America EDA-CAD Workstations Revenue (billion), by Application 2025 & 2033
- Figure 3: North America EDA-CAD Workstations Revenue Share (%), by Application 2025 & 2033
- Figure 4: North America EDA-CAD Workstations Revenue (billion), by Types 2025 & 2033
- Figure 5: North America EDA-CAD Workstations Revenue Share (%), by Types 2025 & 2033
- Figure 6: North America EDA-CAD Workstations Revenue (billion), by Country 2025 & 2033
- Figure 7: North America EDA-CAD Workstations Revenue Share (%), by Country 2025 & 2033
- Figure 8: South America EDA-CAD Workstations Revenue (billion), by Application 2025 & 2033
- Figure 9: South America EDA-CAD Workstations Revenue Share (%), by Application 2025 & 2033
- Figure 10: South America EDA-CAD Workstations Revenue (billion), by Types 2025 & 2033
- Figure 11: South America EDA-CAD Workstations Revenue Share (%), by Types 2025 & 2033
- Figure 12: South America EDA-CAD Workstations Revenue (billion), by Country 2025 & 2033
- Figure 13: South America EDA-CAD Workstations Revenue Share (%), by Country 2025 & 2033
- Figure 14: Europe EDA-CAD Workstations Revenue (billion), by Application 2025 & 2033
- Figure 15: Europe EDA-CAD Workstations Revenue Share (%), by Application 2025 & 2033
- Figure 16: Europe EDA-CAD Workstations Revenue (billion), by Types 2025 & 2033
- Figure 17: Europe EDA-CAD Workstations Revenue Share (%), by Types 2025 & 2033
- Figure 18: Europe EDA-CAD Workstations Revenue (billion), by Country 2025 & 2033
- Figure 19: Europe EDA-CAD Workstations Revenue Share (%), by Country 2025 & 2033
- Figure 20: Middle East & Africa EDA-CAD Workstations Revenue (billion), by Application 2025 & 2033
- Figure 21: Middle East & Africa EDA-CAD Workstations Revenue Share (%), by Application 2025 & 2033
- Figure 22: Middle East & Africa EDA-CAD Workstations Revenue (billion), by Types 2025 & 2033
- Figure 23: Middle East & Africa EDA-CAD Workstations Revenue Share (%), by Types 2025 & 2033
- Figure 24: Middle East & Africa EDA-CAD Workstations Revenue (billion), by Country 2025 & 2033
- Figure 25: Middle East & Africa EDA-CAD Workstations Revenue Share (%), by Country 2025 & 2033
- Figure 26: Asia Pacific EDA-CAD Workstations Revenue (billion), by Application 2025 & 2033
- Figure 27: Asia Pacific EDA-CAD Workstations Revenue Share (%), by Application 2025 & 2033
- Figure 28: Asia Pacific EDA-CAD Workstations Revenue (billion), by Types 2025 & 2033
- Figure 29: Asia Pacific EDA-CAD Workstations Revenue Share (%), by Types 2025 & 2033
- Figure 30: Asia Pacific EDA-CAD Workstations Revenue (billion), by Country 2025 & 2033
- Figure 31: Asia Pacific EDA-CAD Workstations Revenue Share (%), by Country 2025 & 2033
List of Tables
- Table 1: Global EDA-CAD Workstations Revenue billion Forecast, by Application 2020 & 2033
- Table 2: Global EDA-CAD Workstations Revenue billion Forecast, by Types 2020 & 2033
- Table 3: Global EDA-CAD Workstations Revenue billion Forecast, by Region 2020 & 2033
- Table 4: Global EDA-CAD Workstations Revenue billion Forecast, by Application 2020 & 2033
- Table 5: Global EDA-CAD Workstations Revenue billion Forecast, by Types 2020 & 2033
- Table 6: Global EDA-CAD Workstations Revenue billion Forecast, by Country 2020 & 2033
- Table 7: United States EDA-CAD Workstations Revenue (billion) Forecast, by Application 2020 & 2033
- Table 8: Canada EDA-CAD Workstations Revenue (billion) Forecast, by Application 2020 & 2033
- Table 9: Mexico EDA-CAD Workstations Revenue (billion) Forecast, by Application 2020 & 2033
- Table 10: Global EDA-CAD Workstations Revenue billion Forecast, by Application 2020 & 2033
- Table 11: Global EDA-CAD Workstations Revenue billion Forecast, by Types 2020 & 2033
- Table 12: Global EDA-CAD Workstations Revenue billion Forecast, by Country 2020 & 2033
- Table 13: Brazil EDA-CAD Workstations Revenue (billion) Forecast, by Application 2020 & 2033
- Table 14: Argentina EDA-CAD Workstations Revenue (billion) Forecast, by Application 2020 & 2033
- Table 15: Rest of South America EDA-CAD Workstations Revenue (billion) Forecast, by Application 2020 & 2033
- Table 16: Global EDA-CAD Workstations Revenue billion Forecast, by Application 2020 & 2033
- Table 17: Global EDA-CAD Workstations Revenue billion Forecast, by Types 2020 & 2033
- Table 18: Global EDA-CAD Workstations Revenue billion Forecast, by Country 2020 & 2033
- Table 19: United Kingdom EDA-CAD Workstations Revenue (billion) Forecast, by Application 2020 & 2033
- Table 20: Germany EDA-CAD Workstations Revenue (billion) Forecast, by Application 2020 & 2033
- Table 21: France EDA-CAD Workstations Revenue (billion) Forecast, by Application 2020 & 2033
- Table 22: Italy EDA-CAD Workstations Revenue (billion) Forecast, by Application 2020 & 2033
- Table 23: Spain EDA-CAD Workstations Revenue (billion) Forecast, by Application 2020 & 2033
- Table 24: Russia EDA-CAD Workstations Revenue (billion) Forecast, by Application 2020 & 2033
- Table 25: Benelux EDA-CAD Workstations Revenue (billion) Forecast, by Application 2020 & 2033
- Table 26: Nordics EDA-CAD Workstations Revenue (billion) Forecast, by Application 2020 & 2033
- Table 27: Rest of Europe EDA-CAD Workstations Revenue (billion) Forecast, by Application 2020 & 2033
- Table 28: Global EDA-CAD Workstations Revenue billion Forecast, by Application 2020 & 2033
- Table 29: Global EDA-CAD Workstations Revenue billion Forecast, by Types 2020 & 2033
- Table 30: Global EDA-CAD Workstations Revenue billion Forecast, by Country 2020 & 2033
- Table 31: Turkey EDA-CAD Workstations Revenue (billion) Forecast, by Application 2020 & 2033
- Table 32: Israel EDA-CAD Workstations Revenue (billion) Forecast, by Application 2020 & 2033
- Table 33: GCC EDA-CAD Workstations Revenue (billion) Forecast, by Application 2020 & 2033
- Table 34: North Africa EDA-CAD Workstations Revenue (billion) Forecast, by Application 2020 & 2033
- Table 35: South Africa EDA-CAD Workstations Revenue (billion) Forecast, by Application 2020 & 2033
- Table 36: Rest of Middle East & Africa EDA-CAD Workstations Revenue (billion) Forecast, by Application 2020 & 2033
- Table 37: Global EDA-CAD Workstations Revenue billion Forecast, by Application 2020 & 2033
- Table 38: Global EDA-CAD Workstations Revenue billion Forecast, by Types 2020 & 2033
- Table 39: Global EDA-CAD Workstations Revenue billion Forecast, by Country 2020 & 2033
- Table 40: China EDA-CAD Workstations Revenue (billion) Forecast, by Application 2020 & 2033
- Table 41: India EDA-CAD Workstations Revenue (billion) Forecast, by Application 2020 & 2033
- Table 42: Japan EDA-CAD Workstations Revenue (billion) Forecast, by Application 2020 & 2033
- Table 43: South Korea EDA-CAD Workstations Revenue (billion) Forecast, by Application 2020 & 2033
- Table 44: ASEAN EDA-CAD Workstations Revenue (billion) Forecast, by Application 2020 & 2033
- Table 45: Oceania EDA-CAD Workstations Revenue (billion) Forecast, by Application 2020 & 2033
- Table 46: Rest of Asia Pacific EDA-CAD Workstations Revenue (billion) Forecast, by Application 2020 & 2033
Frequently Asked Questions
1. What is the projected Compound Annual Growth Rate (CAGR) of the EDA-CAD Workstations?
The projected CAGR is approximately 9.62%.
2. Which companies are prominent players in the EDA-CAD Workstations?
Key companies in the market include Nvidia, Apple, Microsoft, AMD, Lenovo, HP, Dell, Fujitsu, SYMMATRIX, CADnetwork, Signa, Supermicro, Acer, Cadence, Broadberry, Novatech, Titan Computers, AVADirect, Scan 3XS, Mentor Graphics, Beelink, Xi An Kunlong Computer Technology.
3. What are the main segments of the EDA-CAD Workstations?
The market segments include Application, Types.
4. Can you provide details about the market size?
The market size is estimated to be USD 3.45 billion as of 2022.
5. What are some drivers contributing to market growth?
N/A
6. What are the notable trends driving market growth?
N/A
7. Are there any restraints impacting market growth?
N/A
8. Can you provide examples of recent developments in the market?
N/A
9. What pricing options are available for accessing the report?
Pricing options include single-user, multi-user, and enterprise licenses priced at USD 4900.00, USD 7350.00, and USD 9800.00 respectively.
10. Is the market size provided in terms of value or volume?
The market size is provided in terms of value, measured in billion.
11. Are there any specific market keywords associated with the report?
Yes, the market keyword associated with the report is "EDA-CAD Workstations," which aids in identifying and referencing the specific market segment covered.
12. How do I determine which pricing option suits my needs best?
The pricing options vary based on user requirements and access needs. Individual users may opt for single-user licenses, while businesses requiring broader access may choose multi-user or enterprise licenses for cost-effective access to the report.
13. Are there any additional resources or data provided in the EDA-CAD Workstations report?
While the report offers comprehensive insights, it's advisable to review the specific contents or supplementary materials provided to ascertain if additional resources or data are available.
14. How can I stay updated on further developments or reports in the EDA-CAD Workstations?
To stay informed about further developments, trends, and reports in the EDA-CAD Workstations, consider subscribing to industry newsletters, following relevant companies and organizations, or regularly checking reputable industry news sources and publications.
Methodology
Step 1 - Identification of Relevant Samples Size from Population Database


Step 2 - Approaches for Defining Global Market Size (Value, Volume* & Price*)

Note*: In applicable scenarios
Step 3 - Data Sources
Primary Research
- Web Analytics
- Survey Reports
- Research Institute
- Latest Research Reports
- Opinion Leaders
Secondary Research
- Annual Reports
- White Paper
- Latest Press Release
- Industry Association
- Paid Database
- Investor Presentations

Step 4 - Data Triangulation
Involves using different sources of information in order to increase the validity of a study
These sources are likely to be stakeholders in a program - participants, other researchers, program staff, other community members, and so on.
Then we put all data in single framework & apply various statistical tools to find out the dynamic on the market.
During the analysis stage, feedback from the stakeholder groups would be compared to determine areas of agreement as well as areas of divergence