

Key Insights
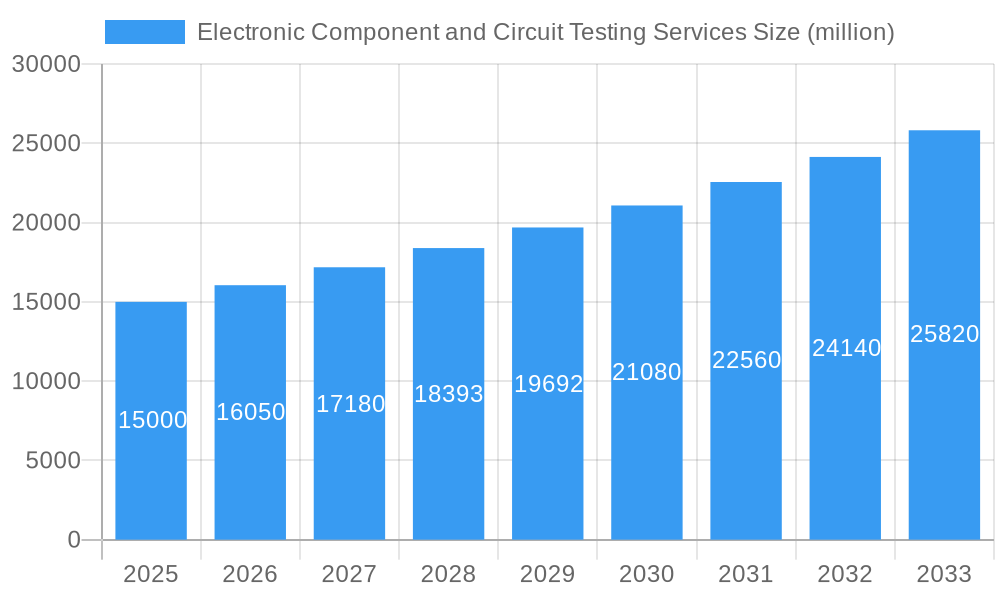
The Electronic Component and Circuit Testing Services market is experiencing robust growth, driven by the increasing complexity of electronic devices and the rising demand for higher quality and reliability in diverse sectors like automotive, aerospace, and consumer electronics. The market, estimated at $15 billion in 2025, is projected to witness a Compound Annual Growth Rate (CAGR) of 7% from 2025 to 2033, reaching approximately $25 billion by 2033. This growth is fueled by several key trends, including the adoption of advanced testing technologies like automated optical inspection (AOI) and functional testing, the rise of Internet of Things (IoT) devices necessitating rigorous testing, and the increasing focus on ensuring product safety and reliability. Furthermore, the miniaturization of electronic components and the emergence of new materials necessitate more sophisticated and precise testing methods, driving market expansion. However, the high cost of advanced testing equipment and the skilled workforce required for operation present challenges to market growth. Competitive pressures from a range of established players like Teledyne LeCroy, Teradyne, and Tektronix, alongside emerging companies, are also shaping market dynamics.
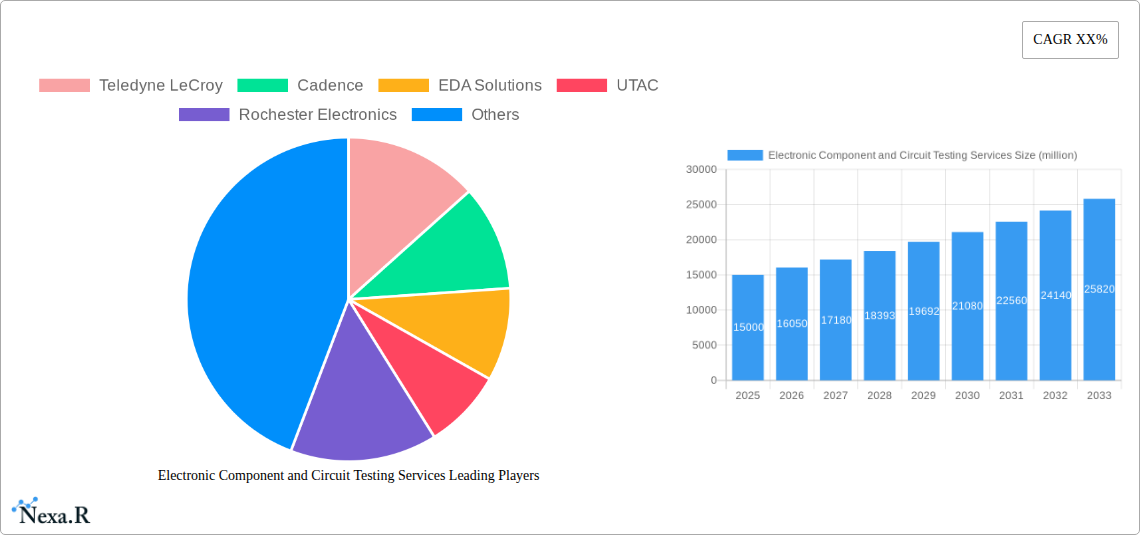
Electronic Component and Circuit Testing Services Market Size (In Billion)
The market segmentation reveals significant opportunities across various sectors. Automotive electronics are expected to lead growth, driven by the increasing adoption of advanced driver-assistance systems (ADAS) and electric vehicles. The aerospace and defense sectors, demanding stringent quality and reliability standards, also contribute significantly to market demand. Regional variations are likely to emerge, with North America and Asia-Pacific potentially dominating the market share due to the presence of major manufacturers and a strong focus on technological advancement in these regions. To maintain a competitive edge, companies are investing heavily in research and development to improve testing efficiency and accuracy, while also focusing on providing comprehensive solutions that integrate testing across the entire product lifecycle. The ongoing evolution of testing technologies and standards will continue to shape the future landscape of this dynamic market.
Electronic Component and Circuit Testing Services Company Market Share
Electronic Component and Circuit Testing Services Market Report: 2019-2033
This comprehensive report provides a detailed analysis of the Electronic Component and Circuit Testing Services market, offering invaluable insights for industry professionals, investors, and strategic decision-makers. The report covers the period from 2019 to 2033, with a focus on the forecast period from 2025 to 2033 and a base year of 2025. The market is segmented by various factors (specific segments will be detailed in the full report), providing a granular understanding of its dynamics and growth trajectory. The total market size in 2025 is estimated at XX million units.
Electronic Component and Circuit Testing Services Market Dynamics & Structure
The Electronic Component and Circuit Testing Services market is characterized by moderate concentration, with a few major players holding significant market share. The market is driven by technological advancements in semiconductor manufacturing, increasing demand for high-reliability components in diverse industries (automotive, aerospace, consumer electronics), and stringent regulatory compliance requirements. Mergers and acquisitions (M&A) activity is a notable trend, with larger companies strategically acquiring smaller players to expand their product portfolios and geographic reach. However, high entry barriers related to specialized expertise and capital investments limit new entrants. Competitive product substitutes, particularly automated testing systems, are continuously evolving, further shaping market dynamics.
- Market Concentration: Moderately concentrated, with the top 5 players holding approximately XX% market share in 2025.
- Technological Innovation Drivers: Advancements in AI, machine learning, and high-frequency testing capabilities.
- Regulatory Frameworks: Stringent quality and safety standards imposed by government bodies drive demand for robust testing services.
- Competitive Product Substitutes: Automated testing solutions and cloud-based testing platforms.
- End-User Demographics: Significant demand from automotive, aerospace, telecommunications, and consumer electronics industries.
- M&A Trends: An average of XX M&A deals per year observed during 2019-2024.
Electronic Component and Circuit Testing Services Growth Trends & Insights
The Electronic Component and Circuit Testing Services market exhibited steady growth during the historical period (2019-2024), driven primarily by the increasing adoption of sophisticated electronic components across multiple industries. The market experienced a compound annual growth rate (CAGR) of XX% during this period. Technological disruptions, such as the rise of 5G and the Internet of Things (IoT), fueled demand for advanced testing services. Consumer behavior shifts towards greater reliance on electronic devices are also contributing factors. The forecast period (2025-2033) is projected to witness continued growth, propelled by emerging technologies and expanding applications. Market penetration is expected to reach XX% by 2033. (Specific data will be provided in the full report, replacing XXX).
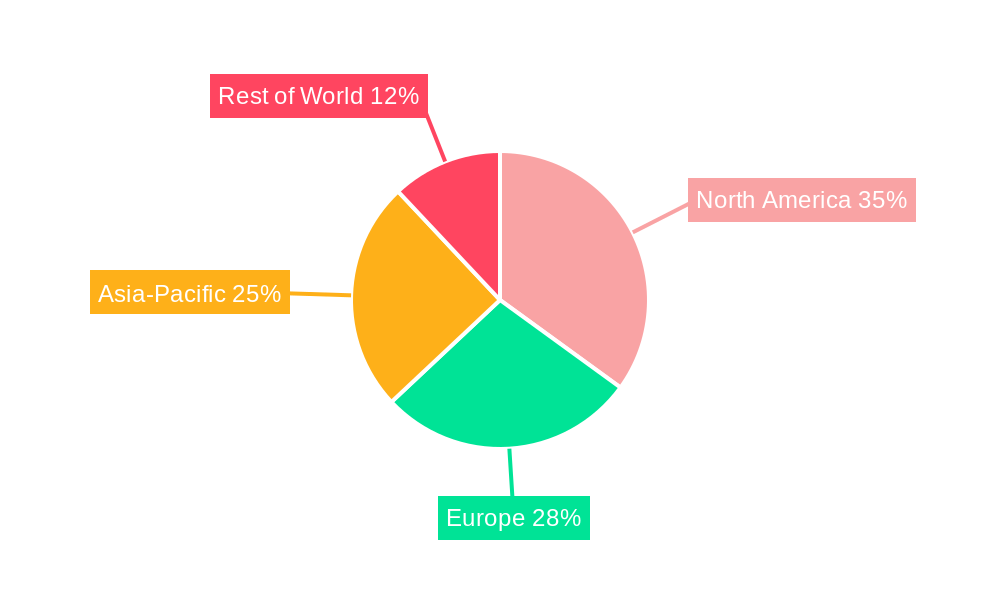
Dominant Regions, Countries, or Segments in Electronic Component and Circuit Testing Services
North America currently holds the largest market share in the Electronic Component and Circuit Testing Services sector, driven by a robust electronics manufacturing base, significant investments in R&D, and strong regulatory frameworks. Asia-Pacific is expected to experience the fastest growth during the forecast period, fueled by rapid industrialization, expanding consumer electronics markets, and supportive government policies.
- North America: Strong regulatory compliance, established electronics manufacturing, and high R&D investments.
- Asia-Pacific: Rapid industrialization, growing consumer electronics market, and supportive government initiatives.
- Europe: Focus on sustainable technologies and high-quality standards.
Electronic Component and Circuit Testing Services Product Landscape
The market offers a diverse range of testing services, catering to various electronic components and circuits. Innovations focus on improving accuracy, speed, and automation. Advanced technologies like AI-powered diagnostic tools and high-speed signal analysis are enhancing testing capabilities. Unique selling propositions include customized testing solutions, faster turnaround times, and comprehensive reporting.
Key Drivers, Barriers & Challenges in Electronic Component and Circuit Testing Services
Key Drivers:
- Growing demand for high-reliability components across industries.
- Advancements in semiconductor technology and miniaturization.
- Stringent regulatory requirements for product safety and performance.
Key Challenges:
- High capital investment required for advanced testing equipment.
- Skilled labor shortage in the electronics testing industry.
- Intense competition among established players and the emergence of new technologies.
Emerging Opportunities in Electronic Component and Circuit Testing Services
Emerging opportunities lie in the growing demand for testing services in the automotive, aerospace, and medical device industries. The increasing adoption of IoT and 5G technologies will further create new avenues for specialized testing services. Expansion into emerging markets and strategic partnerships offer significant growth potential.
Growth Accelerators in the Electronic Component and Circuit Testing Services Industry
Technological breakthroughs in testing equipment, such as AI-powered diagnostic tools and high-frequency testing capabilities, are key growth accelerators. Strategic partnerships and collaborations between testing service providers and semiconductor manufacturers will also drive growth. Expansion into emerging markets and the development of customized testing solutions for specific applications will further contribute to market expansion.
Key Players Shaping the Electronic Component and Circuit Testing Services Market
- Teledyne LeCroy
- Cadence
- EDA Solutions
- UTAC
- Rochester Electronics
- Sandtek
- Hongke Electronic Technology Co.,LTD
- Beijing Oriental System Integration Co.,Ltd.
- Teradyne
- Tektronix
Notable Milestones in Electronic Component and Circuit Testing Services Sector
- 2021: Introduction of AI-powered diagnostic tools by Teledyne LeCroy.
- 2022: Strategic partnership between Cadence and a major semiconductor manufacturer.
- 2023: Acquisition of a smaller testing firm by Teradyne.
- (Further milestones will be detailed in the full report)
In-Depth Electronic Component and Circuit Testing Services Market Outlook
The Electronic Component and Circuit Testing Services market is poised for continued growth, driven by technological advancements, expanding applications, and increasing demand from diverse industries. Strategic partnerships, expansion into emerging markets, and the development of customized testing solutions will play crucial roles in shaping future market dynamics. The market presents significant opportunities for established players and new entrants alike.
Electronic Component and Circuit Testing Services Segmentation
-
1. Application
- 1.1. Communication
- 1.2. Medical
- 1.3. Automobile
- 1.4. Industrial
- 1.5. Aerospace
- 1.6. Others
-
2. Types
- 2.1. On-site Testing
- 2.2. Off-site Testing
Electronic Component and Circuit Testing Services Segmentation By Geography
-
1. North America
- 1.1. United States
- 1.2. Canada
- 1.3. Mexico
-
2. South America
- 2.1. Brazil
- 2.2. Argentina
- 2.3. Rest of South America
-
3. Europe
- 3.1. United Kingdom
- 3.2. Germany
- 3.3. France
- 3.4. Italy
- 3.5. Spain
- 3.6. Russia
- 3.7. Benelux
- 3.8. Nordics
- 3.9. Rest of Europe
-
4. Middle East & Africa
- 4.1. Turkey
- 4.2. Israel
- 4.3. GCC
- 4.4. North Africa
- 4.5. South Africa
- 4.6. Rest of Middle East & Africa
-
5. Asia Pacific
- 5.1. China
- 5.2. India
- 5.3. Japan
- 5.4. South Korea
- 5.5. ASEAN
- 5.6. Oceania
- 5.7. Rest of Asia Pacific
Electronic Component and Circuit Testing Services Regional Market Share
Geographic Coverage of Electronic Component and Circuit Testing Services
Electronic Component and Circuit Testing Services REPORT HIGHLIGHTS
| Aspects | Details |
|---|---|
| Study Period | 2020-2034 |
| Base Year | 2025 |
| Estimated Year | 2026 |
| Forecast Period | 2026-2034 |
| Historical Period | 2020-2025 |
| Growth Rate | CAGR of XX% from 2020-2034 |
| Segmentation |
|
Table of Contents
- 1. Introduction
- 1.1. Research Scope
- 1.2. Market Segmentation
- 1.3. Research Methodology
- 1.4. Definitions and Assumptions
- 2. Executive Summary
- 2.1. Introduction
- 3. Market Dynamics
- 3.1. Introduction
- 3.2. Market Drivers
- 3.3. Market Restrains
- 3.4. Market Trends
- 4. Market Factor Analysis
- 4.1. Porters Five Forces
- 4.2. Supply/Value Chain
- 4.3. PESTEL analysis
- 4.4. Market Entropy
- 4.5. Patent/Trademark Analysis
- 5. Global Electronic Component and Circuit Testing Services Analysis, Insights and Forecast, 2020-2032
- 5.1. Market Analysis, Insights and Forecast - by Application
- 5.1.1. Communication
- 5.1.2. Medical
- 5.1.3. Automobile
- 5.1.4. Industrial
- 5.1.5. Aerospace
- 5.1.6. Others
- 5.2. Market Analysis, Insights and Forecast - by Types
- 5.2.1. On-site Testing
- 5.2.2. Off-site Testing
- 5.3. Market Analysis, Insights and Forecast - by Region
- 5.3.1. North America
- 5.3.2. South America
- 5.3.3. Europe
- 5.3.4. Middle East & Africa
- 5.3.5. Asia Pacific
- 5.1. Market Analysis, Insights and Forecast - by Application
- 6. North America Electronic Component and Circuit Testing Services Analysis, Insights and Forecast, 2020-2032
- 6.1. Market Analysis, Insights and Forecast - by Application
- 6.1.1. Communication
- 6.1.2. Medical
- 6.1.3. Automobile
- 6.1.4. Industrial
- 6.1.5. Aerospace
- 6.1.6. Others
- 6.2. Market Analysis, Insights and Forecast - by Types
- 6.2.1. On-site Testing
- 6.2.2. Off-site Testing
- 6.1. Market Analysis, Insights and Forecast - by Application
- 7. South America Electronic Component and Circuit Testing Services Analysis, Insights and Forecast, 2020-2032
- 7.1. Market Analysis, Insights and Forecast - by Application
- 7.1.1. Communication
- 7.1.2. Medical
- 7.1.3. Automobile
- 7.1.4. Industrial
- 7.1.5. Aerospace
- 7.1.6. Others
- 7.2. Market Analysis, Insights and Forecast - by Types
- 7.2.1. On-site Testing
- 7.2.2. Off-site Testing
- 7.1. Market Analysis, Insights and Forecast - by Application
- 8. Europe Electronic Component and Circuit Testing Services Analysis, Insights and Forecast, 2020-2032
- 8.1. Market Analysis, Insights and Forecast - by Application
- 8.1.1. Communication
- 8.1.2. Medical
- 8.1.3. Automobile
- 8.1.4. Industrial
- 8.1.5. Aerospace
- 8.1.6. Others
- 8.2. Market Analysis, Insights and Forecast - by Types
- 8.2.1. On-site Testing
- 8.2.2. Off-site Testing
- 8.1. Market Analysis, Insights and Forecast - by Application
- 9. Middle East & Africa Electronic Component and Circuit Testing Services Analysis, Insights and Forecast, 2020-2032
- 9.1. Market Analysis, Insights and Forecast - by Application
- 9.1.1. Communication
- 9.1.2. Medical
- 9.1.3. Automobile
- 9.1.4. Industrial
- 9.1.5. Aerospace
- 9.1.6. Others
- 9.2. Market Analysis, Insights and Forecast - by Types
- 9.2.1. On-site Testing
- 9.2.2. Off-site Testing
- 9.1. Market Analysis, Insights and Forecast - by Application
- 10. Asia Pacific Electronic Component and Circuit Testing Services Analysis, Insights and Forecast, 2020-2032
- 10.1. Market Analysis, Insights and Forecast - by Application
- 10.1.1. Communication
- 10.1.2. Medical
- 10.1.3. Automobile
- 10.1.4. Industrial
- 10.1.5. Aerospace
- 10.1.6. Others
- 10.2. Market Analysis, Insights and Forecast - by Types
- 10.2.1. On-site Testing
- 10.2.2. Off-site Testing
- 10.1. Market Analysis, Insights and Forecast - by Application
- 11. Competitive Analysis
- 11.1. Global Market Share Analysis 2025
- 11.2. Company Profiles
- 11.2.1 Teledyne LeCroy
- 11.2.1.1. Overview
- 11.2.1.2. Products
- 11.2.1.3. SWOT Analysis
- 11.2.1.4. Recent Developments
- 11.2.1.5. Financials (Based on Availability)
- 11.2.2 Cadence
- 11.2.2.1. Overview
- 11.2.2.2. Products
- 11.2.2.3. SWOT Analysis
- 11.2.2.4. Recent Developments
- 11.2.2.5. Financials (Based on Availability)
- 11.2.3 EDA Solutions
- 11.2.3.1. Overview
- 11.2.3.2. Products
- 11.2.3.3. SWOT Analysis
- 11.2.3.4. Recent Developments
- 11.2.3.5. Financials (Based on Availability)
- 11.2.4 UTAC
- 11.2.4.1. Overview
- 11.2.4.2. Products
- 11.2.4.3. SWOT Analysis
- 11.2.4.4. Recent Developments
- 11.2.4.5. Financials (Based on Availability)
- 11.2.5 Rochester Electronics
- 11.2.5.1. Overview
- 11.2.5.2. Products
- 11.2.5.3. SWOT Analysis
- 11.2.5.4. Recent Developments
- 11.2.5.5. Financials (Based on Availability)
- 11.2.6 Sandtek
- 11.2.6.1. Overview
- 11.2.6.2. Products
- 11.2.6.3. SWOT Analysis
- 11.2.6.4. Recent Developments
- 11.2.6.5. Financials (Based on Availability)
- 11.2.7 Hongke Electronic Technology Co.
- 11.2.7.1. Overview
- 11.2.7.2. Products
- 11.2.7.3. SWOT Analysis
- 11.2.7.4. Recent Developments
- 11.2.7.5. Financials (Based on Availability)
- 11.2.8 LTD
- 11.2.8.1. Overview
- 11.2.8.2. Products
- 11.2.8.3. SWOT Analysis
- 11.2.8.4. Recent Developments
- 11.2.8.5. Financials (Based on Availability)
- 11.2.9 Beijing Oriental System Integration Co.
- 11.2.9.1. Overview
- 11.2.9.2. Products
- 11.2.9.3. SWOT Analysis
- 11.2.9.4. Recent Developments
- 11.2.9.5. Financials (Based on Availability)
- 11.2.10 Ltd.
- 11.2.10.1. Overview
- 11.2.10.2. Products
- 11.2.10.3. SWOT Analysis
- 11.2.10.4. Recent Developments
- 11.2.10.5. Financials (Based on Availability)
- 11.2.11 Teradyne
- 11.2.11.1. Overview
- 11.2.11.2. Products
- 11.2.11.3. SWOT Analysis
- 11.2.11.4. Recent Developments
- 11.2.11.5. Financials (Based on Availability)
- 11.2.12 Tektronix
- 11.2.12.1. Overview
- 11.2.12.2. Products
- 11.2.12.3. SWOT Analysis
- 11.2.12.4. Recent Developments
- 11.2.12.5. Financials (Based on Availability)
- 11.2.1 Teledyne LeCroy
List of Figures
- Figure 1: Global Electronic Component and Circuit Testing Services Revenue Breakdown (million, %) by Region 2025 & 2033
- Figure 2: North America Electronic Component and Circuit Testing Services Revenue (million), by Application 2025 & 2033
- Figure 3: North America Electronic Component and Circuit Testing Services Revenue Share (%), by Application 2025 & 2033
- Figure 4: North America Electronic Component and Circuit Testing Services Revenue (million), by Types 2025 & 2033
- Figure 5: North America Electronic Component and Circuit Testing Services Revenue Share (%), by Types 2025 & 2033
- Figure 6: North America Electronic Component and Circuit Testing Services Revenue (million), by Country 2025 & 2033
- Figure 7: North America Electronic Component and Circuit Testing Services Revenue Share (%), by Country 2025 & 2033
- Figure 8: South America Electronic Component and Circuit Testing Services Revenue (million), by Application 2025 & 2033
- Figure 9: South America Electronic Component and Circuit Testing Services Revenue Share (%), by Application 2025 & 2033
- Figure 10: South America Electronic Component and Circuit Testing Services Revenue (million), by Types 2025 & 2033
- Figure 11: South America Electronic Component and Circuit Testing Services Revenue Share (%), by Types 2025 & 2033
- Figure 12: South America Electronic Component and Circuit Testing Services Revenue (million), by Country 2025 & 2033
- Figure 13: South America Electronic Component and Circuit Testing Services Revenue Share (%), by Country 2025 & 2033
- Figure 14: Europe Electronic Component and Circuit Testing Services Revenue (million), by Application 2025 & 2033
- Figure 15: Europe Electronic Component and Circuit Testing Services Revenue Share (%), by Application 2025 & 2033
- Figure 16: Europe Electronic Component and Circuit Testing Services Revenue (million), by Types 2025 & 2033
- Figure 17: Europe Electronic Component and Circuit Testing Services Revenue Share (%), by Types 2025 & 2033
- Figure 18: Europe Electronic Component and Circuit Testing Services Revenue (million), by Country 2025 & 2033
- Figure 19: Europe Electronic Component and Circuit Testing Services Revenue Share (%), by Country 2025 & 2033
- Figure 20: Middle East & Africa Electronic Component and Circuit Testing Services Revenue (million), by Application 2025 & 2033
- Figure 21: Middle East & Africa Electronic Component and Circuit Testing Services Revenue Share (%), by Application 2025 & 2033
- Figure 22: Middle East & Africa Electronic Component and Circuit Testing Services Revenue (million), by Types 2025 & 2033
- Figure 23: Middle East & Africa Electronic Component and Circuit Testing Services Revenue Share (%), by Types 2025 & 2033
- Figure 24: Middle East & Africa Electronic Component and Circuit Testing Services Revenue (million), by Country 2025 & 2033
- Figure 25: Middle East & Africa Electronic Component and Circuit Testing Services Revenue Share (%), by Country 2025 & 2033
- Figure 26: Asia Pacific Electronic Component and Circuit Testing Services Revenue (million), by Application 2025 & 2033
- Figure 27: Asia Pacific Electronic Component and Circuit Testing Services Revenue Share (%), by Application 2025 & 2033
- Figure 28: Asia Pacific Electronic Component and Circuit Testing Services Revenue (million), by Types 2025 & 2033
- Figure 29: Asia Pacific Electronic Component and Circuit Testing Services Revenue Share (%), by Types 2025 & 2033
- Figure 30: Asia Pacific Electronic Component and Circuit Testing Services Revenue (million), by Country 2025 & 2033
- Figure 31: Asia Pacific Electronic Component and Circuit Testing Services Revenue Share (%), by Country 2025 & 2033
List of Tables
- Table 1: Global Electronic Component and Circuit Testing Services Revenue million Forecast, by Application 2020 & 2033
- Table 2: Global Electronic Component and Circuit Testing Services Revenue million Forecast, by Types 2020 & 2033
- Table 3: Global Electronic Component and Circuit Testing Services Revenue million Forecast, by Region 2020 & 2033
- Table 4: Global Electronic Component and Circuit Testing Services Revenue million Forecast, by Application 2020 & 2033
- Table 5: Global Electronic Component and Circuit Testing Services Revenue million Forecast, by Types 2020 & 2033
- Table 6: Global Electronic Component and Circuit Testing Services Revenue million Forecast, by Country 2020 & 2033
- Table 7: United States Electronic Component and Circuit Testing Services Revenue (million) Forecast, by Application 2020 & 2033
- Table 8: Canada Electronic Component and Circuit Testing Services Revenue (million) Forecast, by Application 2020 & 2033
- Table 9: Mexico Electronic Component and Circuit Testing Services Revenue (million) Forecast, by Application 2020 & 2033
- Table 10: Global Electronic Component and Circuit Testing Services Revenue million Forecast, by Application 2020 & 2033
- Table 11: Global Electronic Component and Circuit Testing Services Revenue million Forecast, by Types 2020 & 2033
- Table 12: Global Electronic Component and Circuit Testing Services Revenue million Forecast, by Country 2020 & 2033
- Table 13: Brazil Electronic Component and Circuit Testing Services Revenue (million) Forecast, by Application 2020 & 2033
- Table 14: Argentina Electronic Component and Circuit Testing Services Revenue (million) Forecast, by Application 2020 & 2033
- Table 15: Rest of South America Electronic Component and Circuit Testing Services Revenue (million) Forecast, by Application 2020 & 2033
- Table 16: Global Electronic Component and Circuit Testing Services Revenue million Forecast, by Application 2020 & 2033
- Table 17: Global Electronic Component and Circuit Testing Services Revenue million Forecast, by Types 2020 & 2033
- Table 18: Global Electronic Component and Circuit Testing Services Revenue million Forecast, by Country 2020 & 2033
- Table 19: United Kingdom Electronic Component and Circuit Testing Services Revenue (million) Forecast, by Application 2020 & 2033
- Table 20: Germany Electronic Component and Circuit Testing Services Revenue (million) Forecast, by Application 2020 & 2033
- Table 21: France Electronic Component and Circuit Testing Services Revenue (million) Forecast, by Application 2020 & 2033
- Table 22: Italy Electronic Component and Circuit Testing Services Revenue (million) Forecast, by Application 2020 & 2033
- Table 23: Spain Electronic Component and Circuit Testing Services Revenue (million) Forecast, by Application 2020 & 2033
- Table 24: Russia Electronic Component and Circuit Testing Services Revenue (million) Forecast, by Application 2020 & 2033
- Table 25: Benelux Electronic Component and Circuit Testing Services Revenue (million) Forecast, by Application 2020 & 2033
- Table 26: Nordics Electronic Component and Circuit Testing Services Revenue (million) Forecast, by Application 2020 & 2033
- Table 27: Rest of Europe Electronic Component and Circuit Testing Services Revenue (million) Forecast, by Application 2020 & 2033
- Table 28: Global Electronic Component and Circuit Testing Services Revenue million Forecast, by Application 2020 & 2033
- Table 29: Global Electronic Component and Circuit Testing Services Revenue million Forecast, by Types 2020 & 2033
- Table 30: Global Electronic Component and Circuit Testing Services Revenue million Forecast, by Country 2020 & 2033
- Table 31: Turkey Electronic Component and Circuit Testing Services Revenue (million) Forecast, by Application 2020 & 2033
- Table 32: Israel Electronic Component and Circuit Testing Services Revenue (million) Forecast, by Application 2020 & 2033
- Table 33: GCC Electronic Component and Circuit Testing Services Revenue (million) Forecast, by Application 2020 & 2033
- Table 34: North Africa Electronic Component and Circuit Testing Services Revenue (million) Forecast, by Application 2020 & 2033
- Table 35: South Africa Electronic Component and Circuit Testing Services Revenue (million) Forecast, by Application 2020 & 2033
- Table 36: Rest of Middle East & Africa Electronic Component and Circuit Testing Services Revenue (million) Forecast, by Application 2020 & 2033
- Table 37: Global Electronic Component and Circuit Testing Services Revenue million Forecast, by Application 2020 & 2033
- Table 38: Global Electronic Component and Circuit Testing Services Revenue million Forecast, by Types 2020 & 2033
- Table 39: Global Electronic Component and Circuit Testing Services Revenue million Forecast, by Country 2020 & 2033
- Table 40: China Electronic Component and Circuit Testing Services Revenue (million) Forecast, by Application 2020 & 2033
- Table 41: India Electronic Component and Circuit Testing Services Revenue (million) Forecast, by Application 2020 & 2033
- Table 42: Japan Electronic Component and Circuit Testing Services Revenue (million) Forecast, by Application 2020 & 2033
- Table 43: South Korea Electronic Component and Circuit Testing Services Revenue (million) Forecast, by Application 2020 & 2033
- Table 44: ASEAN Electronic Component and Circuit Testing Services Revenue (million) Forecast, by Application 2020 & 2033
- Table 45: Oceania Electronic Component and Circuit Testing Services Revenue (million) Forecast, by Application 2020 & 2033
- Table 46: Rest of Asia Pacific Electronic Component and Circuit Testing Services Revenue (million) Forecast, by Application 2020 & 2033
Frequently Asked Questions
1. What is the projected Compound Annual Growth Rate (CAGR) of the Electronic Component and Circuit Testing Services?
The projected CAGR is approximately XX%.
2. Which companies are prominent players in the Electronic Component and Circuit Testing Services?
Key companies in the market include Teledyne LeCroy, Cadence, EDA Solutions, UTAC, Rochester Electronics, Sandtek, Hongke Electronic Technology Co., LTD, Beijing Oriental System Integration Co., Ltd., Teradyne, Tektronix.
3. What are the main segments of the Electronic Component and Circuit Testing Services?
The market segments include Application, Types.
4. Can you provide details about the market size?
The market size is estimated to be USD XXX million as of 2022.
5. What are some drivers contributing to market growth?
N/A
6. What are the notable trends driving market growth?
N/A
7. Are there any restraints impacting market growth?
N/A
8. Can you provide examples of recent developments in the market?
N/A
9. What pricing options are available for accessing the report?
Pricing options include single-user, multi-user, and enterprise licenses priced at USD 3350.00, USD 5025.00, and USD 6700.00 respectively.
10. Is the market size provided in terms of value or volume?
The market size is provided in terms of value, measured in million.
11. Are there any specific market keywords associated with the report?
Yes, the market keyword associated with the report is "Electronic Component and Circuit Testing Services," which aids in identifying and referencing the specific market segment covered.
12. How do I determine which pricing option suits my needs best?
The pricing options vary based on user requirements and access needs. Individual users may opt for single-user licenses, while businesses requiring broader access may choose multi-user or enterprise licenses for cost-effective access to the report.
13. Are there any additional resources or data provided in the Electronic Component and Circuit Testing Services report?
While the report offers comprehensive insights, it's advisable to review the specific contents or supplementary materials provided to ascertain if additional resources or data are available.
14. How can I stay updated on further developments or reports in the Electronic Component and Circuit Testing Services?
To stay informed about further developments, trends, and reports in the Electronic Component and Circuit Testing Services, consider subscribing to industry newsletters, following relevant companies and organizations, or regularly checking reputable industry news sources and publications.
Methodology
Step 1 - Identification of Relevant Samples Size from Population Database


Step 2 - Approaches for Defining Global Market Size (Value, Volume* & Price*)

Note*: In applicable scenarios
Step 3 - Data Sources
Primary Research
- Web Analytics
- Survey Reports
- Research Institute
- Latest Research Reports
- Opinion Leaders
Secondary Research
- Annual Reports
- White Paper
- Latest Press Release
- Industry Association
- Paid Database
- Investor Presentations

Step 4 - Data Triangulation
Involves using different sources of information in order to increase the validity of a study
These sources are likely to be stakeholders in a program - participants, other researchers, program staff, other community members, and so on.
Then we put all data in single framework & apply various statistical tools to find out the dynamic on the market.
During the analysis stage, feedback from the stakeholder groups would be compared to determine areas of agreement as well as areas of divergence