

Key Insights
The United Kingdom's energy storage market is experiencing significant expansion, driven by ambitious renewable energy objectives and the critical need for grid stability. With a projected Compound Annual Growth Rate (CAGR) of 19.57%, the market is forecast to reach 6,872 million by 2025. Key growth catalysts include the rising adoption of intermittent renewable energy sources, such as solar and wind, which necessitate advanced energy storage solutions for seamless integration. Supportive government policies, increasing electricity prices, and a heightened focus on energy security further stimulate market development. The market is segmented by technology, including Batteries, Pumped-storage Hydroelectricity (PSH), and Other Types, and by application, such as Residential and Commercial & Industrial (C&I). Battery technology currently leads, benefiting from technological progress, cost reductions, and adaptability, while PSH remains crucial for large-scale projects. The C&I segment is anticipated to grow substantially due to escalating demand for backup power and grid services in industrial settings. Leading companies like ABB, Samsung SDI, LG Energy Solution, and Tesla are actively driving market evolution through innovation and strategic alliances, fostering a competitive environment that accelerates market expansion.
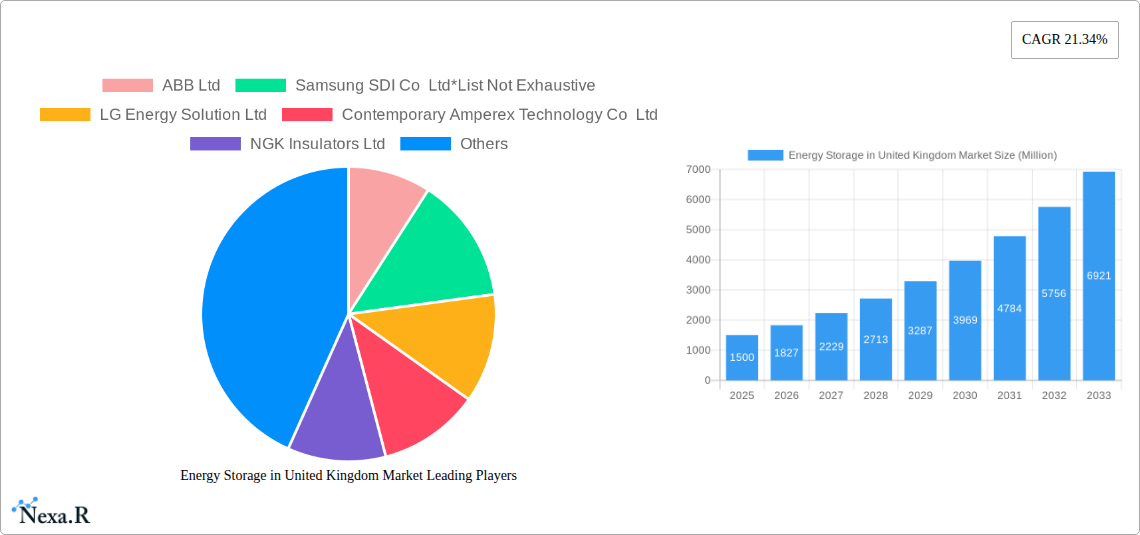
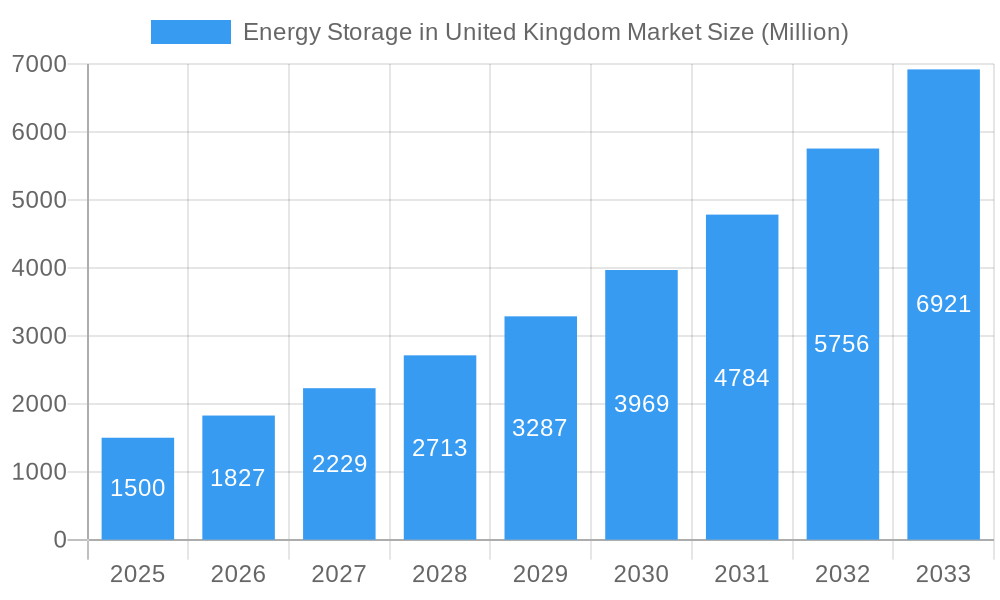
Energy Storage in United Kingdom Market Market Size (In Billion)
The UK energy storage market's growth is sustained by ongoing technological advancements and evolving regulatory frameworks. While the residential sector is currently smaller than C&I, it presents considerable future growth potential as consumers increasingly embrace home battery storage for cost optimization and energy self-sufficiency. Future expansion will likely involve exploring alternative storage technologies beyond batteries and PSH, alongside addressing challenges such as significant upfront capital investment and enhancing grid integration capabilities. The continuous development of sophisticated energy management systems and smart grid technologies will further refine energy storage utilization, maximizing its contribution to a sustainable and resilient energy infrastructure. The dynamic competitive landscape ensures perpetual innovation and cost efficiencies, facilitating the broad adoption of energy storage solutions across the UK's diverse sectors.
Energy Storage in United Kingdom Market Company Market Share
Energy Storage in the United Kingdom Market: A Comprehensive Report (2019-2033)
This comprehensive report provides an in-depth analysis of the burgeoning Energy Storage market in the United Kingdom, encompassing market dynamics, growth trends, key players, and future outlook. With a focus on the parent market of renewable energy and the child markets of residential, commercial & industrial applications, this report is essential for industry professionals, investors, and policymakers seeking to understand this rapidly evolving sector. The study period covers 2019-2033, with 2025 as the base and estimated year.
Keywords: UK Energy Storage Market, Battery Energy Storage Systems (BESS), Pumped Hydro Storage, Energy Storage UK, Renewable Energy Storage, Residential Energy Storage, Commercial & Industrial Energy Storage, UK Energy Market, Energy Transition, ABB Ltd, Samsung SDI Co Ltd, LG Energy Solution Ltd, Contemporary Amperex Technology Co Ltd.
Energy Storage in United Kingdom Market Market Dynamics & Structure
The UK energy storage market is characterized by increasing market concentration among key players, driven by significant investments and technological advancements. The regulatory landscape, supportive of renewable energy integration, further fuels growth. However, challenges remain, including high initial capital costs and grid integration complexities.
- Market Concentration: The market exhibits moderate concentration, with a few major players holding significant market share, while numerous smaller players compete in niche segments. We estimate that the top 5 players account for approximately xx% of the market in 2025.
- Technological Innovation: Continuous innovation in battery technologies (Lithium-ion, flow batteries, etc.) and pumped hydro storage (PSH) is pushing down costs and improving efficiency. However, challenges remain in terms of scalability, lifespan, and safety.
- Regulatory Framework: Government policies promoting renewable energy integration and net-zero targets significantly drive market growth. Incentive schemes and regulatory frameworks aim to streamline project approvals and incentivize investment.
- Competitive Product Substitutes: While energy storage remains the primary solution for grid stabilization and renewable energy integration, competition exists from other technologies such as demand-side management strategies.
- End-User Demographics: The market is driven by a diverse range of end-users including residential customers seeking improved energy independence, C&I customers seeking cost savings and operational flexibility, and grid operators focusing on system reliability.
- M&A Trends: The sector has witnessed several significant mergers and acquisitions (M&A) deals in recent years, indicating consolidation and strategic partnerships to secure market share and access technological advancements. The volume of M&A deals is expected to reach xx Million in 2025.
Energy Storage in United Kingdom Market Growth Trends & Insights
The UK energy storage market is experiencing rapid growth, fueled by rising renewable energy penetration, increasing electricity demand, and stringent emission reduction targets. The market size is projected to expand significantly from xx Million in 2024 to xx Million in 2033, registering a CAGR of xx% during the forecast period.
This substantial growth reflects a significant increase in adoption rates across various sectors, including residential, commercial and industrial (C&I) applications. Technological advancements, particularly in battery storage technologies, are driving down costs and improving efficiency, further accelerating market penetration. Shifting consumer behavior towards sustainable energy solutions and increasing awareness of the benefits of energy storage are also key drivers. The market is expected to experience a period of rapid growth followed by a more stabilized rate as penetration nears saturation.
Dominant Regions, Countries, or Segments in Energy Storage in United Kingdom Market
The UK energy storage market is characterized by dynamic regional growth and adoption patterns. While England, Scotland, and Wales are all actively pursuing energy storage initiatives, England currently leads due to its substantial energy consumption and well-established infrastructure. The Commercial & Industrial (C&I) sector stands out as the most dominant application segment, propelled by its focus on cost optimization, enhanced energy resilience, and a drive for greater energy independence.
-
Key Growth Drivers:
- Supportive Regulatory Frameworks: Robust government policies, including financial incentives and clear regulatory pathways, are instrumental in attracting private investment and accelerating deployment across all market segments.
- Renewable Energy Expansion: The rapid growth of renewable energy sources, particularly offshore wind, necessitates substantial energy storage capacity to ensure grid stability and manage intermittency.
- Grid Modernization and Digitization: Significant investments in smart grid technologies are facilitating the integration of distributed energy resources, with energy storage playing a pivotal role in optimizing grid operations.
-
Factors Influencing Regional Dominance:
- Economic and Population Scale: England commands the largest share of the energy storage market, largely attributable to its extensive industrial base and higher population density.
- Existing Infrastructure and Grid Connectivity: The availability of robust electricity infrastructure and favorable grid connections significantly influences the ease and cost-effectiveness of deploying energy storage solutions in various regions.
- Tailored Policy Support: Variations in regional policies and incentive schemes directly impact investment decisions and deployment rates across different parts of the UK.
-
Dominant Technologies: While battery technologies, particularly Lithium-ion, currently dominate the market due to their technological maturity, flexibility, and declining costs, Pumped Hydro Storage (PSH) remains a vital contributor, especially for large-scale grid balancing applications. The market is also witnessing the emergence and growing adoption of other advanced battery chemistries and solutions.
Energy Storage in United Kingdom Market Product Landscape
The UK energy storage market presents a sophisticated and evolving product landscape. Battery technologies, led by Lithium-ion, form the cornerstone, but the market also encompasses established solutions like Pumped Hydro Storage and a growing array of emerging technologies, including various flow battery systems. Continuous innovation is focused on enhancing key performance indicators such as energy density, operational lifespan, safety protocols, and overall cost-effectiveness. The unique selling propositions of these diverse products are centered around their efficiency, inherent durability, scalability to meet varying demands, and seamless integration capabilities with existing and future grid infrastructures.
Key Drivers, Barriers & Challenges in Energy Storage in United Kingdom Market
Key Drivers:
- The increasing integration of intermittent renewable energy sources like solar and wind power necessitates reliable energy storage solutions.
- Government policies and incentives aimed at decarbonizing the UK's energy sector are strongly driving investment.
- The growing demand for reliable and cost-effective energy solutions, especially within the C&I sector, is fostering market expansion.
Key Challenges:
- High upfront capital costs for energy storage systems can hinder widespread adoption, especially for residential users. This is exacerbated by supply chain challenges and material cost volatility which impact overall pricing.
- Grid integration complexities and the need for upgraded grid infrastructure pose significant barriers.
- The relatively short lifespan of some battery technologies compared to other infrastructure necessitates replacement and lifecycle management considerations.
Emerging Opportunities in Energy Storage in United Kingdom Market
The UK energy storage market is a fertile ground for emerging opportunities, driven by evolving energy needs and technological advancements. These include:
- The increasing demand for self-sufficient microgrids and localized energy solutions that enhance community resilience and energy autonomy.
- Innovative applications at the intersection of electric vehicle (EV) charging infrastructure and integrated energy storage systems, facilitating smarter charging and grid load management.
- The strategic utilization of second-life battery applications, offering a more sustainable and cost-effective pathway for deploying energy storage solutions.
- The development of novel market mechanisms and regulatory frameworks that better facilitate the participation of energy storage in wholesale and ancillary services markets.
Growth Accelerators in the Energy Storage in United Kingdom Market Industry
Technological advancements, particularly in battery chemistry and energy management systems, are significant growth accelerators. Strategic partnerships between energy storage providers, renewable energy developers, and grid operators are essential for successful project deployment. Expansion into new markets, including the burgeoning EV charging sector, will further drive market growth.
Key Players Shaping the Energy Storage in United Kingdom Market Market
- ABB Ltd
- Samsung SDI Co Ltd
- LG Energy Solution Ltd
- Contemporary Amperex Technology Co Ltd
- NGK Insulators Ltd
- Electricite de France SA (EDF)
- Wartsila Oyj Abp
- Tesla Inc
- Siemens Energy AG
- General Electric Company
Notable Milestones in Energy Storage in United Kingdom Market Sector
- June 2022: Quinbrook Infrastructure Partners secured development rights for a substantial 230 MW/460 MWh battery energy storage project in Wales, underscoring significant investor confidence and activity in large-scale Battery Energy Storage Systems (BESS).
- January 2022: Voltalia's commissioning of the Hallen BESS project (32 MW/32 MWh) exemplifies the ongoing expansion and deployment of medium-scale battery storage installations across the UK.
- Throughout 2022-2023: A significant number of grid-scale battery storage projects, ranging from 50 MW to over 500 MW, have reached financial close and commenced construction, indicating a robust pipeline and accelerating deployment pace.
In-Depth Energy Storage in United Kingdom Market Market Outlook
The UK energy storage market is on a trajectory for sustained and substantial growth. This expansion is underpinned by unwavering government commitment to decarbonization targets, the escalating integration of renewable energy sources, and a growing imperative for dependable and resilient energy supply across residential, commercial, and industrial sectors. Strategic investments in cutting-edge storage technologies, coupled with sophisticated grid integration strategies, are set to unlock further market potential, creating significant and diverse opportunities for both established industry leaders and innovative new entrants.
Energy Storage in United Kingdom Market Segmentation
-
1. Type
- 1.1. Batteries
- 1.2. Pumped-storage Hydroelectricity (PSH)
- 1.3. Other Types
-
2. Application
- 2.1. Residential
- 2.2. Commercial and Industrial (C&I)
Energy Storage in United Kingdom Market Segmentation By Geography
-
1. North America
- 1.1. United States
- 1.2. Canada
- 1.3. Mexico
-
2. South America
- 2.1. Brazil
- 2.2. Argentina
- 2.3. Rest of South America
-
3. Europe
- 3.1. United Kingdom
- 3.2. Germany
- 3.3. France
- 3.4. Italy
- 3.5. Spain
- 3.6. Russia
- 3.7. Benelux
- 3.8. Nordics
- 3.9. Rest of Europe
-
4. Middle East & Africa
- 4.1. Turkey
- 4.2. Israel
- 4.3. GCC
- 4.4. North Africa
- 4.5. South Africa
- 4.6. Rest of Middle East & Africa
-
5. Asia Pacific
- 5.1. China
- 5.2. India
- 5.3. Japan
- 5.4. South Korea
- 5.5. ASEAN
- 5.6. Oceania
- 5.7. Rest of Asia Pacific
Energy Storage in United Kingdom Market Regional Market Share
Geographic Coverage of Energy Storage in United Kingdom Market
Energy Storage in United Kingdom Market REPORT HIGHLIGHTS
| Aspects | Details |
|---|---|
| Study Period | 2020-2034 |
| Base Year | 2025 |
| Estimated Year | 2026 |
| Forecast Period | 2026-2034 |
| Historical Period | 2020-2025 |
| Growth Rate | CAGR of 19.57% from 2020-2034 |
| Segmentation |
|
Table of Contents
- 1. Introduction
- 1.1. Research Scope
- 1.2. Market Segmentation
- 1.3. Research Objective
- 1.4. Definitions and Assumptions
- 2. Executive Summary
- 2.1. Market Snapshot
- 3. Market Dynamics
- 3.1. Market Drivers
- 3.2. Market Restrains
- 3.3. Market Trends
- 3.4. Market Opportunities
- 4. Market Factor Analysis
- 4.1. Porters Five Forces
- 4.1.1. Bargaining Power of Suppliers
- 4.1.2. Bargaining Power of Buyers
- 4.1.3. Threat of New Entrants
- 4.1.4. Threat of Substitutes
- 4.1.5. Competitive Rivalry
- 4.2. PESTEL analysis
- 4.3. BCG Analysis
- 4.3.1. Stars (High Growth, High Market Share)
- 4.3.2. Cash Cows (Low Growth, High Market Share)
- 4.3.3. Question Mark (High Growth, Low Market Share)
- 4.3.4. Dogs (Low Growth, Low Market Share)
- 4.4. Ansoff Matrix Analysis
- 4.5. Supply Chain Analysis
- 4.6. Regulatory Landscape
- 4.7. Current Market Potential and Opportunity Assessment (TAM–SAM–SOM Framework)
- 4.8. NRP Analyst Note
- 4.1. Porters Five Forces
- 5. Market Analysis, Insights and Forecast 2021-2033
- 5.1. Market Analysis, Insights and Forecast - by Type
- 5.1.1. Batteries
- 5.1.2. Pumped-storage Hydroelectricity (PSH)
- 5.1.3. Other Types
- 5.2. Market Analysis, Insights and Forecast - by Application
- 5.2.1. Residential
- 5.2.2. Commercial and Industrial (C&I)
- 5.3. Market Analysis, Insights and Forecast - by Region
- 5.3.1. North America
- 5.3.2. South America
- 5.3.3. Europe
- 5.3.4. Middle East & Africa
- 5.3.5. Asia Pacific
- 5.1. Market Analysis, Insights and Forecast - by Type
- 6. Global Energy Storage in United Kingdom Market Analysis, Insights and Forecast, 2021-2033
- 6.1. Market Analysis, Insights and Forecast - by Type
- 6.1.1. Batteries
- 6.1.2. Pumped-storage Hydroelectricity (PSH)
- 6.1.3. Other Types
- 6.2. Market Analysis, Insights and Forecast - by Application
- 6.2.1. Residential
- 6.2.2. Commercial and Industrial (C&I)
- 6.1. Market Analysis, Insights and Forecast - by Type
- 7. North America Energy Storage in United Kingdom Market Analysis, Insights and Forecast, 2020-2032
- 7.1. Market Analysis, Insights and Forecast - by Type
- 7.1.1. Batteries
- 7.1.2. Pumped-storage Hydroelectricity (PSH)
- 7.1.3. Other Types
- 7.2. Market Analysis, Insights and Forecast - by Application
- 7.2.1. Residential
- 7.2.2. Commercial and Industrial (C&I)
- 7.1. Market Analysis, Insights and Forecast - by Type
- 8. South America Energy Storage in United Kingdom Market Analysis, Insights and Forecast, 2020-2032
- 8.1. Market Analysis, Insights and Forecast - by Type
- 8.1.1. Batteries
- 8.1.2. Pumped-storage Hydroelectricity (PSH)
- 8.1.3. Other Types
- 8.2. Market Analysis, Insights and Forecast - by Application
- 8.2.1. Residential
- 8.2.2. Commercial and Industrial (C&I)
- 8.1. Market Analysis, Insights and Forecast - by Type
- 9. Europe Energy Storage in United Kingdom Market Analysis, Insights and Forecast, 2020-2032
- 9.1. Market Analysis, Insights and Forecast - by Type
- 9.1.1. Batteries
- 9.1.2. Pumped-storage Hydroelectricity (PSH)
- 9.1.3. Other Types
- 9.2. Market Analysis, Insights and Forecast - by Application
- 9.2.1. Residential
- 9.2.2. Commercial and Industrial (C&I)
- 9.1. Market Analysis, Insights and Forecast - by Type
- 10. Middle East & Africa Energy Storage in United Kingdom Market Analysis, Insights and Forecast, 2020-2032
- 10.1. Market Analysis, Insights and Forecast - by Type
- 10.1.1. Batteries
- 10.1.2. Pumped-storage Hydroelectricity (PSH)
- 10.1.3. Other Types
- 10.2. Market Analysis, Insights and Forecast - by Application
- 10.2.1. Residential
- 10.2.2. Commercial and Industrial (C&I)
- 10.1. Market Analysis, Insights and Forecast - by Type
- 11. Asia Pacific Energy Storage in United Kingdom Market Analysis, Insights and Forecast, 2020-2032
- 11.1. Market Analysis, Insights and Forecast - by Type
- 11.1.1. Batteries
- 11.1.2. Pumped-storage Hydroelectricity (PSH)
- 11.1.3. Other Types
- 11.2. Market Analysis, Insights and Forecast - by Application
- 11.2.1. Residential
- 11.2.2. Commercial and Industrial (C&I)
- 11.1. Market Analysis, Insights and Forecast - by Type
- 12. Competitive Analysis
- 12.1. Company Profiles
- 12.1.1 ABB Ltd
- 12.1.1.1. Company Overview
- 12.1.1.2. Products
- 12.1.1.3. Company Financials
- 12.1.1.4. SWOT Analysis
- 12.1.2 Samsung SDI Co Ltd*List Not Exhaustive
- 12.1.2.1. Company Overview
- 12.1.2.2. Products
- 12.1.2.3. Company Financials
- 12.1.2.4. SWOT Analysis
- 12.1.3 LG Energy Solution Ltd
- 12.1.3.1. Company Overview
- 12.1.3.2. Products
- 12.1.3.3. Company Financials
- 12.1.3.4. SWOT Analysis
- 12.1.4 Contemporary Amperex Technology Co Ltd
- 12.1.4.1. Company Overview
- 12.1.4.2. Products
- 12.1.4.3. Company Financials
- 12.1.4.4. SWOT Analysis
- 12.1.5 NGK Insulators Ltd
- 12.1.5.1. Company Overview
- 12.1.5.2. Products
- 12.1.5.3. Company Financials
- 12.1.5.4. SWOT Analysis
- 12.1.6 Electricite de France SA (EDF)
- 12.1.6.1. Company Overview
- 12.1.6.2. Products
- 12.1.6.3. Company Financials
- 12.1.6.4. SWOT Analysis
- 12.1.7 Wartsila Oyj Abp
- 12.1.7.1. Company Overview
- 12.1.7.2. Products
- 12.1.7.3. Company Financials
- 12.1.7.4. SWOT Analysis
- 12.1.8 Tesla Inc
- 12.1.8.1. Company Overview
- 12.1.8.2. Products
- 12.1.8.3. Company Financials
- 12.1.8.4. SWOT Analysis
- 12.1.9 Siemens Energy AG
- 12.1.9.1. Company Overview
- 12.1.9.2. Products
- 12.1.9.3. Company Financials
- 12.1.9.4. SWOT Analysis
- 12.1.10 General Electric Company
- 12.1.10.1. Company Overview
- 12.1.10.2. Products
- 12.1.10.3. Company Financials
- 12.1.10.4. SWOT Analysis
- 12.1.1 ABB Ltd
- 12.2. Market Entropy
- 12.2.1 Company's Key Areas Served
- 12.2.2 Recent Developments
- 12.3. Company Market Share Analysis 2025
- 12.3.1 Top 5 Companies Market Share Analysis
- 12.3.2 Top 3 Companies Market Share Analysis
- 12.4. List of Potential Customers
- 13. Research Methodology
List of Figures
- Figure 1: Global Energy Storage in United Kingdom Market Revenue Breakdown (million, %) by Region 2025 & 2033
- Figure 2: Global Energy Storage in United Kingdom Market Volume Breakdown (megawatt, %) by Region 2025 & 2033
- Figure 3: North America Energy Storage in United Kingdom Market Revenue (million), by Type 2025 & 2033
- Figure 4: North America Energy Storage in United Kingdom Market Volume (megawatt), by Type 2025 & 2033
- Figure 5: North America Energy Storage in United Kingdom Market Revenue Share (%), by Type 2025 & 2033
- Figure 6: North America Energy Storage in United Kingdom Market Volume Share (%), by Type 2025 & 2033
- Figure 7: North America Energy Storage in United Kingdom Market Revenue (million), by Application 2025 & 2033
- Figure 8: North America Energy Storage in United Kingdom Market Volume (megawatt), by Application 2025 & 2033
- Figure 9: North America Energy Storage in United Kingdom Market Revenue Share (%), by Application 2025 & 2033
- Figure 10: North America Energy Storage in United Kingdom Market Volume Share (%), by Application 2025 & 2033
- Figure 11: North America Energy Storage in United Kingdom Market Revenue (million), by Country 2025 & 2033
- Figure 12: North America Energy Storage in United Kingdom Market Volume (megawatt), by Country 2025 & 2033
- Figure 13: North America Energy Storage in United Kingdom Market Revenue Share (%), by Country 2025 & 2033
- Figure 14: North America Energy Storage in United Kingdom Market Volume Share (%), by Country 2025 & 2033
- Figure 15: South America Energy Storage in United Kingdom Market Revenue (million), by Type 2025 & 2033
- Figure 16: South America Energy Storage in United Kingdom Market Volume (megawatt), by Type 2025 & 2033
- Figure 17: South America Energy Storage in United Kingdom Market Revenue Share (%), by Type 2025 & 2033
- Figure 18: South America Energy Storage in United Kingdom Market Volume Share (%), by Type 2025 & 2033
- Figure 19: South America Energy Storage in United Kingdom Market Revenue (million), by Application 2025 & 2033
- Figure 20: South America Energy Storage in United Kingdom Market Volume (megawatt), by Application 2025 & 2033
- Figure 21: South America Energy Storage in United Kingdom Market Revenue Share (%), by Application 2025 & 2033
- Figure 22: South America Energy Storage in United Kingdom Market Volume Share (%), by Application 2025 & 2033
- Figure 23: South America Energy Storage in United Kingdom Market Revenue (million), by Country 2025 & 2033
- Figure 24: South America Energy Storage in United Kingdom Market Volume (megawatt), by Country 2025 & 2033
- Figure 25: South America Energy Storage in United Kingdom Market Revenue Share (%), by Country 2025 & 2033
- Figure 26: South America Energy Storage in United Kingdom Market Volume Share (%), by Country 2025 & 2033
- Figure 27: Europe Energy Storage in United Kingdom Market Revenue (million), by Type 2025 & 2033
- Figure 28: Europe Energy Storage in United Kingdom Market Volume (megawatt), by Type 2025 & 2033
- Figure 29: Europe Energy Storage in United Kingdom Market Revenue Share (%), by Type 2025 & 2033
- Figure 30: Europe Energy Storage in United Kingdom Market Volume Share (%), by Type 2025 & 2033
- Figure 31: Europe Energy Storage in United Kingdom Market Revenue (million), by Application 2025 & 2033
- Figure 32: Europe Energy Storage in United Kingdom Market Volume (megawatt), by Application 2025 & 2033
- Figure 33: Europe Energy Storage in United Kingdom Market Revenue Share (%), by Application 2025 & 2033
- Figure 34: Europe Energy Storage in United Kingdom Market Volume Share (%), by Application 2025 & 2033
- Figure 35: Europe Energy Storage in United Kingdom Market Revenue (million), by Country 2025 & 2033
- Figure 36: Europe Energy Storage in United Kingdom Market Volume (megawatt), by Country 2025 & 2033
- Figure 37: Europe Energy Storage in United Kingdom Market Revenue Share (%), by Country 2025 & 2033
- Figure 38: Europe Energy Storage in United Kingdom Market Volume Share (%), by Country 2025 & 2033
- Figure 39: Middle East & Africa Energy Storage in United Kingdom Market Revenue (million), by Type 2025 & 2033
- Figure 40: Middle East & Africa Energy Storage in United Kingdom Market Volume (megawatt), by Type 2025 & 2033
- Figure 41: Middle East & Africa Energy Storage in United Kingdom Market Revenue Share (%), by Type 2025 & 2033
- Figure 42: Middle East & Africa Energy Storage in United Kingdom Market Volume Share (%), by Type 2025 & 2033
- Figure 43: Middle East & Africa Energy Storage in United Kingdom Market Revenue (million), by Application 2025 & 2033
- Figure 44: Middle East & Africa Energy Storage in United Kingdom Market Volume (megawatt), by Application 2025 & 2033
- Figure 45: Middle East & Africa Energy Storage in United Kingdom Market Revenue Share (%), by Application 2025 & 2033
- Figure 46: Middle East & Africa Energy Storage in United Kingdom Market Volume Share (%), by Application 2025 & 2033
- Figure 47: Middle East & Africa Energy Storage in United Kingdom Market Revenue (million), by Country 2025 & 2033
- Figure 48: Middle East & Africa Energy Storage in United Kingdom Market Volume (megawatt), by Country 2025 & 2033
- Figure 49: Middle East & Africa Energy Storage in United Kingdom Market Revenue Share (%), by Country 2025 & 2033
- Figure 50: Middle East & Africa Energy Storage in United Kingdom Market Volume Share (%), by Country 2025 & 2033
- Figure 51: Asia Pacific Energy Storage in United Kingdom Market Revenue (million), by Type 2025 & 2033
- Figure 52: Asia Pacific Energy Storage in United Kingdom Market Volume (megawatt), by Type 2025 & 2033
- Figure 53: Asia Pacific Energy Storage in United Kingdom Market Revenue Share (%), by Type 2025 & 2033
- Figure 54: Asia Pacific Energy Storage in United Kingdom Market Volume Share (%), by Type 2025 & 2033
- Figure 55: Asia Pacific Energy Storage in United Kingdom Market Revenue (million), by Application 2025 & 2033
- Figure 56: Asia Pacific Energy Storage in United Kingdom Market Volume (megawatt), by Application 2025 & 2033
- Figure 57: Asia Pacific Energy Storage in United Kingdom Market Revenue Share (%), by Application 2025 & 2033
- Figure 58: Asia Pacific Energy Storage in United Kingdom Market Volume Share (%), by Application 2025 & 2033
- Figure 59: Asia Pacific Energy Storage in United Kingdom Market Revenue (million), by Country 2025 & 2033
- Figure 60: Asia Pacific Energy Storage in United Kingdom Market Volume (megawatt), by Country 2025 & 2033
- Figure 61: Asia Pacific Energy Storage in United Kingdom Market Revenue Share (%), by Country 2025 & 2033
- Figure 62: Asia Pacific Energy Storage in United Kingdom Market Volume Share (%), by Country 2025 & 2033
List of Tables
- Table 1: Global Energy Storage in United Kingdom Market Revenue million Forecast, by Type 2020 & 2033
- Table 2: Global Energy Storage in United Kingdom Market Volume megawatt Forecast, by Type 2020 & 2033
- Table 3: Global Energy Storage in United Kingdom Market Revenue million Forecast, by Application 2020 & 2033
- Table 4: Global Energy Storage in United Kingdom Market Volume megawatt Forecast, by Application 2020 & 2033
- Table 5: Global Energy Storage in United Kingdom Market Revenue million Forecast, by Region 2020 & 2033
- Table 6: Global Energy Storage in United Kingdom Market Volume megawatt Forecast, by Region 2020 & 2033
- Table 7: Global Energy Storage in United Kingdom Market Revenue million Forecast, by Type 2020 & 2033
- Table 8: Global Energy Storage in United Kingdom Market Volume megawatt Forecast, by Type 2020 & 2033
- Table 9: Global Energy Storage in United Kingdom Market Revenue million Forecast, by Application 2020 & 2033
- Table 10: Global Energy Storage in United Kingdom Market Volume megawatt Forecast, by Application 2020 & 2033
- Table 11: Global Energy Storage in United Kingdom Market Revenue million Forecast, by Country 2020 & 2033
- Table 12: Global Energy Storage in United Kingdom Market Volume megawatt Forecast, by Country 2020 & 2033
- Table 13: United States Energy Storage in United Kingdom Market Revenue (million) Forecast, by Application 2020 & 2033
- Table 14: United States Energy Storage in United Kingdom Market Volume (megawatt) Forecast, by Application 2020 & 2033
- Table 15: Canada Energy Storage in United Kingdom Market Revenue (million) Forecast, by Application 2020 & 2033
- Table 16: Canada Energy Storage in United Kingdom Market Volume (megawatt) Forecast, by Application 2020 & 2033
- Table 17: Mexico Energy Storage in United Kingdom Market Revenue (million) Forecast, by Application 2020 & 2033
- Table 18: Mexico Energy Storage in United Kingdom Market Volume (megawatt) Forecast, by Application 2020 & 2033
- Table 19: Global Energy Storage in United Kingdom Market Revenue million Forecast, by Type 2020 & 2033
- Table 20: Global Energy Storage in United Kingdom Market Volume megawatt Forecast, by Type 2020 & 2033
- Table 21: Global Energy Storage in United Kingdom Market Revenue million Forecast, by Application 2020 & 2033
- Table 22: Global Energy Storage in United Kingdom Market Volume megawatt Forecast, by Application 2020 & 2033
- Table 23: Global Energy Storage in United Kingdom Market Revenue million Forecast, by Country 2020 & 2033
- Table 24: Global Energy Storage in United Kingdom Market Volume megawatt Forecast, by Country 2020 & 2033
- Table 25: Brazil Energy Storage in United Kingdom Market Revenue (million) Forecast, by Application 2020 & 2033
- Table 26: Brazil Energy Storage in United Kingdom Market Volume (megawatt) Forecast, by Application 2020 & 2033
- Table 27: Argentina Energy Storage in United Kingdom Market Revenue (million) Forecast, by Application 2020 & 2033
- Table 28: Argentina Energy Storage in United Kingdom Market Volume (megawatt) Forecast, by Application 2020 & 2033
- Table 29: Rest of South America Energy Storage in United Kingdom Market Revenue (million) Forecast, by Application 2020 & 2033
- Table 30: Rest of South America Energy Storage in United Kingdom Market Volume (megawatt) Forecast, by Application 2020 & 2033
- Table 31: Global Energy Storage in United Kingdom Market Revenue million Forecast, by Type 2020 & 2033
- Table 32: Global Energy Storage in United Kingdom Market Volume megawatt Forecast, by Type 2020 & 2033
- Table 33: Global Energy Storage in United Kingdom Market Revenue million Forecast, by Application 2020 & 2033
- Table 34: Global Energy Storage in United Kingdom Market Volume megawatt Forecast, by Application 2020 & 2033
- Table 35: Global Energy Storage in United Kingdom Market Revenue million Forecast, by Country 2020 & 2033
- Table 36: Global Energy Storage in United Kingdom Market Volume megawatt Forecast, by Country 2020 & 2033
- Table 37: United Kingdom Energy Storage in United Kingdom Market Revenue (million) Forecast, by Application 2020 & 2033
- Table 38: United Kingdom Energy Storage in United Kingdom Market Volume (megawatt) Forecast, by Application 2020 & 2033
- Table 39: Germany Energy Storage in United Kingdom Market Revenue (million) Forecast, by Application 2020 & 2033
- Table 40: Germany Energy Storage in United Kingdom Market Volume (megawatt) Forecast, by Application 2020 & 2033
- Table 41: France Energy Storage in United Kingdom Market Revenue (million) Forecast, by Application 2020 & 2033
- Table 42: France Energy Storage in United Kingdom Market Volume (megawatt) Forecast, by Application 2020 & 2033
- Table 43: Italy Energy Storage in United Kingdom Market Revenue (million) Forecast, by Application 2020 & 2033
- Table 44: Italy Energy Storage in United Kingdom Market Volume (megawatt) Forecast, by Application 2020 & 2033
- Table 45: Spain Energy Storage in United Kingdom Market Revenue (million) Forecast, by Application 2020 & 2033
- Table 46: Spain Energy Storage in United Kingdom Market Volume (megawatt) Forecast, by Application 2020 & 2033
- Table 47: Russia Energy Storage in United Kingdom Market Revenue (million) Forecast, by Application 2020 & 2033
- Table 48: Russia Energy Storage in United Kingdom Market Volume (megawatt) Forecast, by Application 2020 & 2033
- Table 49: Benelux Energy Storage in United Kingdom Market Revenue (million) Forecast, by Application 2020 & 2033
- Table 50: Benelux Energy Storage in United Kingdom Market Volume (megawatt) Forecast, by Application 2020 & 2033
- Table 51: Nordics Energy Storage in United Kingdom Market Revenue (million) Forecast, by Application 2020 & 2033
- Table 52: Nordics Energy Storage in United Kingdom Market Volume (megawatt) Forecast, by Application 2020 & 2033
- Table 53: Rest of Europe Energy Storage in United Kingdom Market Revenue (million) Forecast, by Application 2020 & 2033
- Table 54: Rest of Europe Energy Storage in United Kingdom Market Volume (megawatt) Forecast, by Application 2020 & 2033
- Table 55: Global Energy Storage in United Kingdom Market Revenue million Forecast, by Type 2020 & 2033
- Table 56: Global Energy Storage in United Kingdom Market Volume megawatt Forecast, by Type 2020 & 2033
- Table 57: Global Energy Storage in United Kingdom Market Revenue million Forecast, by Application 2020 & 2033
- Table 58: Global Energy Storage in United Kingdom Market Volume megawatt Forecast, by Application 2020 & 2033
- Table 59: Global Energy Storage in United Kingdom Market Revenue million Forecast, by Country 2020 & 2033
- Table 60: Global Energy Storage in United Kingdom Market Volume megawatt Forecast, by Country 2020 & 2033
- Table 61: Turkey Energy Storage in United Kingdom Market Revenue (million) Forecast, by Application 2020 & 2033
- Table 62: Turkey Energy Storage in United Kingdom Market Volume (megawatt) Forecast, by Application 2020 & 2033
- Table 63: Israel Energy Storage in United Kingdom Market Revenue (million) Forecast, by Application 2020 & 2033
- Table 64: Israel Energy Storage in United Kingdom Market Volume (megawatt) Forecast, by Application 2020 & 2033
- Table 65: GCC Energy Storage in United Kingdom Market Revenue (million) Forecast, by Application 2020 & 2033
- Table 66: GCC Energy Storage in United Kingdom Market Volume (megawatt) Forecast, by Application 2020 & 2033
- Table 67: North Africa Energy Storage in United Kingdom Market Revenue (million) Forecast, by Application 2020 & 2033
- Table 68: North Africa Energy Storage in United Kingdom Market Volume (megawatt) Forecast, by Application 2020 & 2033
- Table 69: South Africa Energy Storage in United Kingdom Market Revenue (million) Forecast, by Application 2020 & 2033
- Table 70: South Africa Energy Storage in United Kingdom Market Volume (megawatt) Forecast, by Application 2020 & 2033
- Table 71: Rest of Middle East & Africa Energy Storage in United Kingdom Market Revenue (million) Forecast, by Application 2020 & 2033
- Table 72: Rest of Middle East & Africa Energy Storage in United Kingdom Market Volume (megawatt) Forecast, by Application 2020 & 2033
- Table 73: Global Energy Storage in United Kingdom Market Revenue million Forecast, by Type 2020 & 2033
- Table 74: Global Energy Storage in United Kingdom Market Volume megawatt Forecast, by Type 2020 & 2033
- Table 75: Global Energy Storage in United Kingdom Market Revenue million Forecast, by Application 2020 & 2033
- Table 76: Global Energy Storage in United Kingdom Market Volume megawatt Forecast, by Application 2020 & 2033
- Table 77: Global Energy Storage in United Kingdom Market Revenue million Forecast, by Country 2020 & 2033
- Table 78: Global Energy Storage in United Kingdom Market Volume megawatt Forecast, by Country 2020 & 2033
- Table 79: China Energy Storage in United Kingdom Market Revenue (million) Forecast, by Application 2020 & 2033
- Table 80: China Energy Storage in United Kingdom Market Volume (megawatt) Forecast, by Application 2020 & 2033
- Table 81: India Energy Storage in United Kingdom Market Revenue (million) Forecast, by Application 2020 & 2033
- Table 82: India Energy Storage in United Kingdom Market Volume (megawatt) Forecast, by Application 2020 & 2033
- Table 83: Japan Energy Storage in United Kingdom Market Revenue (million) Forecast, by Application 2020 & 2033
- Table 84: Japan Energy Storage in United Kingdom Market Volume (megawatt) Forecast, by Application 2020 & 2033
- Table 85: South Korea Energy Storage in United Kingdom Market Revenue (million) Forecast, by Application 2020 & 2033
- Table 86: South Korea Energy Storage in United Kingdom Market Volume (megawatt) Forecast, by Application 2020 & 2033
- Table 87: ASEAN Energy Storage in United Kingdom Market Revenue (million) Forecast, by Application 2020 & 2033
- Table 88: ASEAN Energy Storage in United Kingdom Market Volume (megawatt) Forecast, by Application 2020 & 2033
- Table 89: Oceania Energy Storage in United Kingdom Market Revenue (million) Forecast, by Application 2020 & 2033
- Table 90: Oceania Energy Storage in United Kingdom Market Volume (megawatt) Forecast, by Application 2020 & 2033
- Table 91: Rest of Asia Pacific Energy Storage in United Kingdom Market Revenue (million) Forecast, by Application 2020 & 2033
- Table 92: Rest of Asia Pacific Energy Storage in United Kingdom Market Volume (megawatt) Forecast, by Application 2020 & 2033
Frequently Asked Questions
1. What is the projected Compound Annual Growth Rate (CAGR) of the Energy Storage in United Kingdom Market?
The projected CAGR is approximately 19.57%.
2. Which companies are prominent players in the Energy Storage in United Kingdom Market?
Key companies in the market include ABB Ltd, Samsung SDI Co Ltd*List Not Exhaustive, LG Energy Solution Ltd, Contemporary Amperex Technology Co Ltd, NGK Insulators Ltd, Electricite de France SA (EDF), Wartsila Oyj Abp, Tesla Inc, Siemens Energy AG, General Electric Company.
3. What are the main segments of the Energy Storage in United Kingdom Market?
The market segments include Type, Application.
4. Can you provide details about the market size?
The market size is estimated to be USD 6872 million as of 2022.
5. What are some drivers contributing to market growth?
4.; The High Amount of Waste Generation in the Country4.; The growing Focus on Non-Fossil Fuel Sources.
6. What are the notable trends driving market growth?
Battery Energy Storage Systems Expected to Witness Significant Demand.
7. Are there any restraints impacting market growth?
4.; The Recycling Rate of Waste in Germany.
8. Can you provide examples of recent developments in the market?
Jun 2022: Quinbrook Infrastructure Partners acquired exclusive project development rights for the 230 MW/460 MWh battery energy storage project in Wales, United Kingdom. The battery energy storage system will be at the former Uskmouth coal-fired power station in South Wales, which closed in 2015. The project development rights were acquired from Simec Atlantis Energy, and the BESS is expected to be commissioned by the end of 2024.
9. What pricing options are available for accessing the report?
Pricing options include single-user, multi-user, and enterprise licenses priced at USD 3800, USD 4500, and USD 5800 respectively.
10. Is the market size provided in terms of value or volume?
The market size is provided in terms of value, measured in million and volume, measured in megawatt.
11. Are there any specific market keywords associated with the report?
Yes, the market keyword associated with the report is "Energy Storage in United Kingdom Market," which aids in identifying and referencing the specific market segment covered.
12. How do I determine which pricing option suits my needs best?
The pricing options vary based on user requirements and access needs. Individual users may opt for single-user licenses, while businesses requiring broader access may choose multi-user or enterprise licenses for cost-effective access to the report.
13. Are there any additional resources or data provided in the Energy Storage in United Kingdom Market report?
While the report offers comprehensive insights, it's advisable to review the specific contents or supplementary materials provided to ascertain if additional resources or data are available.
14. How can I stay updated on further developments or reports in the Energy Storage in United Kingdom Market?
To stay informed about further developments, trends, and reports in the Energy Storage in United Kingdom Market, consider subscribing to industry newsletters, following relevant companies and organizations, or regularly checking reputable industry news sources and publications.
Methodology
Step 1 - Identification of Relevant Samples Size from Population Database


Step 2 - Approaches for Defining Global Market Size (Value, Volume* & Price*)

Note*: In applicable scenarios
Step 3 - Data Sources
Primary Research
- Web Analytics
- Survey Reports
- Research Institute
- Latest Research Reports
- Opinion Leaders
Secondary Research
- Annual Reports
- White Paper
- Latest Press Release
- Industry Association
- Paid Database
- Investor Presentations

Step 4 - Data Triangulation
Involves using different sources of information in order to increase the validity of a study
These sources are likely to be stakeholders in a program - participants, other researchers, program staff, other community members, and so on.
Then we put all data in single framework & apply various statistical tools to find out the dynamic on the market.
During the analysis stage, feedback from the stakeholder groups would be compared to determine areas of agreement as well as areas of divergence