

Key Insights
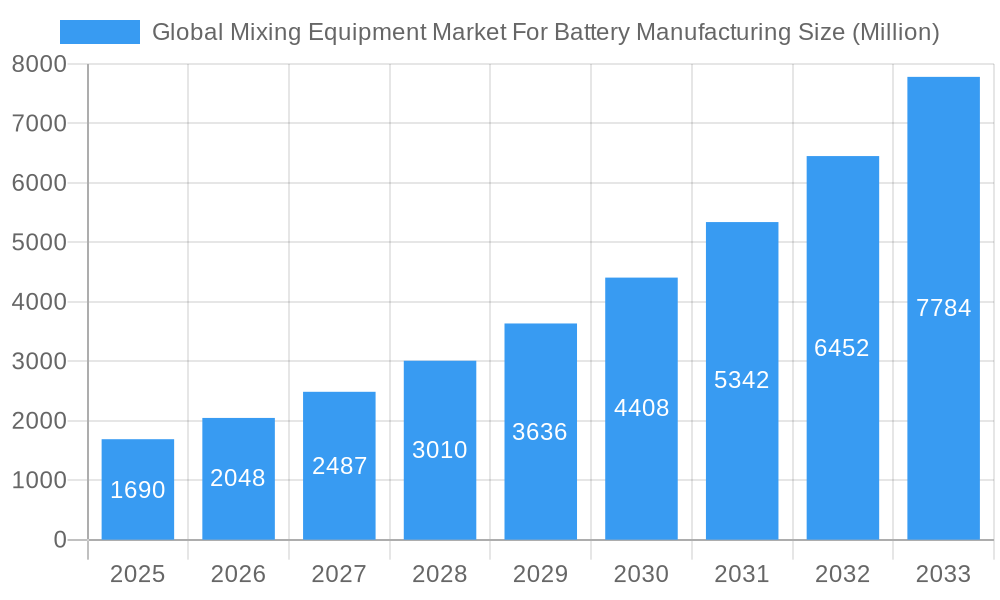
The global mixing equipment market for battery manufacturing is experiencing robust growth, projected to reach \$1.69 billion in 2025 and exhibiting a remarkable Compound Annual Growth Rate (CAGR) of 21.20% from 2025 to 2033. This surge is primarily driven by the burgeoning electric vehicle (EV) industry and the escalating demand for energy storage solutions. Technological advancements in battery chemistries, particularly in lithium-ion batteries, are fueling the need for sophisticated mixing equipment capable of handling diverse materials with precision and efficiency. The market is segmented into wet and dry mixers, with wet mixers currently holding a larger market share due to their suitability for a wider range of battery production processes. Key players, including Processall, Charles Ross & Son Company, and MIXACO, are actively investing in research and development to improve mixing efficiency, reduce energy consumption, and enhance the overall quality of battery production. The Asia-Pacific region, particularly China and South Korea, is expected to dominate the market due to the significant concentration of battery manufacturing facilities in these regions. However, North America and Europe are also showing strong growth potential, driven by government incentives and investments in renewable energy infrastructure. Growth is further fueled by increasing focus on automation and improved process control within battery manufacturing plants.
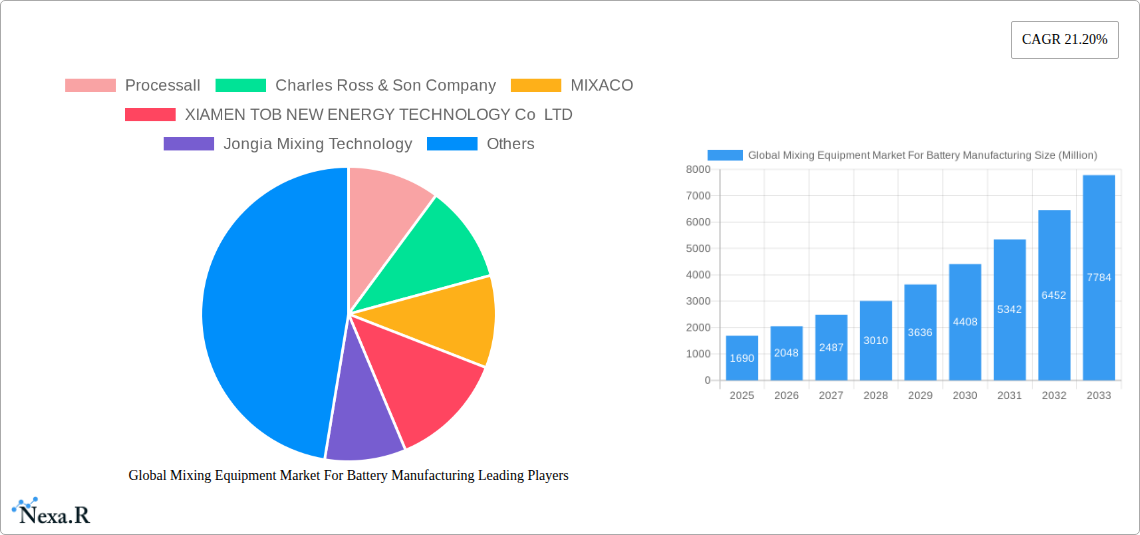
Global Mixing Equipment Market For Battery Manufacturing Market Size (In Billion)
The restraints on market growth are primarily associated with the high initial investment costs of advanced mixing equipment and the need for specialized technical expertise to operate and maintain these systems. However, these challenges are gradually being mitigated by financing options and industry-led training programs. The future growth trajectory indicates a continued upward trend, driven by the expanding EV market and the ongoing development of more advanced battery technologies. This includes exploring new battery chemistries and increasing focus on sustainable battery production methods, further shaping the demand for specialized mixing equipment and driving innovation within the sector. The market is expected to witness increased consolidation as larger players acquire smaller companies to enhance their market share and technological capabilities.
Global Mixing Equipment Market For Battery Manufacturing Company Market Share
Global Mixing Equipment Market for Battery Manufacturing: A Comprehensive Report (2019-2033)
This in-depth report provides a comprehensive analysis of the global mixing equipment market for battery manufacturing, offering invaluable insights for industry professionals, investors, and strategic decision-makers. The study covers the period 2019-2033, with 2025 as the base and estimated year. The report segments the market by type (Wet Mixers, Dry Mixers) and analyzes key players, growth drivers, and emerging trends within this rapidly expanding sector of the broader battery manufacturing market. The total market size is projected to reach xx Million units by 2033.
Parent Market: Battery Manufacturing Equipment Market Child Market: Mixing Equipment for Battery Production
Global Mixing Equipment Market For Battery Manufacturing Market Dynamics & Structure
The global mixing equipment market for battery manufacturing is characterized by moderate concentration, with several key players holding significant market share. Technological innovation, driven by the increasing demand for high-performance batteries, is a major driver of market growth. Stringent regulatory frameworks concerning battery safety and environmental impact influence product development and adoption. Competitive pressure from substitute technologies is relatively low, although continuous improvements in alternative mixing methods may pose future challenges. The end-user demographic is predominantly comprised of battery manufacturers, ranging from established giants to emerging players in the EV and energy storage sectors. M&A activity has been moderate, with a focus on strategic acquisitions to expand product portfolios and enhance technological capabilities. Over the past five years, approximately xx M&A deals were recorded in this segment, representing a xx% increase compared to the previous five-year period.
- Market Concentration: Moderately concentrated, with top 5 players holding approximately xx% market share.
- Technological Innovation: Focus on high-shear mixers, vacuum mixers, and automated systems to improve mixing efficiency and consistency.
- Regulatory Framework: Compliance with safety and environmental regulations is crucial for market entry and success.
- Competitive Substitutes: Limited direct substitutes, but alternative mixing technologies are under development.
- End-User Demographics: Primarily battery manufacturers of various scales, catering to EVs, energy storage, and other applications.
- M&A Trends: Strategic acquisitions to expand product lines and enhance technological capabilities.
Global Mixing Equipment Market For Battery Manufacturing Growth Trends & Insights
The global mixing equipment market for battery manufacturing has experienced significant growth over the past five years, driven by the rapid expansion of the electric vehicle (EV) and energy storage sectors. The market size was valued at xx Million units in 2024 and is projected to exhibit a Compound Annual Growth Rate (CAGR) of xx% from 2025 to 2033, reaching xx Million units. This growth is fueled by increasing demand for high-energy-density batteries, advancements in battery chemistries, and government initiatives promoting the adoption of renewable energy technologies. The market penetration of advanced mixing technologies, such as high-shear and planetary mixers, is also on the rise, further contributing to market expansion. Shifting consumer preferences towards sustainable transportation and energy storage solutions provide a strong tailwind to market growth.
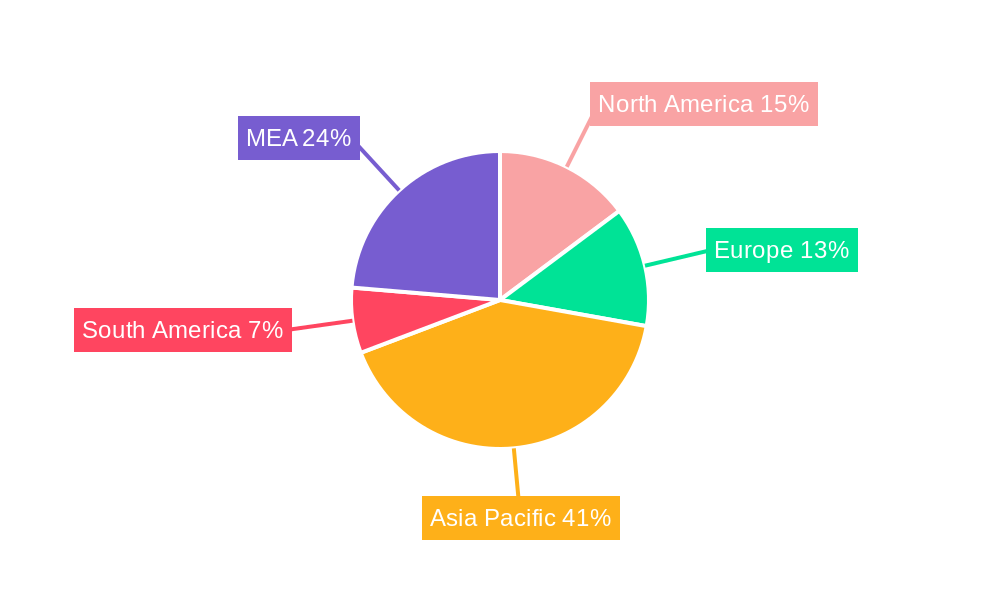
Dominant Regions, Countries, or Segments in Global Mixing Equipment Market For Battery Manufacturing
Asia-Pacific currently dominates the global mixing equipment market for battery manufacturing, driven by the substantial growth of the EV and energy storage industries in countries like China, South Korea, and Japan. China, in particular, accounts for the largest market share due to its massive battery production capacity and government support for the electric vehicle sector. The strong presence of major battery manufacturers and a well-established supply chain within the region further contributes to its dominance. Within the type segment, Wet Mixers currently hold a larger market share compared to Dry Mixers, owing to their suitability for processing most battery slurry formulations.
- Key Drivers (Asia-Pacific):
- Large-scale EV and energy storage deployments.
- Government incentives and subsidies.
- Well-established battery manufacturing infrastructure.
- Robust supply chains.
- Dominance Factors:
- High concentration of battery manufacturers.
- Favorable government policies.
- Strong economic growth.
- Expanding energy storage market.
Global Mixing Equipment Market For Battery Manufacturing Product Landscape
The product landscape is characterized by a diverse range of mixing equipment, including high-shear mixers, planetary mixers, vacuum mixers, and specialized systems tailored to specific battery chemistries and production processes. These mixers incorporate advanced features such as precise control systems, automated operation, and in-line sensors for real-time monitoring and quality control. Key selling propositions include improved mixing efficiency, reduced processing time, enhanced consistency of the battery slurry, and minimized energy consumption. Ongoing technological advancements focus on increasing throughput, improving scalability, and enhancing the automation capabilities of these systems to reduce labor costs and optimize overall production efficiency.
Key Drivers, Barriers & Challenges in Global Mixing Equipment Market For Battery Manufacturing
Key Drivers:
The increasing demand for electric vehicles and energy storage systems is the primary driver of market growth. Technological advancements in battery chemistry and manufacturing processes are also contributing to market expansion, leading to the development of more efficient and sophisticated mixing equipment. Government regulations and incentives promoting the adoption of renewable energy solutions further stimulate market growth.
Challenges:
Supply chain disruptions, particularly in sourcing critical raw materials, can significantly impact the availability and cost of mixing equipment. Stringent regulatory requirements related to safety and environmental compliance can increase production costs. Intense competition among existing and new market entrants may lead to price pressures and reduced profit margins. The high initial investment cost of advanced mixing systems can hinder adoption, especially for smaller battery manufacturers.
Emerging Opportunities in Global Mixing Equipment Market For Battery Manufacturing
Untapped markets in developing economies, particularly in regions with growing electric vehicle adoption and expanding renewable energy sectors, present significant growth opportunities. The development of next-generation battery technologies, such as solid-state batteries, will create demand for specialized mixing equipment with unique capabilities. Customized solutions tailored to specific battery chemistries and production processes will cater to the evolving needs of the industry. Increased focus on automation, digitalization, and integration of Industry 4.0 technologies will open new avenues for innovation and market expansion.
Growth Accelerators in the Global Mixing Equipment Market For Battery Manufacturing Industry
Technological breakthroughs in mixing technology, such as the development of high-efficiency mixers and the integration of advanced control systems, are key growth accelerators. Strategic partnerships between mixing equipment manufacturers and battery producers will foster innovation and accelerate the adoption of new technologies. Expansion into new geographical markets and diversification of product portfolios to cater to various battery chemistries and production scales will drive long-term market growth.
Key Players Shaping the Global Mixing Equipment Market For Battery Manufacturing Market
- Processall
- Charles Ross & Son Company
- MIXACO
- XIAMEN TOB NEW ENERGY TECHNOLOGY Co LTD
- Jongia Mixing Technology
- ONGOAL
- IKA India Private Limited
- SIEHE GROUP
- SCM GROUP LIMITED HK
- Xiamen Tmax Battery Equipments Limited
Notable Milestones in Global Mixing Equipment Market For Battery Manufacturing Sector
- September 2023: Fraunhofer Research Institution for Battery Cell Production utilized a 30-millimeter extruder at its new R&D site in Münster, Germany, showcasing advancements in electrode processing technology. The institution is also constructing the FFB PreFab test facility with a throughput of up to 1,200 liters of electrode/battery slurry per hour, indicating a significant increase in production capacity.
- May 2023: ONGOAL TECH showcased its advanced battery slurry mixing and material production line models at The Battery Show Europe 2023, highlighting innovative solutions and three types of slurry mixing processes. This demonstrates a strong focus on innovation within the battery mixing equipment sector.
In-Depth Global Mixing Equipment Market For Battery Manufacturing Market Outlook
The future of the global mixing equipment market for battery manufacturing looks promising, driven by sustained growth in the EV and energy storage sectors. Continued technological advancements, strategic partnerships, and expansion into new markets will further fuel market expansion. Opportunities exist for manufacturers to develop innovative solutions that address the evolving needs of the battery industry, including improving mixing efficiency, reducing production costs, and enhancing product quality. The market is poised for significant growth, offering considerable potential for companies with the ability to adapt to technological advancements and meet the evolving demand for high-performance batteries.
Global Mixing Equipment Market For Battery Manufacturing Segmentation
-
1. Type
- 1.1. Wet Mixers
- 1.2. Dry Mixers
Global Mixing Equipment Market For Battery Manufacturing Segmentation By Geography
-
1. North America
- 1.1. United States
- 1.2. Canada
- 1.3. Rest of North America
-
2. Europe
- 2.1. Germany
- 2.2. France
- 2.3. United Kingdom
- 2.4. Italy
- 2.5. Spain
- 2.6. NORDIC
- 2.7. Turkey
- 2.8. Russia
- 2.9. Rest of Europe
-
3. Asia Pacific
- 3.1. China
- 3.2. India
- 3.3. Australia
- 3.4. Japan
- 3.5. Malaysia
- 3.6. Thailand
- 3.7. Indonesia
- 3.8. Vietnam
- 3.9. Rest of Asia Pacific
-
4. Middle East and Africa
- 4.1. Saudi Arabia
- 4.2. United Arab Emirates
- 4.3. Qatar
- 4.4. Egypt
- 4.5. Nigeria
- 4.6. South Africa
- 4.7. Rest of Middle East and Africa
-
5. South America
- 5.1. Brazil
- 5.2. Argentina
- 5.3. Columbia
- 5.4. Rest of South America
Global Mixing Equipment Market For Battery Manufacturing Regional Market Share
Geographic Coverage of Global Mixing Equipment Market For Battery Manufacturing
Global Mixing Equipment Market For Battery Manufacturing REPORT HIGHLIGHTS
| Aspects | Details |
|---|---|
| Study Period | 2020-2034 |
| Base Year | 2025 |
| Estimated Year | 2026 |
| Forecast Period | 2026-2034 |
| Historical Period | 2020-2025 |
| Growth Rate | CAGR of 21.20% from 2020-2034 |
| Segmentation |
|
Table of Contents
- 1. Introduction
- 1.1. Research Scope
- 1.2. Market Segmentation
- 1.3. Research Objective
- 1.4. Definitions and Assumptions
- 2. Executive Summary
- 2.1. Market Snapshot
- 3. Market Dynamics
- 3.1. Market Drivers
- 3.2. Market Restrains
- 3.3. Market Trends
- 3.4. Market Opportunities
- 4. Market Factor Analysis
- 4.1. Porters Five Forces
- 4.1.1. Bargaining Power of Suppliers
- 4.1.2. Bargaining Power of Buyers
- 4.1.3. Threat of New Entrants
- 4.1.4. Threat of Substitutes
- 4.1.5. Competitive Rivalry
- 4.2. PESTEL analysis
- 4.3. BCG Analysis
- 4.3.1. Stars (High Growth, High Market Share)
- 4.3.2. Cash Cows (Low Growth, High Market Share)
- 4.3.3. Question Mark (High Growth, Low Market Share)
- 4.3.4. Dogs (Low Growth, Low Market Share)
- 4.4. Ansoff Matrix Analysis
- 4.5. Supply Chain Analysis
- 4.6. Regulatory Landscape
- 4.7. Current Market Potential and Opportunity Assessment (TAM–SAM–SOM Framework)
- 4.8. NRP Analyst Note
- 4.1. Porters Five Forces
- 5. Market Analysis, Insights and Forecast 2021-2033
- 5.1. Market Analysis, Insights and Forecast - by Type
- 5.1.1. Wet Mixers
- 5.1.2. Dry Mixers
- 5.2. Market Analysis, Insights and Forecast - by Region
- 5.2.1. North America
- 5.2.2. Europe
- 5.2.3. Asia Pacific
- 5.2.4. Middle East and Africa
- 5.2.5. South America
- 5.1. Market Analysis, Insights and Forecast - by Type
- 6. Global Mixing Equipment Market For Battery Manufacturing Analysis, Insights and Forecast, 2021-2033
- 6.1. Market Analysis, Insights and Forecast - by Type
- 6.1.1. Wet Mixers
- 6.1.2. Dry Mixers
- 6.1. Market Analysis, Insights and Forecast - by Type
- 7. North America Global Mixing Equipment Market For Battery Manufacturing Analysis, Insights and Forecast, 2020-2032
- 7.1. Market Analysis, Insights and Forecast - by Type
- 7.1.1. Wet Mixers
- 7.1.2. Dry Mixers
- 7.1. Market Analysis, Insights and Forecast - by Type
- 8. Europe Global Mixing Equipment Market For Battery Manufacturing Analysis, Insights and Forecast, 2020-2032
- 8.1. Market Analysis, Insights and Forecast - by Type
- 8.1.1. Wet Mixers
- 8.1.2. Dry Mixers
- 8.1. Market Analysis, Insights and Forecast - by Type
- 9. Asia Pacific Global Mixing Equipment Market For Battery Manufacturing Analysis, Insights and Forecast, 2020-2032
- 9.1. Market Analysis, Insights and Forecast - by Type
- 9.1.1. Wet Mixers
- 9.1.2. Dry Mixers
- 9.1. Market Analysis, Insights and Forecast - by Type
- 10. Middle East and Africa Global Mixing Equipment Market For Battery Manufacturing Analysis, Insights and Forecast, 2020-2032
- 10.1. Market Analysis, Insights and Forecast - by Type
- 10.1.1. Wet Mixers
- 10.1.2. Dry Mixers
- 10.1. Market Analysis, Insights and Forecast - by Type
- 11. South America Global Mixing Equipment Market For Battery Manufacturing Analysis, Insights and Forecast, 2020-2032
- 11.1. Market Analysis, Insights and Forecast - by Type
- 11.1.1. Wet Mixers
- 11.1.2. Dry Mixers
- 11.1. Market Analysis, Insights and Forecast - by Type
- 12. Competitive Analysis
- 12.1. Company Profiles
- 12.1.1 Processall
- 12.1.1.1. Company Overview
- 12.1.1.2. Products
- 12.1.1.3. Company Financials
- 12.1.1.4. SWOT Analysis
- 12.1.2 Charles Ross & Son Company
- 12.1.2.1. Company Overview
- 12.1.2.2. Products
- 12.1.2.3. Company Financials
- 12.1.2.4. SWOT Analysis
- 12.1.3 MIXACO
- 12.1.3.1. Company Overview
- 12.1.3.2. Products
- 12.1.3.3. Company Financials
- 12.1.3.4. SWOT Analysis
- 12.1.4 XIAMEN TOB NEW ENERGY TECHNOLOGY Co LTD
- 12.1.4.1. Company Overview
- 12.1.4.2. Products
- 12.1.4.3. Company Financials
- 12.1.4.4. SWOT Analysis
- 12.1.5 Jongia Mixing Technology
- 12.1.5.1. Company Overview
- 12.1.5.2. Products
- 12.1.5.3. Company Financials
- 12.1.5.4. SWOT Analysis
- 12.1.6 ONGOAL
- 12.1.6.1. Company Overview
- 12.1.6.2. Products
- 12.1.6.3. Company Financials
- 12.1.6.4. SWOT Analysis
- 12.1.7 IKA India Private Limited
- 12.1.7.1. Company Overview
- 12.1.7.2. Products
- 12.1.7.3. Company Financials
- 12.1.7.4. SWOT Analysis
- 12.1.8 SIEHE GROUP
- 12.1.8.1. Company Overview
- 12.1.8.2. Products
- 12.1.8.3. Company Financials
- 12.1.8.4. SWOT Analysis
- 12.1.9 SCM GROUP LIMITED HK
- 12.1.9.1. Company Overview
- 12.1.9.2. Products
- 12.1.9.3. Company Financials
- 12.1.9.4. SWOT Analysis
- 12.1.10 Xiamen Tmax Battery Equipments Limited
- 12.1.10.1. Company Overview
- 12.1.10.2. Products
- 12.1.10.3. Company Financials
- 12.1.10.4. SWOT Analysis
- 12.1.1 Processall
- 12.2. Market Entropy
- 12.2.1 Company's Key Areas Served
- 12.2.2 Recent Developments
- 12.3. Company Market Share Analysis 2025
- 12.3.1 Top 5 Companies Market Share Analysis
- 12.3.2 Top 3 Companies Market Share Analysis
- 12.4. List of Potential Customers
- 13. Research Methodology
List of Figures
- Figure 1: Global Global Mixing Equipment Market For Battery Manufacturing Revenue Breakdown (Million, %) by Region 2025 & 2033
- Figure 2: Global Global Mixing Equipment Market For Battery Manufacturing Volume Breakdown (K Unit, %) by Region 2025 & 2033
- Figure 3: North America Global Mixing Equipment Market For Battery Manufacturing Revenue (Million), by Type 2025 & 2033
- Figure 4: North America Global Mixing Equipment Market For Battery Manufacturing Volume (K Unit), by Type 2025 & 2033
- Figure 5: North America Global Mixing Equipment Market For Battery Manufacturing Revenue Share (%), by Type 2025 & 2033
- Figure 6: North America Global Mixing Equipment Market For Battery Manufacturing Volume Share (%), by Type 2025 & 2033
- Figure 7: North America Global Mixing Equipment Market For Battery Manufacturing Revenue (Million), by Country 2025 & 2033
- Figure 8: North America Global Mixing Equipment Market For Battery Manufacturing Volume (K Unit), by Country 2025 & 2033
- Figure 9: North America Global Mixing Equipment Market For Battery Manufacturing Revenue Share (%), by Country 2025 & 2033
- Figure 10: North America Global Mixing Equipment Market For Battery Manufacturing Volume Share (%), by Country 2025 & 2033
- Figure 11: Europe Global Mixing Equipment Market For Battery Manufacturing Revenue (Million), by Type 2025 & 2033
- Figure 12: Europe Global Mixing Equipment Market For Battery Manufacturing Volume (K Unit), by Type 2025 & 2033
- Figure 13: Europe Global Mixing Equipment Market For Battery Manufacturing Revenue Share (%), by Type 2025 & 2033
- Figure 14: Europe Global Mixing Equipment Market For Battery Manufacturing Volume Share (%), by Type 2025 & 2033
- Figure 15: Europe Global Mixing Equipment Market For Battery Manufacturing Revenue (Million), by Country 2025 & 2033
- Figure 16: Europe Global Mixing Equipment Market For Battery Manufacturing Volume (K Unit), by Country 2025 & 2033
- Figure 17: Europe Global Mixing Equipment Market For Battery Manufacturing Revenue Share (%), by Country 2025 & 2033
- Figure 18: Europe Global Mixing Equipment Market For Battery Manufacturing Volume Share (%), by Country 2025 & 2033
- Figure 19: Asia Pacific Global Mixing Equipment Market For Battery Manufacturing Revenue (Million), by Type 2025 & 2033
- Figure 20: Asia Pacific Global Mixing Equipment Market For Battery Manufacturing Volume (K Unit), by Type 2025 & 2033
- Figure 21: Asia Pacific Global Mixing Equipment Market For Battery Manufacturing Revenue Share (%), by Type 2025 & 2033
- Figure 22: Asia Pacific Global Mixing Equipment Market For Battery Manufacturing Volume Share (%), by Type 2025 & 2033
- Figure 23: Asia Pacific Global Mixing Equipment Market For Battery Manufacturing Revenue (Million), by Country 2025 & 2033
- Figure 24: Asia Pacific Global Mixing Equipment Market For Battery Manufacturing Volume (K Unit), by Country 2025 & 2033
- Figure 25: Asia Pacific Global Mixing Equipment Market For Battery Manufacturing Revenue Share (%), by Country 2025 & 2033
- Figure 26: Asia Pacific Global Mixing Equipment Market For Battery Manufacturing Volume Share (%), by Country 2025 & 2033
- Figure 27: Middle East and Africa Global Mixing Equipment Market For Battery Manufacturing Revenue (Million), by Type 2025 & 2033
- Figure 28: Middle East and Africa Global Mixing Equipment Market For Battery Manufacturing Volume (K Unit), by Type 2025 & 2033
- Figure 29: Middle East and Africa Global Mixing Equipment Market For Battery Manufacturing Revenue Share (%), by Type 2025 & 2033
- Figure 30: Middle East and Africa Global Mixing Equipment Market For Battery Manufacturing Volume Share (%), by Type 2025 & 2033
- Figure 31: Middle East and Africa Global Mixing Equipment Market For Battery Manufacturing Revenue (Million), by Country 2025 & 2033
- Figure 32: Middle East and Africa Global Mixing Equipment Market For Battery Manufacturing Volume (K Unit), by Country 2025 & 2033
- Figure 33: Middle East and Africa Global Mixing Equipment Market For Battery Manufacturing Revenue Share (%), by Country 2025 & 2033
- Figure 34: Middle East and Africa Global Mixing Equipment Market For Battery Manufacturing Volume Share (%), by Country 2025 & 2033
- Figure 35: South America Global Mixing Equipment Market For Battery Manufacturing Revenue (Million), by Type 2025 & 2033
- Figure 36: South America Global Mixing Equipment Market For Battery Manufacturing Volume (K Unit), by Type 2025 & 2033
- Figure 37: South America Global Mixing Equipment Market For Battery Manufacturing Revenue Share (%), by Type 2025 & 2033
- Figure 38: South America Global Mixing Equipment Market For Battery Manufacturing Volume Share (%), by Type 2025 & 2033
- Figure 39: South America Global Mixing Equipment Market For Battery Manufacturing Revenue (Million), by Country 2025 & 2033
- Figure 40: South America Global Mixing Equipment Market For Battery Manufacturing Volume (K Unit), by Country 2025 & 2033
- Figure 41: South America Global Mixing Equipment Market For Battery Manufacturing Revenue Share (%), by Country 2025 & 2033
- Figure 42: South America Global Mixing Equipment Market For Battery Manufacturing Volume Share (%), by Country 2025 & 2033
List of Tables
- Table 1: Global Mixing Equipment Market For Battery Manufacturing Revenue Million Forecast, by Type 2020 & 2033
- Table 2: Global Mixing Equipment Market For Battery Manufacturing Volume K Unit Forecast, by Type 2020 & 2033
- Table 3: Global Mixing Equipment Market For Battery Manufacturing Revenue Million Forecast, by Region 2020 & 2033
- Table 4: Global Mixing Equipment Market For Battery Manufacturing Volume K Unit Forecast, by Region 2020 & 2033
- Table 5: Global Mixing Equipment Market For Battery Manufacturing Revenue Million Forecast, by Type 2020 & 2033
- Table 6: Global Mixing Equipment Market For Battery Manufacturing Volume K Unit Forecast, by Type 2020 & 2033
- Table 7: Global Mixing Equipment Market For Battery Manufacturing Revenue Million Forecast, by Country 2020 & 2033
- Table 8: Global Mixing Equipment Market For Battery Manufacturing Volume K Unit Forecast, by Country 2020 & 2033
- Table 9: United States Global Mixing Equipment Market For Battery Manufacturing Revenue (Million) Forecast, by Application 2020 & 2033
- Table 10: United States Global Mixing Equipment Market For Battery Manufacturing Volume (K Unit) Forecast, by Application 2020 & 2033
- Table 11: Canada Global Mixing Equipment Market For Battery Manufacturing Revenue (Million) Forecast, by Application 2020 & 2033
- Table 12: Canada Global Mixing Equipment Market For Battery Manufacturing Volume (K Unit) Forecast, by Application 2020 & 2033
- Table 13: Rest of North America Global Mixing Equipment Market For Battery Manufacturing Revenue (Million) Forecast, by Application 2020 & 2033
- Table 14: Rest of North America Global Mixing Equipment Market For Battery Manufacturing Volume (K Unit) Forecast, by Application 2020 & 2033
- Table 15: Global Mixing Equipment Market For Battery Manufacturing Revenue Million Forecast, by Type 2020 & 2033
- Table 16: Global Mixing Equipment Market For Battery Manufacturing Volume K Unit Forecast, by Type 2020 & 2033
- Table 17: Global Mixing Equipment Market For Battery Manufacturing Revenue Million Forecast, by Country 2020 & 2033
- Table 18: Global Mixing Equipment Market For Battery Manufacturing Volume K Unit Forecast, by Country 2020 & 2033
- Table 19: Germany Global Mixing Equipment Market For Battery Manufacturing Revenue (Million) Forecast, by Application 2020 & 2033
- Table 20: Germany Global Mixing Equipment Market For Battery Manufacturing Volume (K Unit) Forecast, by Application 2020 & 2033
- Table 21: France Global Mixing Equipment Market For Battery Manufacturing Revenue (Million) Forecast, by Application 2020 & 2033
- Table 22: France Global Mixing Equipment Market For Battery Manufacturing Volume (K Unit) Forecast, by Application 2020 & 2033
- Table 23: United Kingdom Global Mixing Equipment Market For Battery Manufacturing Revenue (Million) Forecast, by Application 2020 & 2033
- Table 24: United Kingdom Global Mixing Equipment Market For Battery Manufacturing Volume (K Unit) Forecast, by Application 2020 & 2033
- Table 25: Italy Global Mixing Equipment Market For Battery Manufacturing Revenue (Million) Forecast, by Application 2020 & 2033
- Table 26: Italy Global Mixing Equipment Market For Battery Manufacturing Volume (K Unit) Forecast, by Application 2020 & 2033
- Table 27: Spain Global Mixing Equipment Market For Battery Manufacturing Revenue (Million) Forecast, by Application 2020 & 2033
- Table 28: Spain Global Mixing Equipment Market For Battery Manufacturing Volume (K Unit) Forecast, by Application 2020 & 2033
- Table 29: NORDIC Global Mixing Equipment Market For Battery Manufacturing Revenue (Million) Forecast, by Application 2020 & 2033
- Table 30: NORDIC Global Mixing Equipment Market For Battery Manufacturing Volume (K Unit) Forecast, by Application 2020 & 2033
- Table 31: Turkey Global Mixing Equipment Market For Battery Manufacturing Revenue (Million) Forecast, by Application 2020 & 2033
- Table 32: Turkey Global Mixing Equipment Market For Battery Manufacturing Volume (K Unit) Forecast, by Application 2020 & 2033
- Table 33: Russia Global Mixing Equipment Market For Battery Manufacturing Revenue (Million) Forecast, by Application 2020 & 2033
- Table 34: Russia Global Mixing Equipment Market For Battery Manufacturing Volume (K Unit) Forecast, by Application 2020 & 2033
- Table 35: Rest of Europe Global Mixing Equipment Market For Battery Manufacturing Revenue (Million) Forecast, by Application 2020 & 2033
- Table 36: Rest of Europe Global Mixing Equipment Market For Battery Manufacturing Volume (K Unit) Forecast, by Application 2020 & 2033
- Table 37: Global Mixing Equipment Market For Battery Manufacturing Revenue Million Forecast, by Type 2020 & 2033
- Table 38: Global Mixing Equipment Market For Battery Manufacturing Volume K Unit Forecast, by Type 2020 & 2033
- Table 39: Global Mixing Equipment Market For Battery Manufacturing Revenue Million Forecast, by Country 2020 & 2033
- Table 40: Global Mixing Equipment Market For Battery Manufacturing Volume K Unit Forecast, by Country 2020 & 2033
- Table 41: China Global Mixing Equipment Market For Battery Manufacturing Revenue (Million) Forecast, by Application 2020 & 2033
- Table 42: China Global Mixing Equipment Market For Battery Manufacturing Volume (K Unit) Forecast, by Application 2020 & 2033
- Table 43: India Global Mixing Equipment Market For Battery Manufacturing Revenue (Million) Forecast, by Application 2020 & 2033
- Table 44: India Global Mixing Equipment Market For Battery Manufacturing Volume (K Unit) Forecast, by Application 2020 & 2033
- Table 45: Australia Global Mixing Equipment Market For Battery Manufacturing Revenue (Million) Forecast, by Application 2020 & 2033
- Table 46: Australia Global Mixing Equipment Market For Battery Manufacturing Volume (K Unit) Forecast, by Application 2020 & 2033
- Table 47: Japan Global Mixing Equipment Market For Battery Manufacturing Revenue (Million) Forecast, by Application 2020 & 2033
- Table 48: Japan Global Mixing Equipment Market For Battery Manufacturing Volume (K Unit) Forecast, by Application 2020 & 2033
- Table 49: Malaysia Global Mixing Equipment Market For Battery Manufacturing Revenue (Million) Forecast, by Application 2020 & 2033
- Table 50: Malaysia Global Mixing Equipment Market For Battery Manufacturing Volume (K Unit) Forecast, by Application 2020 & 2033
- Table 51: Thailand Global Mixing Equipment Market For Battery Manufacturing Revenue (Million) Forecast, by Application 2020 & 2033
- Table 52: Thailand Global Mixing Equipment Market For Battery Manufacturing Volume (K Unit) Forecast, by Application 2020 & 2033
- Table 53: Indonesia Global Mixing Equipment Market For Battery Manufacturing Revenue (Million) Forecast, by Application 2020 & 2033
- Table 54: Indonesia Global Mixing Equipment Market For Battery Manufacturing Volume (K Unit) Forecast, by Application 2020 & 2033
- Table 55: Vietnam Global Mixing Equipment Market For Battery Manufacturing Revenue (Million) Forecast, by Application 2020 & 2033
- Table 56: Vietnam Global Mixing Equipment Market For Battery Manufacturing Volume (K Unit) Forecast, by Application 2020 & 2033
- Table 57: Rest of Asia Pacific Global Mixing Equipment Market For Battery Manufacturing Revenue (Million) Forecast, by Application 2020 & 2033
- Table 58: Rest of Asia Pacific Global Mixing Equipment Market For Battery Manufacturing Volume (K Unit) Forecast, by Application 2020 & 2033
- Table 59: Global Mixing Equipment Market For Battery Manufacturing Revenue Million Forecast, by Type 2020 & 2033
- Table 60: Global Mixing Equipment Market For Battery Manufacturing Volume K Unit Forecast, by Type 2020 & 2033
- Table 61: Global Mixing Equipment Market For Battery Manufacturing Revenue Million Forecast, by Country 2020 & 2033
- Table 62: Global Mixing Equipment Market For Battery Manufacturing Volume K Unit Forecast, by Country 2020 & 2033
- Table 63: Saudi Arabia Global Mixing Equipment Market For Battery Manufacturing Revenue (Million) Forecast, by Application 2020 & 2033
- Table 64: Saudi Arabia Global Mixing Equipment Market For Battery Manufacturing Volume (K Unit) Forecast, by Application 2020 & 2033
- Table 65: United Arab Emirates Global Mixing Equipment Market For Battery Manufacturing Revenue (Million) Forecast, by Application 2020 & 2033
- Table 66: United Arab Emirates Global Mixing Equipment Market For Battery Manufacturing Volume (K Unit) Forecast, by Application 2020 & 2033
- Table 67: Qatar Global Mixing Equipment Market For Battery Manufacturing Revenue (Million) Forecast, by Application 2020 & 2033
- Table 68: Qatar Global Mixing Equipment Market For Battery Manufacturing Volume (K Unit) Forecast, by Application 2020 & 2033
- Table 69: Egypt Global Mixing Equipment Market For Battery Manufacturing Revenue (Million) Forecast, by Application 2020 & 2033
- Table 70: Egypt Global Mixing Equipment Market For Battery Manufacturing Volume (K Unit) Forecast, by Application 2020 & 2033
- Table 71: Nigeria Global Mixing Equipment Market For Battery Manufacturing Revenue (Million) Forecast, by Application 2020 & 2033
- Table 72: Nigeria Global Mixing Equipment Market For Battery Manufacturing Volume (K Unit) Forecast, by Application 2020 & 2033
- Table 73: South Africa Global Mixing Equipment Market For Battery Manufacturing Revenue (Million) Forecast, by Application 2020 & 2033
- Table 74: South Africa Global Mixing Equipment Market For Battery Manufacturing Volume (K Unit) Forecast, by Application 2020 & 2033
- Table 75: Rest of Middle East and Africa Global Mixing Equipment Market For Battery Manufacturing Revenue (Million) Forecast, by Application 2020 & 2033
- Table 76: Rest of Middle East and Africa Global Mixing Equipment Market For Battery Manufacturing Volume (K Unit) Forecast, by Application 2020 & 2033
- Table 77: Global Mixing Equipment Market For Battery Manufacturing Revenue Million Forecast, by Type 2020 & 2033
- Table 78: Global Mixing Equipment Market For Battery Manufacturing Volume K Unit Forecast, by Type 2020 & 2033
- Table 79: Global Mixing Equipment Market For Battery Manufacturing Revenue Million Forecast, by Country 2020 & 2033
- Table 80: Global Mixing Equipment Market For Battery Manufacturing Volume K Unit Forecast, by Country 2020 & 2033
- Table 81: Brazil Global Mixing Equipment Market For Battery Manufacturing Revenue (Million) Forecast, by Application 2020 & 2033
- Table 82: Brazil Global Mixing Equipment Market For Battery Manufacturing Volume (K Unit) Forecast, by Application 2020 & 2033
- Table 83: Argentina Global Mixing Equipment Market For Battery Manufacturing Revenue (Million) Forecast, by Application 2020 & 2033
- Table 84: Argentina Global Mixing Equipment Market For Battery Manufacturing Volume (K Unit) Forecast, by Application 2020 & 2033
- Table 85: Columbia Global Mixing Equipment Market For Battery Manufacturing Revenue (Million) Forecast, by Application 2020 & 2033
- Table 86: Columbia Global Mixing Equipment Market For Battery Manufacturing Volume (K Unit) Forecast, by Application 2020 & 2033
- Table 87: Rest of South America Global Mixing Equipment Market For Battery Manufacturing Revenue (Million) Forecast, by Application 2020 & 2033
- Table 88: Rest of South America Global Mixing Equipment Market For Battery Manufacturing Volume (K Unit) Forecast, by Application 2020 & 2033
Frequently Asked Questions
1. What is the projected Compound Annual Growth Rate (CAGR) of the Global Mixing Equipment Market For Battery Manufacturing?
The projected CAGR is approximately 21.20%.
2. Which companies are prominent players in the Global Mixing Equipment Market For Battery Manufacturing?
Key companies in the market include Processall, Charles Ross & Son Company, MIXACO, XIAMEN TOB NEW ENERGY TECHNOLOGY Co LTD, Jongia Mixing Technology, ONGOAL, IKA India Private Limited, SIEHE GROUP, SCM GROUP LIMITED HK, Xiamen Tmax Battery Equipments Limited.
3. What are the main segments of the Global Mixing Equipment Market For Battery Manufacturing?
The market segments include Type.
4. Can you provide details about the market size?
The market size is estimated to be USD 1.69 Million as of 2022.
5. What are some drivers contributing to market growth?
4.; The Increase in Investments to Enhance the Battery Production Capacity4.; Rising Adoption of Electric Vehicles.
6. What are the notable trends driving market growth?
Investments To Enhance the Battery Production Capacity is expected to Drive the Market Growth.
7. Are there any restraints impacting market growth?
4.; The High Logistic Cost.
8. Can you provide examples of recent developments in the market?
September 2023: Fraunhofer Research Institution for Battery Cell Production used a 30-millimeter extruder at FFB’s new R&D site in Münster, Germany. Fraunhofer-Gesellschaft’s research organization is also building its FFB PreFab test facility, with a throughput of up to 1,200 liters of electrode/battery slurry per hour.
9. What pricing options are available for accessing the report?
Pricing options include single-user, multi-user, and enterprise licenses priced at USD 4750, USD 5250, and USD 8750 respectively.
10. Is the market size provided in terms of value or volume?
The market size is provided in terms of value, measured in Million and volume, measured in K Unit.
11. Are there any specific market keywords associated with the report?
Yes, the market keyword associated with the report is "Global Mixing Equipment Market For Battery Manufacturing," which aids in identifying and referencing the specific market segment covered.
12. How do I determine which pricing option suits my needs best?
The pricing options vary based on user requirements and access needs. Individual users may opt for single-user licenses, while businesses requiring broader access may choose multi-user or enterprise licenses for cost-effective access to the report.
13. Are there any additional resources or data provided in the Global Mixing Equipment Market For Battery Manufacturing report?
While the report offers comprehensive insights, it's advisable to review the specific contents or supplementary materials provided to ascertain if additional resources or data are available.
14. How can I stay updated on further developments or reports in the Global Mixing Equipment Market For Battery Manufacturing?
To stay informed about further developments, trends, and reports in the Global Mixing Equipment Market For Battery Manufacturing, consider subscribing to industry newsletters, following relevant companies and organizations, or regularly checking reputable industry news sources and publications.
Methodology
Step 1 - Identification of Relevant Samples Size from Population Database


Step 2 - Approaches for Defining Global Market Size (Value, Volume* & Price*)

Note*: In applicable scenarios
Step 3 - Data Sources
Primary Research
- Web Analytics
- Survey Reports
- Research Institute
- Latest Research Reports
- Opinion Leaders
Secondary Research
- Annual Reports
- White Paper
- Latest Press Release
- Industry Association
- Paid Database
- Investor Presentations

Step 4 - Data Triangulation
Involves using different sources of information in order to increase the validity of a study
These sources are likely to be stakeholders in a program - participants, other researchers, program staff, other community members, and so on.
Then we put all data in single framework & apply various statistical tools to find out the dynamic on the market.
During the analysis stage, feedback from the stakeholder groups would be compared to determine areas of agreement as well as areas of divergence