

Key Insights
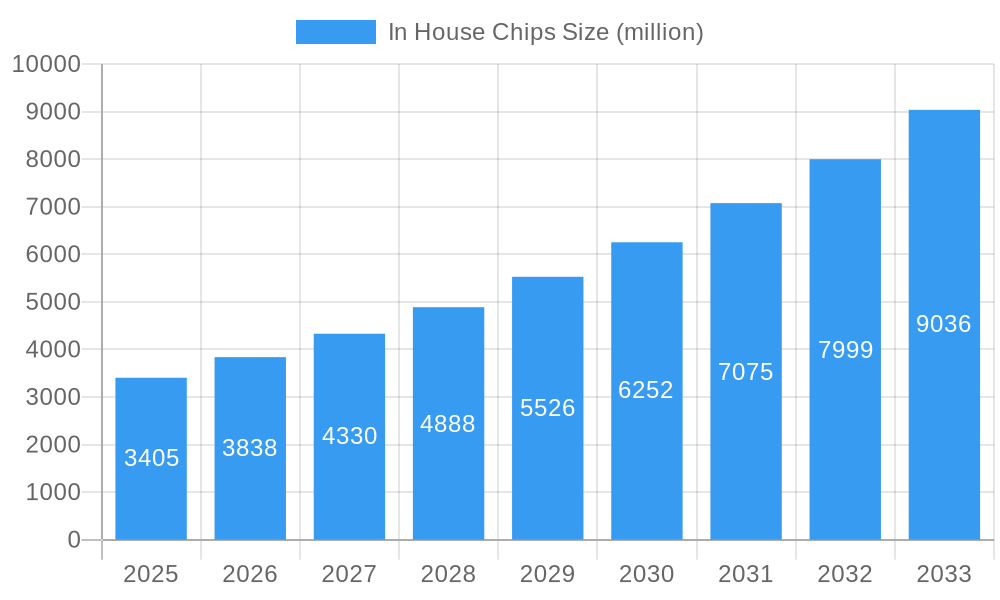
The in-house chip market, currently valued at approximately $3.405 billion (2025), is projected to experience robust growth, exhibiting a Compound Annual Growth Rate (CAGR) of 12.8% from 2025 to 2033. This expansion is fueled by several key drivers. The increasing demand for customized hardware solutions tailored to specific application needs is a significant factor. Companies across diverse sectors, from consumer electronics to automotive and data centers, are seeking enhanced performance, energy efficiency, and security features, leading them to invest in designing and manufacturing their own chips. The rise of artificial intelligence (AI), the Internet of Things (IoT), and 5G technology are further propelling this trend, as these technologies demand high-performance processing capabilities that can be best addressed through bespoke chip designs. Furthermore, the desire for greater control over supply chains and intellectual property is incentivizing companies to bring chip production in-house, mitigating reliance on external vendors and potential disruptions.
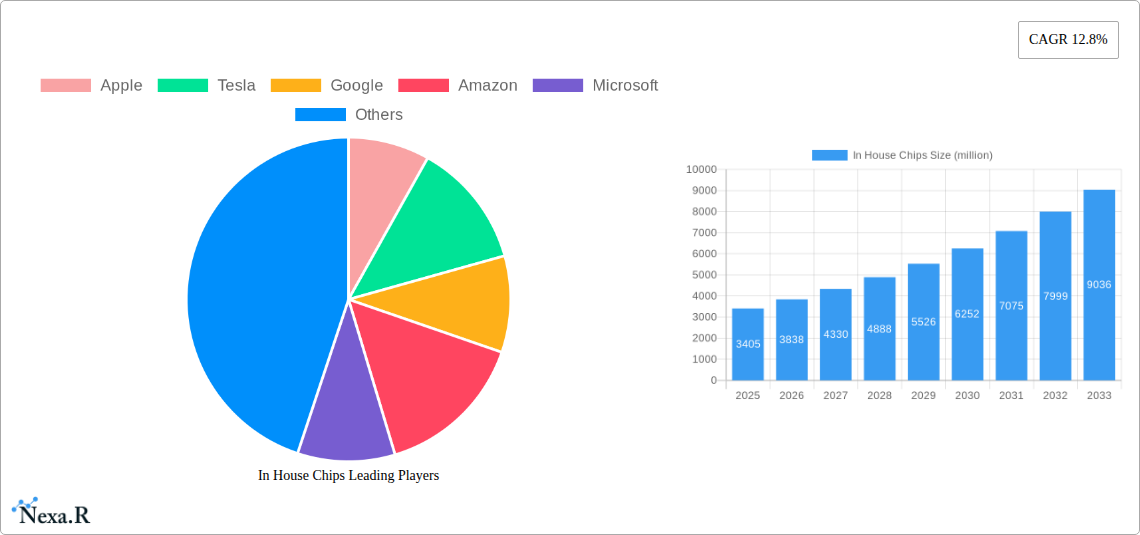
In House Chips Market Size (In Billion)
However, the market also faces certain restraints. The substantial initial investment required for in-house chip design and manufacturing capabilities can be a significant barrier to entry for smaller companies. The complexities of semiconductor fabrication, requiring specialized expertise and advanced equipment, also pose a challenge. Competition from established chip manufacturers with economies of scale remains a factor. Nonetheless, the long-term benefits of customized performance, enhanced security, and reduced reliance on external suppliers are likely to outweigh these challenges, resulting in sustained market growth throughout the forecast period. The companies mentioned – a mix of technology giants and established electronics manufacturers – are actively shaping this evolving market landscape.
In House Chips Company Market Share
In-House Chips Market Report: 2019-2033
This comprehensive report provides an in-depth analysis of the burgeoning In-House Chips market, projecting robust growth from 2025 to 2033. Targeting industry professionals, investors, and strategic decision-makers, the report leverages extensive data analysis to offer actionable insights into market dynamics, technological advancements, and key players. The report covers a wide range of segments within the parent market of semiconductor chips and the child market of custom designed chips. It features a detailed analysis of leading companies, including Apple, Tesla, Google, Amazon, and others, offering a 360° view of this rapidly evolving landscape.
Study Period: 2019–2033 | Base Year: 2025 | Estimated Year: 2025 | Forecast Period: 2025–2033 | Historical Period: 2019–2024
In House Chips Market Dynamics & Structure
This section analyzes the intricate structure and dynamics of the in-house chips market, considering market concentration, innovation, regulatory aspects, competition, and market trends. The global in-house chip market is estimated to be valued at $xx million in 2025.
- Market Concentration: The market exhibits a moderately concentrated structure, with a few dominant players (Apple, Google, Tesla) holding significant market share. However, increasing adoption by smaller companies is leading to fragmentation. In 2025, the top 5 players account for approximately 60% of the market.
- Technological Innovation: Continuous advancements in semiconductor technology, such as advanced node processes (e.g., 5nm, 3nm), are key drivers. Furthermore, the increasing demand for specialized chips for AI, machine learning, and high-performance computing fuels innovation.
- Regulatory Frameworks: Government regulations regarding data security and intellectual property influence chip design and production. Geopolitical factors also play a crucial role, impacting supply chains and trade relationships.
- Competitive Product Substitutes: While there are limited direct substitutes for custom-designed in-house chips, utilizing off-the-shelf solutions presents a major alternative, though potentially at a performance cost.
- End-User Demographics: The primary end-users are technology giants, automotive manufacturers, and cloud service providers, with growth increasingly driven by the expansion of AI applications across various sectors.
- M&A Trends: The past five years witnessed a significant increase in mergers and acquisitions, primarily driven by companies seeking to enhance their chip design capabilities and secure supply chains. Over 100 M&A deals related to In-House Chips have occurred during the historical period, with an average deal value of $xx million.
In House Chips Growth Trends & Insights
The In-House Chips market showcases consistent growth from 2019-2024, driven by strong adoption across various sectors. The market is projected to experience a compound annual growth rate (CAGR) of xx% during the forecast period (2025-2033), reaching an estimated value of $xxx million by 2033. This growth is fueled by increasing demand for high-performance, customized chips. Market penetration in key sectors like automotive and data centers is expected to significantly increase over the coming years. Technological advancements, particularly in AI and machine learning, are driving the demand for sophisticated, specialized chips, thereby contributing to the rapid expansion of the market. Consumer behavior shifts towards advanced mobile and IoT devices further accelerate this growth trend.
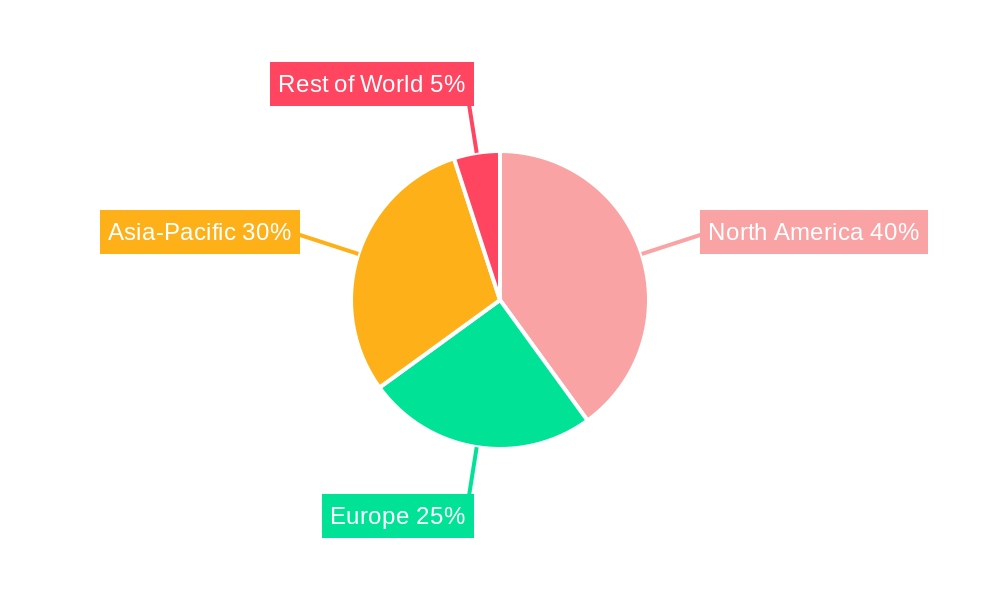
Dominant Regions, Countries, or Segments in In House Chips
North America currently holds the largest market share in the in-house chip market, followed by Asia-Pacific. However, Asia-Pacific is expected to experience the fastest growth in the forecast period.
- North America: Strong presence of major tech companies (Apple, Google, etc.), robust R&D investment, and established semiconductor manufacturing infrastructure contribute to its dominance.
- Asia-Pacific: Rapid growth is driven by increasing smartphone penetration, expanding data center infrastructure, and government support for the semiconductor industry in regions like China, South Korea, and Taiwan.
- Europe: Significant investments in AI and autonomous vehicles contribute to moderate growth, however, it remains behind North America and Asia-Pacific.
In House Chips Product Landscape
The In-House Chip market is characterized by a diverse product landscape, encompassing a range of chip architectures, technologies, and applications tailored to specific needs. These chips leverage advancements like advanced process nodes and specialized memory architectures to deliver optimal performance and efficiency. Unique selling propositions often include optimized power consumption, enhanced security features, or custom functionalities tailored to specific hardware platforms. These innovations drive competitiveness and expand market applications.
Key Drivers, Barriers & Challenges in In House Chips
Key Drivers: The market is driven by the increasing demand for high-performance computing, AI applications, and advanced mobile devices; the need for customized chips tailored to specific applications; and the growing adoption of IoT devices.
Challenges: Supply chain disruptions, especially concerning specialized components and materials, pose significant challenges. Geopolitical uncertainties and trade restrictions impact the availability and cost of raw materials and manufacturing capacity. Furthermore, intense competition among established players and the emergence of new entrants add complexity to the market dynamics. The high cost of design and manufacturing can also restrict entry for smaller companies.
Emerging Opportunities in In House Chips
Emerging opportunities lie in the expansion of the automotive, healthcare, and industrial automation sectors. The growing demand for edge computing and the development of new chip architectures for specific applications, such as augmented reality and virtual reality, are poised to drive significant growth in the future. The exploration of new materials and manufacturing techniques further presents opportunities for innovation and market expansion.
Growth Accelerators in the In House Chips Industry
Technological breakthroughs in areas such as 3D chip stacking, neuromorphic computing, and quantum computing hold the key to unlocking significant advancements. Strategic partnerships between chip designers and manufacturers are crucial for accelerating the development and deployment of advanced chips. Aggressive market expansion into emerging markets and the integration of in-house chips into a wider range of applications will also drive growth.
Notable Milestones in In House Chips Sector
- 2020: Apple announces its M1 chip, marking a significant shift towards in-house silicon for its Mac line.
- 2021: Tesla reveals its in-house developed Full Self-Driving chip, enhancing its autonomous driving capabilities.
- 2022: Google unveils its Tensor processing units (TPUs) for AI applications, furthering its dominance in the AI computing space.
- 2023: Amazon announces its own custom-designed chips for cloud computing, improving efficiency and performance within its AWS infrastructure. (Further milestones will be included in the final report based on available data)
In-Depth In House Chips Market Outlook
The in-house chip market is poised for sustained growth, driven by persistent technological advancements and increasing demand across various industries. Future market potential is significant, particularly in areas like AI, automotive, and IoT. Strategic opportunities exist for companies to leverage technological breakthroughs, build strong partnerships, and expand their market reach, capitalizing on the increasing demand for specialized and high-performance chips.
In House Chips Segmentation
-
1. Application
- 1.1. Consumer Electronics
- 1.2. Autonomous Driving
- 1.3. Cloud & Data Centers
- 1.4. Internet of Things
- 1.5. Others
-
2. Type
- 2.1. ASICs
- 2.2. System on Chip
- 2.3. Others
In House Chips Segmentation By Geography
-
1. North America
- 1.1. United States
- 1.2. Canada
- 1.3. Mexico
-
2. South America
- 2.1. Brazil
- 2.2. Argentina
- 2.3. Rest of South America
-
3. Europe
- 3.1. United Kingdom
- 3.2. Germany
- 3.3. France
- 3.4. Italy
- 3.5. Spain
- 3.6. Russia
- 3.7. Benelux
- 3.8. Nordics
- 3.9. Rest of Europe
-
4. Middle East & Africa
- 4.1. Turkey
- 4.2. Israel
- 4.3. GCC
- 4.4. North Africa
- 4.5. South Africa
- 4.6. Rest of Middle East & Africa
-
5. Asia Pacific
- 5.1. China
- 5.2. India
- 5.3. Japan
- 5.4. South Korea
- 5.5. ASEAN
- 5.6. Oceania
- 5.7. Rest of Asia Pacific
In House Chips Regional Market Share
Geographic Coverage of In House Chips
In House Chips REPORT HIGHLIGHTS
| Aspects | Details |
|---|---|
| Study Period | 2020-2034 |
| Base Year | 2025 |
| Estimated Year | 2026 |
| Forecast Period | 2026-2034 |
| Historical Period | 2020-2025 |
| Growth Rate | CAGR of 12.8% from 2020-2034 |
| Segmentation |
|
Table of Contents
- 1. Introduction
- 1.1. Research Scope
- 1.2. Market Segmentation
- 1.3. Research Methodology
- 1.4. Definitions and Assumptions
- 2. Executive Summary
- 2.1. Introduction
- 3. Market Dynamics
- 3.1. Introduction
- 3.2. Market Drivers
- 3.3. Market Restrains
- 3.4. Market Trends
- 4. Market Factor Analysis
- 4.1. Porters Five Forces
- 4.2. Supply/Value Chain
- 4.3. PESTEL analysis
- 4.4. Market Entropy
- 4.5. Patent/Trademark Analysis
- 5. Global In House Chips Analysis, Insights and Forecast, 2020-2032
- 5.1. Market Analysis, Insights and Forecast - by Application
- 5.1.1. Consumer Electronics
- 5.1.2. Autonomous Driving
- 5.1.3. Cloud & Data Centers
- 5.1.4. Internet of Things
- 5.1.5. Others
- 5.2. Market Analysis, Insights and Forecast - by Type
- 5.2.1. ASICs
- 5.2.2. System on Chip
- 5.2.3. Others
- 5.3. Market Analysis, Insights and Forecast - by Region
- 5.3.1. North America
- 5.3.2. South America
- 5.3.3. Europe
- 5.3.4. Middle East & Africa
- 5.3.5. Asia Pacific
- 5.1. Market Analysis, Insights and Forecast - by Application
- 6. North America In House Chips Analysis, Insights and Forecast, 2020-2032
- 6.1. Market Analysis, Insights and Forecast - by Application
- 6.1.1. Consumer Electronics
- 6.1.2. Autonomous Driving
- 6.1.3. Cloud & Data Centers
- 6.1.4. Internet of Things
- 6.1.5. Others
- 6.2. Market Analysis, Insights and Forecast - by Type
- 6.2.1. ASICs
- 6.2.2. System on Chip
- 6.2.3. Others
- 6.1. Market Analysis, Insights and Forecast - by Application
- 7. South America In House Chips Analysis, Insights and Forecast, 2020-2032
- 7.1. Market Analysis, Insights and Forecast - by Application
- 7.1.1. Consumer Electronics
- 7.1.2. Autonomous Driving
- 7.1.3. Cloud & Data Centers
- 7.1.4. Internet of Things
- 7.1.5. Others
- 7.2. Market Analysis, Insights and Forecast - by Type
- 7.2.1. ASICs
- 7.2.2. System on Chip
- 7.2.3. Others
- 7.1. Market Analysis, Insights and Forecast - by Application
- 8. Europe In House Chips Analysis, Insights and Forecast, 2020-2032
- 8.1. Market Analysis, Insights and Forecast - by Application
- 8.1.1. Consumer Electronics
- 8.1.2. Autonomous Driving
- 8.1.3. Cloud & Data Centers
- 8.1.4. Internet of Things
- 8.1.5. Others
- 8.2. Market Analysis, Insights and Forecast - by Type
- 8.2.1. ASICs
- 8.2.2. System on Chip
- 8.2.3. Others
- 8.1. Market Analysis, Insights and Forecast - by Application
- 9. Middle East & Africa In House Chips Analysis, Insights and Forecast, 2020-2032
- 9.1. Market Analysis, Insights and Forecast - by Application
- 9.1.1. Consumer Electronics
- 9.1.2. Autonomous Driving
- 9.1.3. Cloud & Data Centers
- 9.1.4. Internet of Things
- 9.1.5. Others
- 9.2. Market Analysis, Insights and Forecast - by Type
- 9.2.1. ASICs
- 9.2.2. System on Chip
- 9.2.3. Others
- 9.1. Market Analysis, Insights and Forecast - by Application
- 10. Asia Pacific In House Chips Analysis, Insights and Forecast, 2020-2032
- 10.1. Market Analysis, Insights and Forecast - by Application
- 10.1.1. Consumer Electronics
- 10.1.2. Autonomous Driving
- 10.1.3. Cloud & Data Centers
- 10.1.4. Internet of Things
- 10.1.5. Others
- 10.2. Market Analysis, Insights and Forecast - by Type
- 10.2.1. ASICs
- 10.2.2. System on Chip
- 10.2.3. Others
- 10.1. Market Analysis, Insights and Forecast - by Application
- 11. Competitive Analysis
- 11.1. Global Market Share Analysis 2025
- 11.2. Company Profiles
- 11.2.1 Apple
- 11.2.1.1. Overview
- 11.2.1.2. Products
- 11.2.1.3. SWOT Analysis
- 11.2.1.4. Recent Developments
- 11.2.1.5. Financials (Based on Availability)
- 11.2.2 Tesla
- 11.2.2.1. Overview
- 11.2.2.2. Products
- 11.2.2.3. SWOT Analysis
- 11.2.2.4. Recent Developments
- 11.2.2.5. Financials (Based on Availability)
- 11.2.3 Google
- 11.2.3.1. Overview
- 11.2.3.2. Products
- 11.2.3.3. SWOT Analysis
- 11.2.3.4. Recent Developments
- 11.2.3.5. Financials (Based on Availability)
- 11.2.4 Amazon
- 11.2.4.1. Overview
- 11.2.4.2. Products
- 11.2.4.3. SWOT Analysis
- 11.2.4.4. Recent Developments
- 11.2.4.5. Financials (Based on Availability)
- 11.2.5 Microsoft
- 11.2.5.1. Overview
- 11.2.5.2. Products
- 11.2.5.3. SWOT Analysis
- 11.2.5.4. Recent Developments
- 11.2.5.5. Financials (Based on Availability)
- 11.2.6 Intel
- 11.2.6.1. Overview
- 11.2.6.2. Products
- 11.2.6.3. SWOT Analysis
- 11.2.6.4. Recent Developments
- 11.2.6.5. Financials (Based on Availability)
- 11.2.7 Qualcomm
- 11.2.7.1. Overview
- 11.2.7.2. Products
- 11.2.7.3. SWOT Analysis
- 11.2.7.4. Recent Developments
- 11.2.7.5. Financials (Based on Availability)
- 11.2.8 NVIDIA
- 11.2.8.1. Overview
- 11.2.8.2. Products
- 11.2.8.3. SWOT Analysis
- 11.2.8.4. Recent Developments
- 11.2.8.5. Financials (Based on Availability)
- 11.2.9 AMD
- 11.2.9.1. Overview
- 11.2.9.2. Products
- 11.2.9.3. SWOT Analysis
- 11.2.9.4. Recent Developments
- 11.2.9.5. Financials (Based on Availability)
- 11.2.10 Broadcom
- 11.2.10.1. Overview
- 11.2.10.2. Products
- 11.2.10.3. SWOT Analysis
- 11.2.10.4. Recent Developments
- 11.2.10.5. Financials (Based on Availability)
- 11.2.11 Micron
- 11.2.11.1. Overview
- 11.2.11.2. Products
- 11.2.11.3. SWOT Analysis
- 11.2.11.4. Recent Developments
- 11.2.11.5. Financials (Based on Availability)
- 11.2.12 Cisco
- 11.2.12.1. Overview
- 11.2.12.2. Products
- 11.2.12.3. SWOT Analysis
- 11.2.12.4. Recent Developments
- 11.2.12.5. Financials (Based on Availability)
- 11.2.13 Arm Holdings
- 11.2.13.1. Overview
- 11.2.13.2. Products
- 11.2.13.3. SWOT Analysis
- 11.2.13.4. Recent Developments
- 11.2.13.5. Financials (Based on Availability)
- 11.2.14 Sony
- 11.2.14.1. Overview
- 11.2.14.2. Products
- 11.2.14.3. SWOT Analysis
- 11.2.14.4. Recent Developments
- 11.2.14.5. Financials (Based on Availability)
- 11.2.15 Samsung
- 11.2.15.1. Overview
- 11.2.15.2. Products
- 11.2.15.3. SWOT Analysis
- 11.2.15.4. Recent Developments
- 11.2.15.5. Financials (Based on Availability)
- 11.2.16 LG
- 11.2.16.1. Overview
- 11.2.16.2. Products
- 11.2.16.3. SWOT Analysis
- 11.2.16.4. Recent Developments
- 11.2.16.5. Financials (Based on Availability)
- 11.2.17 MediaTek
- 11.2.17.1. Overview
- 11.2.17.2. Products
- 11.2.17.3. SWOT Analysis
- 11.2.17.4. Recent Developments
- 11.2.17.5. Financials (Based on Availability)
- 11.2.18 Huawei
- 11.2.18.1. Overview
- 11.2.18.2. Products
- 11.2.18.3. SWOT Analysis
- 11.2.18.4. Recent Developments
- 11.2.18.5. Financials (Based on Availability)
- 11.2.19 Baidu
- 11.2.19.1. Overview
- 11.2.19.2. Products
- 11.2.19.3. SWOT Analysis
- 11.2.19.4. Recent Developments
- 11.2.19.5. Financials (Based on Availability)
- 11.2.20 Alibaba
- 11.2.20.1. Overview
- 11.2.20.2. Products
- 11.2.20.3. SWOT Analysis
- 11.2.20.4. Recent Developments
- 11.2.20.5. Financials (Based on Availability)
- 11.2.1 Apple
List of Figures
- Figure 1: Global In House Chips Revenue Breakdown (million, %) by Region 2025 & 2033
- Figure 2: North America In House Chips Revenue (million), by Application 2025 & 2033
- Figure 3: North America In House Chips Revenue Share (%), by Application 2025 & 2033
- Figure 4: North America In House Chips Revenue (million), by Type 2025 & 2033
- Figure 5: North America In House Chips Revenue Share (%), by Type 2025 & 2033
- Figure 6: North America In House Chips Revenue (million), by Country 2025 & 2033
- Figure 7: North America In House Chips Revenue Share (%), by Country 2025 & 2033
- Figure 8: South America In House Chips Revenue (million), by Application 2025 & 2033
- Figure 9: South America In House Chips Revenue Share (%), by Application 2025 & 2033
- Figure 10: South America In House Chips Revenue (million), by Type 2025 & 2033
- Figure 11: South America In House Chips Revenue Share (%), by Type 2025 & 2033
- Figure 12: South America In House Chips Revenue (million), by Country 2025 & 2033
- Figure 13: South America In House Chips Revenue Share (%), by Country 2025 & 2033
- Figure 14: Europe In House Chips Revenue (million), by Application 2025 & 2033
- Figure 15: Europe In House Chips Revenue Share (%), by Application 2025 & 2033
- Figure 16: Europe In House Chips Revenue (million), by Type 2025 & 2033
- Figure 17: Europe In House Chips Revenue Share (%), by Type 2025 & 2033
- Figure 18: Europe In House Chips Revenue (million), by Country 2025 & 2033
- Figure 19: Europe In House Chips Revenue Share (%), by Country 2025 & 2033
- Figure 20: Middle East & Africa In House Chips Revenue (million), by Application 2025 & 2033
- Figure 21: Middle East & Africa In House Chips Revenue Share (%), by Application 2025 & 2033
- Figure 22: Middle East & Africa In House Chips Revenue (million), by Type 2025 & 2033
- Figure 23: Middle East & Africa In House Chips Revenue Share (%), by Type 2025 & 2033
- Figure 24: Middle East & Africa In House Chips Revenue (million), by Country 2025 & 2033
- Figure 25: Middle East & Africa In House Chips Revenue Share (%), by Country 2025 & 2033
- Figure 26: Asia Pacific In House Chips Revenue (million), by Application 2025 & 2033
- Figure 27: Asia Pacific In House Chips Revenue Share (%), by Application 2025 & 2033
- Figure 28: Asia Pacific In House Chips Revenue (million), by Type 2025 & 2033
- Figure 29: Asia Pacific In House Chips Revenue Share (%), by Type 2025 & 2033
- Figure 30: Asia Pacific In House Chips Revenue (million), by Country 2025 & 2033
- Figure 31: Asia Pacific In House Chips Revenue Share (%), by Country 2025 & 2033
List of Tables
- Table 1: Global In House Chips Revenue million Forecast, by Application 2020 & 2033
- Table 2: Global In House Chips Revenue million Forecast, by Type 2020 & 2033
- Table 3: Global In House Chips Revenue million Forecast, by Region 2020 & 2033
- Table 4: Global In House Chips Revenue million Forecast, by Application 2020 & 2033
- Table 5: Global In House Chips Revenue million Forecast, by Type 2020 & 2033
- Table 6: Global In House Chips Revenue million Forecast, by Country 2020 & 2033
- Table 7: United States In House Chips Revenue (million) Forecast, by Application 2020 & 2033
- Table 8: Canada In House Chips Revenue (million) Forecast, by Application 2020 & 2033
- Table 9: Mexico In House Chips Revenue (million) Forecast, by Application 2020 & 2033
- Table 10: Global In House Chips Revenue million Forecast, by Application 2020 & 2033
- Table 11: Global In House Chips Revenue million Forecast, by Type 2020 & 2033
- Table 12: Global In House Chips Revenue million Forecast, by Country 2020 & 2033
- Table 13: Brazil In House Chips Revenue (million) Forecast, by Application 2020 & 2033
- Table 14: Argentina In House Chips Revenue (million) Forecast, by Application 2020 & 2033
- Table 15: Rest of South America In House Chips Revenue (million) Forecast, by Application 2020 & 2033
- Table 16: Global In House Chips Revenue million Forecast, by Application 2020 & 2033
- Table 17: Global In House Chips Revenue million Forecast, by Type 2020 & 2033
- Table 18: Global In House Chips Revenue million Forecast, by Country 2020 & 2033
- Table 19: United Kingdom In House Chips Revenue (million) Forecast, by Application 2020 & 2033
- Table 20: Germany In House Chips Revenue (million) Forecast, by Application 2020 & 2033
- Table 21: France In House Chips Revenue (million) Forecast, by Application 2020 & 2033
- Table 22: Italy In House Chips Revenue (million) Forecast, by Application 2020 & 2033
- Table 23: Spain In House Chips Revenue (million) Forecast, by Application 2020 & 2033
- Table 24: Russia In House Chips Revenue (million) Forecast, by Application 2020 & 2033
- Table 25: Benelux In House Chips Revenue (million) Forecast, by Application 2020 & 2033
- Table 26: Nordics In House Chips Revenue (million) Forecast, by Application 2020 & 2033
- Table 27: Rest of Europe In House Chips Revenue (million) Forecast, by Application 2020 & 2033
- Table 28: Global In House Chips Revenue million Forecast, by Application 2020 & 2033
- Table 29: Global In House Chips Revenue million Forecast, by Type 2020 & 2033
- Table 30: Global In House Chips Revenue million Forecast, by Country 2020 & 2033
- Table 31: Turkey In House Chips Revenue (million) Forecast, by Application 2020 & 2033
- Table 32: Israel In House Chips Revenue (million) Forecast, by Application 2020 & 2033
- Table 33: GCC In House Chips Revenue (million) Forecast, by Application 2020 & 2033
- Table 34: North Africa In House Chips Revenue (million) Forecast, by Application 2020 & 2033
- Table 35: South Africa In House Chips Revenue (million) Forecast, by Application 2020 & 2033
- Table 36: Rest of Middle East & Africa In House Chips Revenue (million) Forecast, by Application 2020 & 2033
- Table 37: Global In House Chips Revenue million Forecast, by Application 2020 & 2033
- Table 38: Global In House Chips Revenue million Forecast, by Type 2020 & 2033
- Table 39: Global In House Chips Revenue million Forecast, by Country 2020 & 2033
- Table 40: China In House Chips Revenue (million) Forecast, by Application 2020 & 2033
- Table 41: India In House Chips Revenue (million) Forecast, by Application 2020 & 2033
- Table 42: Japan In House Chips Revenue (million) Forecast, by Application 2020 & 2033
- Table 43: South Korea In House Chips Revenue (million) Forecast, by Application 2020 & 2033
- Table 44: ASEAN In House Chips Revenue (million) Forecast, by Application 2020 & 2033
- Table 45: Oceania In House Chips Revenue (million) Forecast, by Application 2020 & 2033
- Table 46: Rest of Asia Pacific In House Chips Revenue (million) Forecast, by Application 2020 & 2033
Frequently Asked Questions
1. What is the projected Compound Annual Growth Rate (CAGR) of the In House Chips?
The projected CAGR is approximately 12.8%.
2. Which companies are prominent players in the In House Chips?
Key companies in the market include Apple, Tesla, Google, Amazon, Microsoft, Intel, Qualcomm, NVIDIA, AMD, Broadcom, Micron, Cisco, Arm Holdings, Sony, Samsung, LG, MediaTek, Huawei, Baidu, Alibaba.
3. What are the main segments of the In House Chips?
The market segments include Application, Type.
4. Can you provide details about the market size?
The market size is estimated to be USD 3405 million as of 2022.
5. What are some drivers contributing to market growth?
N/A
6. What are the notable trends driving market growth?
N/A
7. Are there any restraints impacting market growth?
N/A
8. Can you provide examples of recent developments in the market?
N/A
9. What pricing options are available for accessing the report?
Pricing options include single-user, multi-user, and enterprise licenses priced at USD 3950.00, USD 5925.00, and USD 7900.00 respectively.
10. Is the market size provided in terms of value or volume?
The market size is provided in terms of value, measured in million.
11. Are there any specific market keywords associated with the report?
Yes, the market keyword associated with the report is "In House Chips," which aids in identifying and referencing the specific market segment covered.
12. How do I determine which pricing option suits my needs best?
The pricing options vary based on user requirements and access needs. Individual users may opt for single-user licenses, while businesses requiring broader access may choose multi-user or enterprise licenses for cost-effective access to the report.
13. Are there any additional resources or data provided in the In House Chips report?
While the report offers comprehensive insights, it's advisable to review the specific contents or supplementary materials provided to ascertain if additional resources or data are available.
14. How can I stay updated on further developments or reports in the In House Chips?
To stay informed about further developments, trends, and reports in the In House Chips, consider subscribing to industry newsletters, following relevant companies and organizations, or regularly checking reputable industry news sources and publications.
Methodology
Step 1 - Identification of Relevant Samples Size from Population Database


Step 2 - Approaches for Defining Global Market Size (Value, Volume* & Price*)

Note*: In applicable scenarios
Step 3 - Data Sources
Primary Research
- Web Analytics
- Survey Reports
- Research Institute
- Latest Research Reports
- Opinion Leaders
Secondary Research
- Annual Reports
- White Paper
- Latest Press Release
- Industry Association
- Paid Database
- Investor Presentations

Step 4 - Data Triangulation
Involves using different sources of information in order to increase the validity of a study
These sources are likely to be stakeholders in a program - participants, other researchers, program staff, other community members, and so on.
Then we put all data in single framework & apply various statistical tools to find out the dynamic on the market.
During the analysis stage, feedback from the stakeholder groups would be compared to determine areas of agreement as well as areas of divergence