

Key Insights
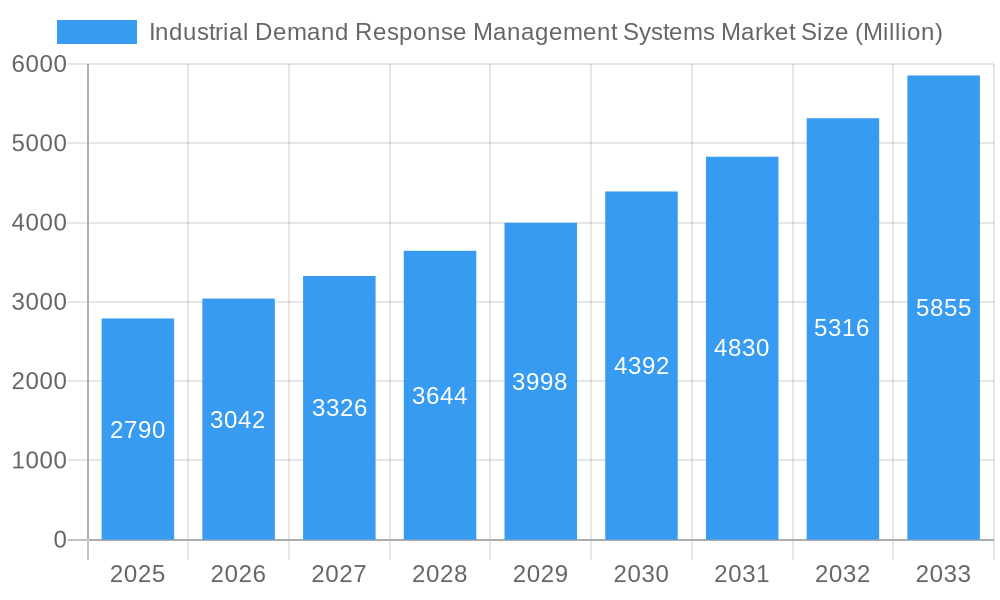
The Industrial Demand Response Management Systems (IDRMS) market is experiencing robust growth, projected to reach \$2.79 billion in 2025 and maintain a Compound Annual Growth Rate (CAGR) of 9.07% from 2025 to 2033. This expansion is driven by several key factors. Increasing energy costs and the urgent need for energy efficiency improvements across industries are primary motivators. Furthermore, stringent environmental regulations promoting renewable energy integration and carbon emission reduction are compelling industrial facilities to adopt IDRMS solutions. The rise of smart grids and the increasing adoption of automation technologies within industrial settings are also fueling market growth. The market is segmented by system type, with Automated Demand Response (ADR) systems gaining significant traction due to their ability to optimize energy consumption automatically and efficiently, thereby minimizing operational costs and maximizing energy savings. The geographically diverse market shows strong growth potential across North America (driven by stringent regulations and technological advancements), Europe (fueled by a focus on sustainable energy practices), and the Asia-Pacific region (experiencing rapid industrialization and increasing energy demand). Competition is intensifying, with established players like ABB, Siemens, and Schneider Electric alongside emerging technology providers vying for market share.
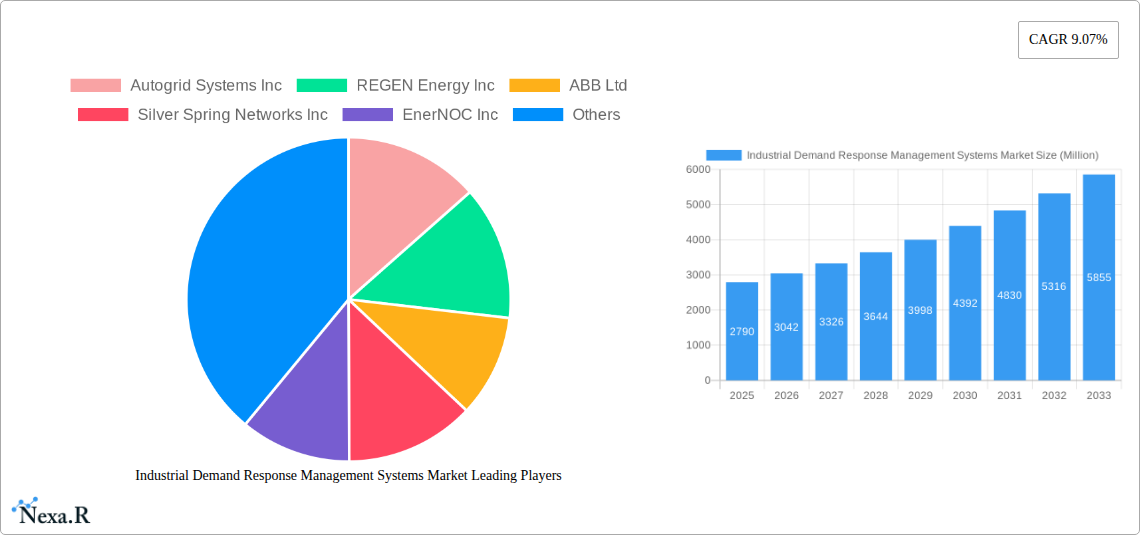
Industrial Demand Response Management Systems Market Market Size (In Billion)
The market's future trajectory indicates continued growth, propelled by the expanding adoption of advanced analytics and artificial intelligence (AI) in IDRMS. These technologies enable more precise energy consumption forecasting, allowing for more effective demand response strategies. The increasing connectivity of industrial equipment through the Industrial Internet of Things (IIoT) further enhances the capabilities of IDRMS, enabling real-time monitoring and control of energy usage. However, high initial investment costs and the complexity of implementing and integrating IDRMS into existing industrial infrastructure could pose challenges to market penetration. Nevertheless, the long-term benefits of cost reduction, improved energy efficiency, and environmental sustainability are anticipated to outweigh these initial hurdles, ensuring continued expansion of the IDRMS market in the coming years.
Industrial Demand Response Management Systems Market Company Market Share
Industrial Demand Response Management Systems Market Report: 2019-2033
This comprehensive report provides an in-depth analysis of the Industrial Demand Response Management Systems Market, encompassing market dynamics, growth trends, regional segmentation, product landscape, key players, and future outlook. The study period spans from 2019 to 2033, with 2025 serving as the base and estimated year. The report is crucial for industry professionals, investors, and strategic decision-makers seeking to understand and capitalize on the opportunities within this rapidly evolving market. Parent market is the broader Energy Management Systems market and the child market is specifically Industrial Demand Response Management Systems. Market values are presented in millions of units.
Industrial Demand Response Management Systems Market Market Dynamics & Structure
The Industrial Demand Response Management Systems market is characterized by moderate concentration, with several key players vying for market share. Technological innovation, particularly in AI and IoT integration, is a major driver, while regulatory frameworks and government incentives significantly influence market growth. The market faces competition from traditional energy management solutions, and mergers and acquisitions (M&A) activity is increasingly common, particularly amongst smaller players seeking to enhance their capabilities and expand into new markets. The end-user demographic primarily comprises large industrial facilities seeking to optimize energy consumption and reduce operational costs.
- Market Concentration: Moderately concentrated, with top 5 players holding approximately xx% market share in 2025.
- Technological Innovation: Strong driver; advancements in AI, IoT, and cloud computing are enhancing system capabilities and reducing implementation costs.
- Regulatory Framework: Government regulations and incentives promoting energy efficiency are fueling market demand.
- Competitive Substitutes: Traditional energy management systems and on-site generation pose some level of competition.
- M&A Activity: Moderate level; xx deals recorded in the past 5 years, primarily involving smaller companies.
- Innovation Barriers: High initial investment costs and integration complexities can hinder adoption in certain sectors.
Industrial Demand Response Management Systems Market Growth Trends & Insights
The Industrial Demand Response Management Systems market witnessed significant growth during the historical period (2019-2024), driven by increasing energy costs, rising awareness of sustainability, and stringent environmental regulations. The market size is projected to reach xx million in 2025 and exhibit a Compound Annual Growth Rate (CAGR) of xx% during the forecast period (2025-2033). This growth is fueled by the increasing adoption of automated demand response systems across various industries, coupled with advancements in technologies. Consumer behavior is shifting towards energy-efficient practices, creating substantial demand for sophisticated management systems. Technological disruptions, specifically in artificial intelligence and machine learning, continue to refine system capabilities and enhance efficiency.
Dominant Regions, Countries, or Segments in Industrial Demand Response Management Systems Market
North America currently holds the largest market share due to strong government support for energy efficiency initiatives and the presence of early adopters within the industrial sector. Europe follows closely, driven by stringent environmental regulations and a focus on renewable energy integration. Within market segments, Automated Demand Response systems are experiencing faster growth than Conventional Demand Response systems, driven by their enhanced capabilities and improved cost-effectiveness.
- Key Drivers in North America: Government incentives, robust industrial base, early adoption of smart technologies.
- Key Drivers in Europe: Stringent environmental regulations, focus on renewable energy integration, growing energy costs.
- Segment Dominance: Automated Demand Response systems are the leading segment, projected to hold xx% of market share by 2033, driven by their improved cost-effectiveness and increased efficiency.
- Market Share Projections: North America: xx%; Europe: xx%; Asia-Pacific: xx%; Rest of World: xx% in 2033.
Industrial Demand Response Management Systems Market Product Landscape
The product landscape is characterized by a diverse range of systems, offering varying levels of functionality and sophistication. These systems integrate advanced technologies, including AI, machine learning, and cloud computing, to optimize energy consumption, predict demand fluctuations, and enhance grid reliability. Key features include real-time monitoring, predictive analytics, and automated control capabilities. Unique selling propositions frequently focus on ease of implementation, system scalability, and integration with existing infrastructure.
Key Drivers, Barriers & Challenges in Industrial Demand Response Management Systems Market
Key Drivers: Rising energy costs, increasing regulatory pressure to reduce carbon emissions, the growing adoption of renewable energy sources, and the need for improved grid stability are major drivers. Government incentives and technological advancements further accelerate market growth.
Challenges: High initial investment costs, complexity of integration with existing infrastructure, concerns about data security, and a lack of awareness about the benefits of demand response among some industrial users pose significant challenges.
Emerging Opportunities in Industrial Demand Response Management Systems Market
Untapped markets in developing economies, the integration of demand response systems with building management systems, and the development of sophisticated predictive analytics capabilities represent significant opportunities. The growth of the Industrial Internet of Things (IIoT) and the increasing adoption of cloud-based solutions are creating additional avenues for growth.
Growth Accelerators in the Industrial Demand Response Management Systems Market Industry
Technological advancements, strategic partnerships between technology providers and energy utilities, and the expansion of government incentives are key catalysts for long-term growth. Increased standardization of protocols and improved interoperability between different systems will further accelerate market expansion.
Key Players Shaping the Industrial Demand Response Management Systems Market Market
Notable Milestones in Industrial Demand Response Management Systems Market Sector
- June 2023: Vertiv launched Vertiv EnerSav service, enhancing energy reduction in critical facilities via EDD-RT technology.
- July 2023: CPower Energy and OBM partnered to integrate EnerWise technology into Foreman's mining platform, optimizing demand response participation for mining operations.
- October 2023: Google tested a demand-response system for data centers across Taiwan, Oregon, and Europe, aiming for broader rollout to optimize energy consumption during grid stress.
In-Depth Industrial Demand Response Management Systems Market Market Outlook
The Industrial Demand Response Management Systems market is poised for sustained growth, driven by technological advancements, increasing environmental concerns, and supportive government policies. Strategic partnerships and the expansion into new geographical markets will further enhance market potential. The focus on improving energy efficiency and grid resilience creates significant opportunities for innovative solutions and technological breakthroughs.
Industrial Demand Response Management Systems Market Segmentation
-
1. Type
- 1.1. Conventional Demand Response
- 1.2. Automated Demand Response
Industrial Demand Response Management Systems Market Segmentation By Geography
-
1. North America
- 1.1. United States
- 1.2. Canada
- 1.3. Rest of North America
-
2. Asia Pacific
- 2.1. China
- 2.2. India
- 2.3. Japan
- 2.4. Australia
- 2.5. Malaysia
- 2.6. Thailand
- 2.7. Indonesia
- 2.8. Vietnam
- 2.9. Rest of Asia pacific
-
3. Europe
- 3.1. Germany
- 3.2. France
- 3.3. United Kingdom
- 3.4. Italy
- 3.5. Spain
- 3.6. Nordic
- 3.7. Turkey
- 3.8. Russia
- 3.9. Rest of Europe
-
4. South America
- 4.1. Brazil
- 4.2. Argentina
- 4.3. Chile
- 4.4. Colombia
- 4.5. Rest of South America
-
5. Middle East and Africa
- 5.1. Saudi Arabia
- 5.2. United Arab Emirates
- 5.3. South Africa
- 5.4. Qatar
- 5.5. Egypt
- 5.6. Nigeria
- 5.7. Rest of Middle East
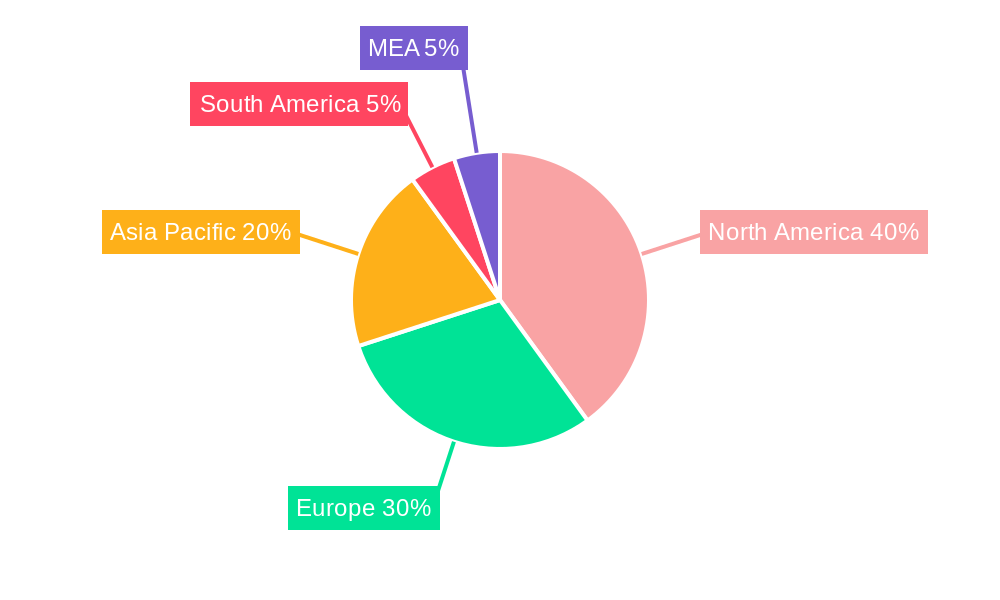
Industrial Demand Response Management Systems Market Regional Market Share
Geographic Coverage of Industrial Demand Response Management Systems Market
Industrial Demand Response Management Systems Market REPORT HIGHLIGHTS
| Aspects | Details |
|---|---|
| Study Period | 2020-2034 |
| Base Year | 2025 |
| Estimated Year | 2026 |
| Forecast Period | 2026-2034 |
| Historical Period | 2020-2025 |
| Growth Rate | CAGR of 9.07% from 2020-2034 |
| Segmentation |
|
Table of Contents
- 1. Introduction
- 1.1. Research Scope
- 1.2. Market Segmentation
- 1.3. Research Objective
- 1.4. Definitions and Assumptions
- 2. Executive Summary
- 2.1. Market Snapshot
- 3. Market Dynamics
- 3.1. Market Drivers
- 3.2. Market Restrains
- 3.3. Market Trends
- 3.4. Market Opportunities
- 4. Market Factor Analysis
- 4.1. Porters Five Forces
- 4.1.1. Bargaining Power of Suppliers
- 4.1.2. Bargaining Power of Buyers
- 4.1.3. Threat of New Entrants
- 4.1.4. Threat of Substitutes
- 4.1.5. Competitive Rivalry
- 4.2. PESTEL analysis
- 4.3. BCG Analysis
- 4.3.1. Stars (High Growth, High Market Share)
- 4.3.2. Cash Cows (Low Growth, High Market Share)
- 4.3.3. Question Mark (High Growth, Low Market Share)
- 4.3.4. Dogs (Low Growth, Low Market Share)
- 4.4. Ansoff Matrix Analysis
- 4.5. Supply Chain Analysis
- 4.6. Regulatory Landscape
- 4.7. Current Market Potential and Opportunity Assessment (TAM–SAM–SOM Framework)
- 4.8. NRP Analyst Note
- 4.1. Porters Five Forces
- 5. Market Analysis, Insights and Forecast 2021-2033
- 5.1. Market Analysis, Insights and Forecast - by Type
- 5.1.1. Conventional Demand Response
- 5.1.2. Automated Demand Response
- 5.2. Market Analysis, Insights and Forecast - by Region
- 5.2.1. North America
- 5.2.2. Asia Pacific
- 5.2.3. Europe
- 5.2.4. South America
- 5.2.5. Middle East and Africa
- 5.1. Market Analysis, Insights and Forecast - by Type
- 6. Global Industrial Demand Response Management Systems Market Analysis, Insights and Forecast, 2021-2033
- 6.1. Market Analysis, Insights and Forecast - by Type
- 6.1.1. Conventional Demand Response
- 6.1.2. Automated Demand Response
- 6.1. Market Analysis, Insights and Forecast - by Type
- 7. North America Industrial Demand Response Management Systems Market Analysis, Insights and Forecast, 2020-2032
- 7.1. Market Analysis, Insights and Forecast - by Type
- 7.1.1. Conventional Demand Response
- 7.1.2. Automated Demand Response
- 7.1. Market Analysis, Insights and Forecast - by Type
- 8. Asia Pacific Industrial Demand Response Management Systems Market Analysis, Insights and Forecast, 2020-2032
- 8.1. Market Analysis, Insights and Forecast - by Type
- 8.1.1. Conventional Demand Response
- 8.1.2. Automated Demand Response
- 8.1. Market Analysis, Insights and Forecast - by Type
- 9. Europe Industrial Demand Response Management Systems Market Analysis, Insights and Forecast, 2020-2032
- 9.1. Market Analysis, Insights and Forecast - by Type
- 9.1.1. Conventional Demand Response
- 9.1.2. Automated Demand Response
- 9.1. Market Analysis, Insights and Forecast - by Type
- 10. South America Industrial Demand Response Management Systems Market Analysis, Insights and Forecast, 2020-2032
- 10.1. Market Analysis, Insights and Forecast - by Type
- 10.1.1. Conventional Demand Response
- 10.1.2. Automated Demand Response
- 10.1. Market Analysis, Insights and Forecast - by Type
- 11. Middle East and Africa Industrial Demand Response Management Systems Market Analysis, Insights and Forecast, 2020-2032
- 11.1. Market Analysis, Insights and Forecast - by Type
- 11.1.1. Conventional Demand Response
- 11.1.2. Automated Demand Response
- 11.1. Market Analysis, Insights and Forecast - by Type
- 12. Competitive Analysis
- 12.1. Company Profiles
- 12.1.1 Autogrid Systems Inc
- 12.1.1.1. Company Overview
- 12.1.1.2. Products
- 12.1.1.3. Company Financials
- 12.1.1.4. SWOT Analysis
- 12.1.2 REGEN Energy Inc
- 12.1.2.1. Company Overview
- 12.1.2.2. Products
- 12.1.2.3. Company Financials
- 12.1.2.4. SWOT Analysis
- 12.1.3 ABB Ltd
- 12.1.3.1. Company Overview
- 12.1.3.2. Products
- 12.1.3.3. Company Financials
- 12.1.3.4. SWOT Analysis
- 12.1.4 Silver Spring Networks Inc
- 12.1.4.1. Company Overview
- 12.1.4.2. Products
- 12.1.4.3. Company Financials
- 12.1.4.4. SWOT Analysis
- 12.1.5 EnerNOC Inc
- 12.1.5.1. Company Overview
- 12.1.5.2. Products
- 12.1.5.3. Company Financials
- 12.1.5.4. SWOT Analysis
- 12.1.6 Hitachi Ltd
- 12.1.6.1. Company Overview
- 12.1.6.2. Products
- 12.1.6.3. Company Financials
- 12.1.6.4. SWOT Analysis
- 12.1.7 Mitsubishi Electric Corporation
- 12.1.7.1. Company Overview
- 12.1.7.2. Products
- 12.1.7.3. Company Financials
- 12.1.7.4. SWOT Analysis
- 12.1.8 Siemens AG
- 12.1.8.1. Company Overview
- 12.1.8.2. Products
- 12.1.8.3. Company Financials
- 12.1.8.4. SWOT Analysis
- 12.1.9 Alstom SA
- 12.1.9.1. Company Overview
- 12.1.9.2. Products
- 12.1.9.3. Company Financials
- 12.1.9.4. SWOT Analysis
- 12.1.10 Schneider Electric SE
- 12.1.10.1. Company Overview
- 12.1.10.2. Products
- 12.1.10.3. Company Financials
- 12.1.10.4. SWOT Analysis
- 12.1.11 Eaton Corporation PLC
- 12.1.11.1. Company Overview
- 12.1.11.2. Products
- 12.1.11.3. Company Financials
- 12.1.11.4. SWOT Analysis
- 12.1.12 General Electric Company
- 12.1.12.1. Company Overview
- 12.1.12.2. Products
- 12.1.12.3. Company Financials
- 12.1.12.4. SWOT Analysis
- 12.1.1 Autogrid Systems Inc
- 12.2. Market Entropy
- 12.2.1 Company's Key Areas Served
- 12.2.2 Recent Developments
- 12.3. Company Market Share Analysis 2025
- 12.3.1 Top 5 Companies Market Share Analysis
- 12.3.2 Top 3 Companies Market Share Analysis
- 12.4. List of Potential Customers
- 13. Research Methodology
List of Figures
- Figure 1: Global Industrial Demand Response Management Systems Market Revenue Breakdown (Million, %) by Region 2025 & 2033
- Figure 2: North America Industrial Demand Response Management Systems Market Revenue (Million), by Type 2025 & 2033
- Figure 3: North America Industrial Demand Response Management Systems Market Revenue Share (%), by Type 2025 & 2033
- Figure 4: North America Industrial Demand Response Management Systems Market Revenue (Million), by Country 2025 & 2033
- Figure 5: North America Industrial Demand Response Management Systems Market Revenue Share (%), by Country 2025 & 2033
- Figure 6: Asia Pacific Industrial Demand Response Management Systems Market Revenue (Million), by Type 2025 & 2033
- Figure 7: Asia Pacific Industrial Demand Response Management Systems Market Revenue Share (%), by Type 2025 & 2033
- Figure 8: Asia Pacific Industrial Demand Response Management Systems Market Revenue (Million), by Country 2025 & 2033
- Figure 9: Asia Pacific Industrial Demand Response Management Systems Market Revenue Share (%), by Country 2025 & 2033
- Figure 10: Europe Industrial Demand Response Management Systems Market Revenue (Million), by Type 2025 & 2033
- Figure 11: Europe Industrial Demand Response Management Systems Market Revenue Share (%), by Type 2025 & 2033
- Figure 12: Europe Industrial Demand Response Management Systems Market Revenue (Million), by Country 2025 & 2033
- Figure 13: Europe Industrial Demand Response Management Systems Market Revenue Share (%), by Country 2025 & 2033
- Figure 14: South America Industrial Demand Response Management Systems Market Revenue (Million), by Type 2025 & 2033
- Figure 15: South America Industrial Demand Response Management Systems Market Revenue Share (%), by Type 2025 & 2033
- Figure 16: South America Industrial Demand Response Management Systems Market Revenue (Million), by Country 2025 & 2033
- Figure 17: South America Industrial Demand Response Management Systems Market Revenue Share (%), by Country 2025 & 2033
- Figure 18: Middle East and Africa Industrial Demand Response Management Systems Market Revenue (Million), by Type 2025 & 2033
- Figure 19: Middle East and Africa Industrial Demand Response Management Systems Market Revenue Share (%), by Type 2025 & 2033
- Figure 20: Middle East and Africa Industrial Demand Response Management Systems Market Revenue (Million), by Country 2025 & 2033
- Figure 21: Middle East and Africa Industrial Demand Response Management Systems Market Revenue Share (%), by Country 2025 & 2033
List of Tables
- Table 1: Global Industrial Demand Response Management Systems Market Revenue Million Forecast, by Type 2020 & 2033
- Table 2: Global Industrial Demand Response Management Systems Market Revenue Million Forecast, by Region 2020 & 2033
- Table 3: Global Industrial Demand Response Management Systems Market Revenue Million Forecast, by Type 2020 & 2033
- Table 4: Global Industrial Demand Response Management Systems Market Revenue Million Forecast, by Country 2020 & 2033
- Table 5: United States Industrial Demand Response Management Systems Market Revenue (Million) Forecast, by Application 2020 & 2033
- Table 6: Canada Industrial Demand Response Management Systems Market Revenue (Million) Forecast, by Application 2020 & 2033
- Table 7: Rest of North America Industrial Demand Response Management Systems Market Revenue (Million) Forecast, by Application 2020 & 2033
- Table 8: Global Industrial Demand Response Management Systems Market Revenue Million Forecast, by Type 2020 & 2033
- Table 9: Global Industrial Demand Response Management Systems Market Revenue Million Forecast, by Country 2020 & 2033
- Table 10: China Industrial Demand Response Management Systems Market Revenue (Million) Forecast, by Application 2020 & 2033
- Table 11: India Industrial Demand Response Management Systems Market Revenue (Million) Forecast, by Application 2020 & 2033
- Table 12: Japan Industrial Demand Response Management Systems Market Revenue (Million) Forecast, by Application 2020 & 2033
- Table 13: Australia Industrial Demand Response Management Systems Market Revenue (Million) Forecast, by Application 2020 & 2033
- Table 14: Malaysia Industrial Demand Response Management Systems Market Revenue (Million) Forecast, by Application 2020 & 2033
- Table 15: Thailand Industrial Demand Response Management Systems Market Revenue (Million) Forecast, by Application 2020 & 2033
- Table 16: Indonesia Industrial Demand Response Management Systems Market Revenue (Million) Forecast, by Application 2020 & 2033
- Table 17: Vietnam Industrial Demand Response Management Systems Market Revenue (Million) Forecast, by Application 2020 & 2033
- Table 18: Rest of Asia pacific Industrial Demand Response Management Systems Market Revenue (Million) Forecast, by Application 2020 & 2033
- Table 19: Global Industrial Demand Response Management Systems Market Revenue Million Forecast, by Type 2020 & 2033
- Table 20: Global Industrial Demand Response Management Systems Market Revenue Million Forecast, by Country 2020 & 2033
- Table 21: Germany Industrial Demand Response Management Systems Market Revenue (Million) Forecast, by Application 2020 & 2033
- Table 22: France Industrial Demand Response Management Systems Market Revenue (Million) Forecast, by Application 2020 & 2033
- Table 23: United Kingdom Industrial Demand Response Management Systems Market Revenue (Million) Forecast, by Application 2020 & 2033
- Table 24: Italy Industrial Demand Response Management Systems Market Revenue (Million) Forecast, by Application 2020 & 2033
- Table 25: Spain Industrial Demand Response Management Systems Market Revenue (Million) Forecast, by Application 2020 & 2033
- Table 26: Nordic Industrial Demand Response Management Systems Market Revenue (Million) Forecast, by Application 2020 & 2033
- Table 27: Turkey Industrial Demand Response Management Systems Market Revenue (Million) Forecast, by Application 2020 & 2033
- Table 28: Russia Industrial Demand Response Management Systems Market Revenue (Million) Forecast, by Application 2020 & 2033
- Table 29: Rest of Europe Industrial Demand Response Management Systems Market Revenue (Million) Forecast, by Application 2020 & 2033
- Table 30: Global Industrial Demand Response Management Systems Market Revenue Million Forecast, by Type 2020 & 2033
- Table 31: Global Industrial Demand Response Management Systems Market Revenue Million Forecast, by Country 2020 & 2033
- Table 32: Brazil Industrial Demand Response Management Systems Market Revenue (Million) Forecast, by Application 2020 & 2033
- Table 33: Argentina Industrial Demand Response Management Systems Market Revenue (Million) Forecast, by Application 2020 & 2033
- Table 34: Chile Industrial Demand Response Management Systems Market Revenue (Million) Forecast, by Application 2020 & 2033
- Table 35: Colombia Industrial Demand Response Management Systems Market Revenue (Million) Forecast, by Application 2020 & 2033
- Table 36: Rest of South America Industrial Demand Response Management Systems Market Revenue (Million) Forecast, by Application 2020 & 2033
- Table 37: Global Industrial Demand Response Management Systems Market Revenue Million Forecast, by Type 2020 & 2033
- Table 38: Global Industrial Demand Response Management Systems Market Revenue Million Forecast, by Country 2020 & 2033
- Table 39: Saudi Arabia Industrial Demand Response Management Systems Market Revenue (Million) Forecast, by Application 2020 & 2033
- Table 40: United Arab Emirates Industrial Demand Response Management Systems Market Revenue (Million) Forecast, by Application 2020 & 2033
- Table 41: South Africa Industrial Demand Response Management Systems Market Revenue (Million) Forecast, by Application 2020 & 2033
- Table 42: Qatar Industrial Demand Response Management Systems Market Revenue (Million) Forecast, by Application 2020 & 2033
- Table 43: Egypt Industrial Demand Response Management Systems Market Revenue (Million) Forecast, by Application 2020 & 2033
- Table 44: Nigeria Industrial Demand Response Management Systems Market Revenue (Million) Forecast, by Application 2020 & 2033
- Table 45: Rest of Middle East Industrial Demand Response Management Systems Market Revenue (Million) Forecast, by Application 2020 & 2033
Frequently Asked Questions
1. What is the projected Compound Annual Growth Rate (CAGR) of the Industrial Demand Response Management Systems Market?
The projected CAGR is approximately 9.07%.
2. Which companies are prominent players in the Industrial Demand Response Management Systems Market?
Key companies in the market include Autogrid Systems Inc, REGEN Energy Inc, ABB Ltd, Silver Spring Networks Inc, EnerNOC Inc, Hitachi Ltd, Mitsubishi Electric Corporation, Siemens AG, Alstom SA, Schneider Electric SE, Eaton Corporation PLC, General Electric Company.
3. What are the main segments of the Industrial Demand Response Management Systems Market?
The market segments include Type.
4. Can you provide details about the market size?
The market size is estimated to be USD 2.79 Million as of 2022.
5. What are some drivers contributing to market growth?
4.; Need for Efficient Energy Management Systems4.; Growing Penetration of Renewable Energy Sources.
6. What are the notable trends driving market growth?
Growing Penetration of Renewable Energy Sources to Drive the Market.
7. Are there any restraints impacting market growth?
4.; Privacy Concerns on the Industrial Demand Response Management Systems.
8. Can you provide examples of recent developments in the market?
June 2023: Vertiv launched its Vertiv EnerSav service, helping critical facility operators unlock cost savings through targeted energy reduction. This service avoided substantial infrastructure investments by conducting rigorous on-site assessments and gap analyses. Vertiv's innovative External Digital Demand Response Technology (EDD-RT) further optimizes energy consumption by dynamically adapting manufacturer settings based on live consumption patterns.
9. What pricing options are available for accessing the report?
Pricing options include single-user, multi-user, and enterprise licenses priced at USD 4750, USD 5250, and USD 8750 respectively.
10. Is the market size provided in terms of value or volume?
The market size is provided in terms of value, measured in Million.
11. Are there any specific market keywords associated with the report?
Yes, the market keyword associated with the report is "Industrial Demand Response Management Systems Market," which aids in identifying and referencing the specific market segment covered.
12. How do I determine which pricing option suits my needs best?
The pricing options vary based on user requirements and access needs. Individual users may opt for single-user licenses, while businesses requiring broader access may choose multi-user or enterprise licenses for cost-effective access to the report.
13. Are there any additional resources or data provided in the Industrial Demand Response Management Systems Market report?
While the report offers comprehensive insights, it's advisable to review the specific contents or supplementary materials provided to ascertain if additional resources or data are available.
14. How can I stay updated on further developments or reports in the Industrial Demand Response Management Systems Market?
To stay informed about further developments, trends, and reports in the Industrial Demand Response Management Systems Market, consider subscribing to industry newsletters, following relevant companies and organizations, or regularly checking reputable industry news sources and publications.
Methodology
Step 1 - Identification of Relevant Samples Size from Population Database


Step 2 - Approaches for Defining Global Market Size (Value, Volume* & Price*)

Note*: In applicable scenarios
Step 3 - Data Sources
Primary Research
- Web Analytics
- Survey Reports
- Research Institute
- Latest Research Reports
- Opinion Leaders
Secondary Research
- Annual Reports
- White Paper
- Latest Press Release
- Industry Association
- Paid Database
- Investor Presentations

Step 4 - Data Triangulation
Involves using different sources of information in order to increase the validity of a study
These sources are likely to be stakeholders in a program - participants, other researchers, program staff, other community members, and so on.
Then we put all data in single framework & apply various statistical tools to find out the dynamic on the market.
During the analysis stage, feedback from the stakeholder groups would be compared to determine areas of agreement as well as areas of divergence