

Key Insights
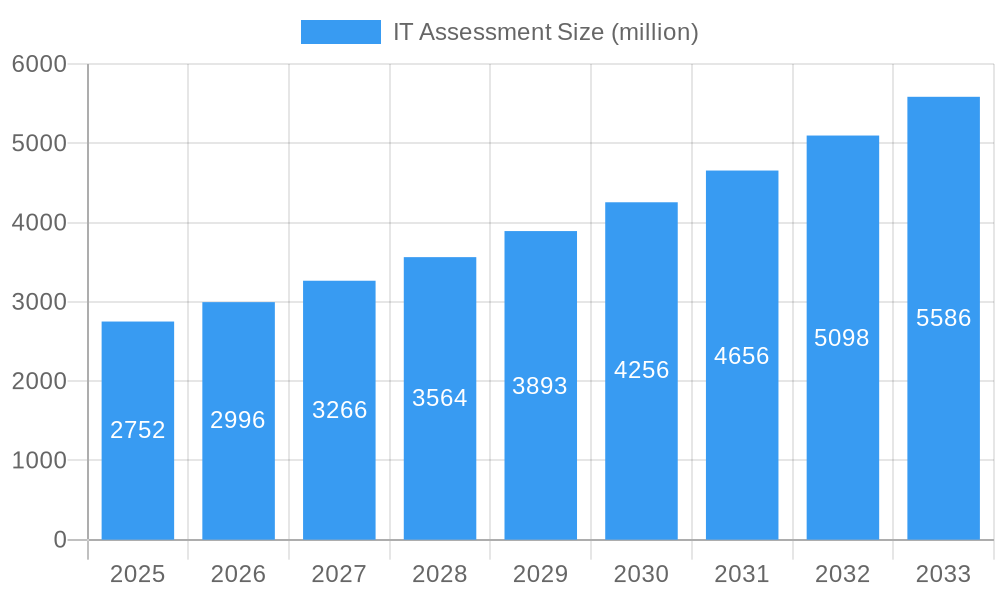
The IT Assessment market, valued at $2752 million in 2025, exhibits robust growth potential, projected to expand at a compound annual growth rate (CAGR) of 8.9% from 2025 to 2033. This growth is fueled by several key drivers. Increasing cybersecurity threats necessitate comprehensive IT assessments to identify vulnerabilities and ensure compliance with evolving regulations like GDPR and CCPA. Furthermore, the rising adoption of cloud computing and digital transformation initiatives across various industries creates a demand for regular IT assessments to optimize infrastructure, enhance efficiency, and manage costs effectively. The growing complexity of IT systems and the need for streamlined operations are additional factors propelling market expansion. Competition is strong, with established players like IBM and emerging companies like Zunesis and Brave River Solutions vying for market share. The market is segmented based on assessment type (e.g., security, performance, compliance), deployment model (on-premise, cloud), and industry vertical (e.g., BFSI, healthcare, retail). While specific regional data is unavailable, we can expect North America and Europe to dominate the market due to higher adoption rates of advanced technologies and stringent regulatory landscapes.
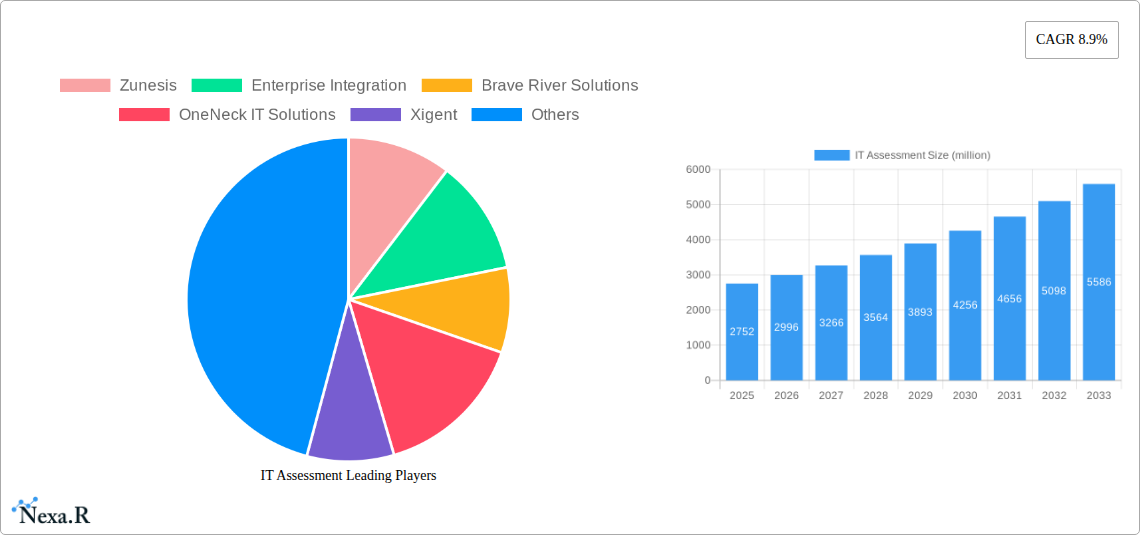
IT Assessment Market Size (In Billion)
The forecast period (2025-2033) anticipates significant growth across all segments. While challenges remain, such as the potential for skill gaps in IT assessment expertise and the high initial investment required for some advanced assessment tools, the overall market outlook remains positive. Continuous innovation in IT assessment methodologies and the increasing awareness of the importance of proactive IT management are key factors mitigating these restraints. The market’s evolution is marked by a shift towards automation and AI-powered assessment solutions to enhance accuracy, speed, and efficiency. This trend, coupled with the growing demand for managed IT assessment services, will shape the future landscape of this dynamic market. Companies are focusing on developing comprehensive solutions that address diverse needs across various industries, driving the market towards further expansion and consolidation.
IT Assessment Company Market Share
IT Assessment Market Report: 2019-2033
This comprehensive report provides an in-depth analysis of the IT Assessment market, projecting robust growth from 2025 to 2033. We delve into market dynamics, growth trends, regional dominance, product landscapes, and key players, offering invaluable insights for businesses and investors seeking to navigate this dynamic sector. The study period covers 2019-2033, with a base year of 2025 and a forecast period of 2025-2033. The market size in 2025 is estimated at xx million.
IT Assessment Market Dynamics & Structure
The IT Assessment market, valued at xx million in 2025, is characterized by moderate concentration, with several major players vying for market share. Technological innovation, particularly in areas like AI-driven assessments and cloud-based solutions, is a key driver. Regulatory compliance mandates, such as GDPR and HIPAA, are increasingly shaping market demand. Competitive substitutes include manual assessment processes, but these are increasingly being superseded by automated solutions. The end-user demographic is broad, encompassing enterprises of all sizes across various industries. M&A activity has been moderate in recent years, with xx deals recorded in the historical period (2019-2024), averaging xx million per deal.
- Market Concentration: Moderately concentrated, with top 5 players holding approximately xx% market share in 2025.
- Technological Innovation: AI, automation, and cloud computing are driving efficiency and accuracy.
- Regulatory Frameworks: GDPR, HIPAA, and other compliance standards fuel demand for robust IT assessments.
- Competitive Substitutes: Manual assessments are gradually being replaced by automated solutions.
- End-User Demographics: Enterprises across various industries and sizes.
- M&A Trends: xx deals recorded from 2019-2024, with an average deal value of xx million. Consolidation is expected to continue.
IT Assessment Growth Trends & Insights
The IT Assessment market exhibits a strong growth trajectory, driven by increasing digitalization, cybersecurity concerns, and the rising adoption of cloud-based infrastructure. The market size is projected to reach xx million by 2033, exhibiting a Compound Annual Growth Rate (CAGR) of xx% during the forecast period (2025-2033). Market penetration is expected to increase from xx% in 2025 to xx% by 2033. Technological disruptions, like the integration of blockchain for enhanced security, are further propelling growth. Consumer behavior is shifting towards the adoption of comprehensive, integrated IT assessment solutions offering higher efficiency and enhanced security features.
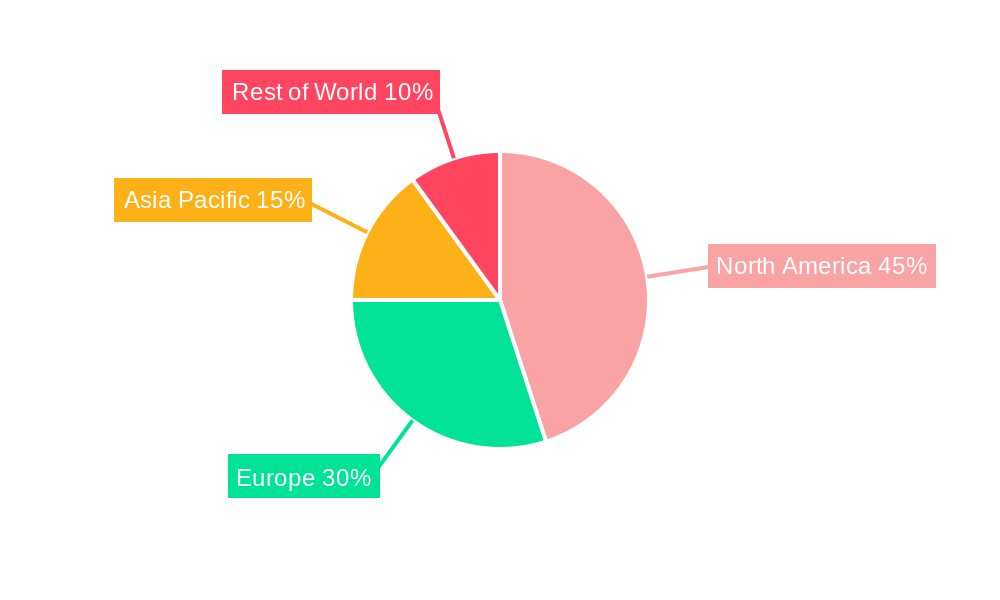
Dominant Regions, Countries, or Segments in IT Assessment
North America currently holds the largest market share in the IT Assessment sector, driven by high technology adoption rates and stringent regulatory compliance requirements. The region benefits from robust infrastructure, a mature IT industry, and significant investments in cybersecurity. Europe is another key region, exhibiting significant growth fueled by increasing regulations like GDPR. Asia-Pacific is also showing strong potential for growth, propelled by rapid digitalization and increasing investments in IT infrastructure.
- Key Drivers (North America): High technology adoption, stringent regulatory compliance, robust IT infrastructure.
- Key Drivers (Europe): GDPR compliance, increasing digitalization across sectors.
- Key Drivers (Asia-Pacific): Rapid digitalization, growing IT investments, expanding middle class.
IT Assessment Product Landscape
The IT Assessment market offers a diverse range of products, including vulnerability scanners, penetration testing tools, risk assessment software, and compliance management platforms. Recent innovations include AI-powered solutions that automate assessment processes, improve accuracy, and reduce human error. Key features include automated reporting, real-time dashboards, and integration with existing IT infrastructure. These advancements enhance efficiency, reduce costs, and provide comprehensive insights into IT security posture.
Key Drivers, Barriers & Challenges in IT Assessment
Key Drivers:
- Increasing cyber threats and data breaches necessitate robust IT assessments.
- Regulatory compliance mandates drive demand for comprehensive assessment solutions.
- Growing adoption of cloud computing and IoT increases the need for security evaluations.
Key Challenges:
- The high cost of implementing comprehensive IT assessment solutions can be a barrier for smaller businesses. This results in a xx million reduction in potential market size annually.
- Integrating various assessment tools and platforms can be complex and time-consuming.
- A shortage of skilled cybersecurity professionals limits the effectiveness of IT assessments.
Emerging Opportunities in IT Assessment
Emerging opportunities lie in expanding into untapped markets, particularly in developing economies with growing IT infrastructure. The integration of AI and machine learning for predictive risk assessment holds significant potential. Demand for specialized assessments tailored to specific industry needs (e.g., healthcare, finance) offers growth avenues.
Growth Accelerators in the IT Assessment Industry
Strategic partnerships between IT assessment providers and cybersecurity firms are creating synergistic growth. Technological breakthroughs, particularly in AI and automation, are streamlining assessment processes and enhancing efficiency. Market expansion into emerging economies and the development of tailored solutions for specific industries will further accelerate growth.
Key Players Shaping the IT Assessment Market
- Zunesis
- Enterprise Integration
- Brave River Solutions
- OneNeck IT Solutions
- Xigent
- IBM
- 3RT Networks
- Nomios
- Resolute
- Infopulse
- Lazorpoint
- Belden
- CSP
- Zindagi Technologies
- Synoptek
- A3logics
- Power Consulting
- Aqueduct
- Fiserv
- TestPros
- TUV Rheinland
- GooAnn
Notable Milestones in IT Assessment Sector
- 2021: Introduction of AI-powered vulnerability assessment platform by Xigent.
- 2022: Merger between two leading IT assessment providers, resulting in a combined market share of xx%.
- 2023: Launch of a new cloud-based compliance management platform by IBM.
In-Depth IT Assessment Market Outlook
The IT Assessment market is poised for sustained growth, driven by ongoing digital transformation, increasing cybersecurity threats, and evolving regulatory landscapes. Strategic investments in R&D, expansion into new markets, and strategic partnerships will be crucial for long-term success. The market presents significant opportunities for innovation and consolidation, with a potential market size of xx million by 2033.
IT Assessment Segmentation
-
1. Application
- 1.1. SMEs
- 1.2. Large Enterprises
-
2. Types
- 2.1. Vulnerability Assessment
- 2.2. Penetration Testing
- 2.3. IT Audit
- 2.4. IT Risk Assessment
IT Assessment Segmentation By Geography
-
1. North America
- 1.1. United States
- 1.2. Canada
- 1.3. Mexico
-
2. South America
- 2.1. Brazil
- 2.2. Argentina
- 2.3. Rest of South America
-
3. Europe
- 3.1. United Kingdom
- 3.2. Germany
- 3.3. France
- 3.4. Italy
- 3.5. Spain
- 3.6. Russia
- 3.7. Benelux
- 3.8. Nordics
- 3.9. Rest of Europe
-
4. Middle East & Africa
- 4.1. Turkey
- 4.2. Israel
- 4.3. GCC
- 4.4. North Africa
- 4.5. South Africa
- 4.6. Rest of Middle East & Africa
-
5. Asia Pacific
- 5.1. China
- 5.2. India
- 5.3. Japan
- 5.4. South Korea
- 5.5. ASEAN
- 5.6. Oceania
- 5.7. Rest of Asia Pacific
IT Assessment Regional Market Share
Geographic Coverage of IT Assessment
IT Assessment REPORT HIGHLIGHTS
| Aspects | Details |
|---|---|
| Study Period | 2020-2034 |
| Base Year | 2025 |
| Estimated Year | 2026 |
| Forecast Period | 2026-2034 |
| Historical Period | 2020-2025 |
| Growth Rate | CAGR of 8.9% from 2020-2034 |
| Segmentation |
|
Table of Contents
- 1. Introduction
- 1.1. Research Scope
- 1.2. Market Segmentation
- 1.3. Research Methodology
- 1.4. Definitions and Assumptions
- 2. Executive Summary
- 2.1. Introduction
- 3. Market Dynamics
- 3.1. Introduction
- 3.2. Market Drivers
- 3.3. Market Restrains
- 3.4. Market Trends
- 4. Market Factor Analysis
- 4.1. Porters Five Forces
- 4.2. Supply/Value Chain
- 4.3. PESTEL analysis
- 4.4. Market Entropy
- 4.5. Patent/Trademark Analysis
- 5. Global IT Assessment Analysis, Insights and Forecast, 2020-2032
- 5.1. Market Analysis, Insights and Forecast - by Application
- 5.1.1. SMEs
- 5.1.2. Large Enterprises
- 5.2. Market Analysis, Insights and Forecast - by Types
- 5.2.1. Vulnerability Assessment
- 5.2.2. Penetration Testing
- 5.2.3. IT Audit
- 5.2.4. IT Risk Assessment
- 5.3. Market Analysis, Insights and Forecast - by Region
- 5.3.1. North America
- 5.3.2. South America
- 5.3.3. Europe
- 5.3.4. Middle East & Africa
- 5.3.5. Asia Pacific
- 5.1. Market Analysis, Insights and Forecast - by Application
- 6. North America IT Assessment Analysis, Insights and Forecast, 2020-2032
- 6.1. Market Analysis, Insights and Forecast - by Application
- 6.1.1. SMEs
- 6.1.2. Large Enterprises
- 6.2. Market Analysis, Insights and Forecast - by Types
- 6.2.1. Vulnerability Assessment
- 6.2.2. Penetration Testing
- 6.2.3. IT Audit
- 6.2.4. IT Risk Assessment
- 6.1. Market Analysis, Insights and Forecast - by Application
- 7. South America IT Assessment Analysis, Insights and Forecast, 2020-2032
- 7.1. Market Analysis, Insights and Forecast - by Application
- 7.1.1. SMEs
- 7.1.2. Large Enterprises
- 7.2. Market Analysis, Insights and Forecast - by Types
- 7.2.1. Vulnerability Assessment
- 7.2.2. Penetration Testing
- 7.2.3. IT Audit
- 7.2.4. IT Risk Assessment
- 7.1. Market Analysis, Insights and Forecast - by Application
- 8. Europe IT Assessment Analysis, Insights and Forecast, 2020-2032
- 8.1. Market Analysis, Insights and Forecast - by Application
- 8.1.1. SMEs
- 8.1.2. Large Enterprises
- 8.2. Market Analysis, Insights and Forecast - by Types
- 8.2.1. Vulnerability Assessment
- 8.2.2. Penetration Testing
- 8.2.3. IT Audit
- 8.2.4. IT Risk Assessment
- 8.1. Market Analysis, Insights and Forecast - by Application
- 9. Middle East & Africa IT Assessment Analysis, Insights and Forecast, 2020-2032
- 9.1. Market Analysis, Insights and Forecast - by Application
- 9.1.1. SMEs
- 9.1.2. Large Enterprises
- 9.2. Market Analysis, Insights and Forecast - by Types
- 9.2.1. Vulnerability Assessment
- 9.2.2. Penetration Testing
- 9.2.3. IT Audit
- 9.2.4. IT Risk Assessment
- 9.1. Market Analysis, Insights and Forecast - by Application
- 10. Asia Pacific IT Assessment Analysis, Insights and Forecast, 2020-2032
- 10.1. Market Analysis, Insights and Forecast - by Application
- 10.1.1. SMEs
- 10.1.2. Large Enterprises
- 10.2. Market Analysis, Insights and Forecast - by Types
- 10.2.1. Vulnerability Assessment
- 10.2.2. Penetration Testing
- 10.2.3. IT Audit
- 10.2.4. IT Risk Assessment
- 10.1. Market Analysis, Insights and Forecast - by Application
- 11. Competitive Analysis
- 11.1. Global Market Share Analysis 2025
- 11.2. Company Profiles
- 11.2.1 Zunesis
- 11.2.1.1. Overview
- 11.2.1.2. Products
- 11.2.1.3. SWOT Analysis
- 11.2.1.4. Recent Developments
- 11.2.1.5. Financials (Based on Availability)
- 11.2.2 Enterprise Integration
- 11.2.2.1. Overview
- 11.2.2.2. Products
- 11.2.2.3. SWOT Analysis
- 11.2.2.4. Recent Developments
- 11.2.2.5. Financials (Based on Availability)
- 11.2.3 Brave River Solutions
- 11.2.3.1. Overview
- 11.2.3.2. Products
- 11.2.3.3. SWOT Analysis
- 11.2.3.4. Recent Developments
- 11.2.3.5. Financials (Based on Availability)
- 11.2.4 OneNeck IT Solutions
- 11.2.4.1. Overview
- 11.2.4.2. Products
- 11.2.4.3. SWOT Analysis
- 11.2.4.4. Recent Developments
- 11.2.4.5. Financials (Based on Availability)
- 11.2.5 Xigent
- 11.2.5.1. Overview
- 11.2.5.2. Products
- 11.2.5.3. SWOT Analysis
- 11.2.5.4. Recent Developments
- 11.2.5.5. Financials (Based on Availability)
- 11.2.6 IBM
- 11.2.6.1. Overview
- 11.2.6.2. Products
- 11.2.6.3. SWOT Analysis
- 11.2.6.4. Recent Developments
- 11.2.6.5. Financials (Based on Availability)
- 11.2.7 3RT Networks
- 11.2.7.1. Overview
- 11.2.7.2. Products
- 11.2.7.3. SWOT Analysis
- 11.2.7.4. Recent Developments
- 11.2.7.5. Financials (Based on Availability)
- 11.2.8 Nomios
- 11.2.8.1. Overview
- 11.2.8.2. Products
- 11.2.8.3. SWOT Analysis
- 11.2.8.4. Recent Developments
- 11.2.8.5. Financials (Based on Availability)
- 11.2.9 Resolute
- 11.2.9.1. Overview
- 11.2.9.2. Products
- 11.2.9.3. SWOT Analysis
- 11.2.9.4. Recent Developments
- 11.2.9.5. Financials (Based on Availability)
- 11.2.10 Infopulse
- 11.2.10.1. Overview
- 11.2.10.2. Products
- 11.2.10.3. SWOT Analysis
- 11.2.10.4. Recent Developments
- 11.2.10.5. Financials (Based on Availability)
- 11.2.11 Lazorpoint
- 11.2.11.1. Overview
- 11.2.11.2. Products
- 11.2.11.3. SWOT Analysis
- 11.2.11.4. Recent Developments
- 11.2.11.5. Financials (Based on Availability)
- 11.2.12 Belden
- 11.2.12.1. Overview
- 11.2.12.2. Products
- 11.2.12.3. SWOT Analysis
- 11.2.12.4. Recent Developments
- 11.2.12.5. Financials (Based on Availability)
- 11.2.13 CSP
- 11.2.13.1. Overview
- 11.2.13.2. Products
- 11.2.13.3. SWOT Analysis
- 11.2.13.4. Recent Developments
- 11.2.13.5. Financials (Based on Availability)
- 11.2.14 Zindagi Technologies
- 11.2.14.1. Overview
- 11.2.14.2. Products
- 11.2.14.3. SWOT Analysis
- 11.2.14.4. Recent Developments
- 11.2.14.5. Financials (Based on Availability)
- 11.2.15 Synoptek
- 11.2.15.1. Overview
- 11.2.15.2. Products
- 11.2.15.3. SWOT Analysis
- 11.2.15.4. Recent Developments
- 11.2.15.5. Financials (Based on Availability)
- 11.2.16 A3logics
- 11.2.16.1. Overview
- 11.2.16.2. Products
- 11.2.16.3. SWOT Analysis
- 11.2.16.4. Recent Developments
- 11.2.16.5. Financials (Based on Availability)
- 11.2.17 Power Consulting
- 11.2.17.1. Overview
- 11.2.17.2. Products
- 11.2.17.3. SWOT Analysis
- 11.2.17.4. Recent Developments
- 11.2.17.5. Financials (Based on Availability)
- 11.2.18 Aqueduct
- 11.2.18.1. Overview
- 11.2.18.2. Products
- 11.2.18.3. SWOT Analysis
- 11.2.18.4. Recent Developments
- 11.2.18.5. Financials (Based on Availability)
- 11.2.19 Fiserv
- 11.2.19.1. Overview
- 11.2.19.2. Products
- 11.2.19.3. SWOT Analysis
- 11.2.19.4. Recent Developments
- 11.2.19.5. Financials (Based on Availability)
- 11.2.20 TestPros
- 11.2.20.1. Overview
- 11.2.20.2. Products
- 11.2.20.3. SWOT Analysis
- 11.2.20.4. Recent Developments
- 11.2.20.5. Financials (Based on Availability)
- 11.2.21 TUV Rheinland
- 11.2.21.1. Overview
- 11.2.21.2. Products
- 11.2.21.3. SWOT Analysis
- 11.2.21.4. Recent Developments
- 11.2.21.5. Financials (Based on Availability)
- 11.2.22 GooAnn
- 11.2.22.1. Overview
- 11.2.22.2. Products
- 11.2.22.3. SWOT Analysis
- 11.2.22.4. Recent Developments
- 11.2.22.5. Financials (Based on Availability)
- 11.2.1 Zunesis
List of Figures
- Figure 1: Global IT Assessment Revenue Breakdown (million, %) by Region 2025 & 2033
- Figure 2: North America IT Assessment Revenue (million), by Application 2025 & 2033
- Figure 3: North America IT Assessment Revenue Share (%), by Application 2025 & 2033
- Figure 4: North America IT Assessment Revenue (million), by Types 2025 & 2033
- Figure 5: North America IT Assessment Revenue Share (%), by Types 2025 & 2033
- Figure 6: North America IT Assessment Revenue (million), by Country 2025 & 2033
- Figure 7: North America IT Assessment Revenue Share (%), by Country 2025 & 2033
- Figure 8: South America IT Assessment Revenue (million), by Application 2025 & 2033
- Figure 9: South America IT Assessment Revenue Share (%), by Application 2025 & 2033
- Figure 10: South America IT Assessment Revenue (million), by Types 2025 & 2033
- Figure 11: South America IT Assessment Revenue Share (%), by Types 2025 & 2033
- Figure 12: South America IT Assessment Revenue (million), by Country 2025 & 2033
- Figure 13: South America IT Assessment Revenue Share (%), by Country 2025 & 2033
- Figure 14: Europe IT Assessment Revenue (million), by Application 2025 & 2033
- Figure 15: Europe IT Assessment Revenue Share (%), by Application 2025 & 2033
- Figure 16: Europe IT Assessment Revenue (million), by Types 2025 & 2033
- Figure 17: Europe IT Assessment Revenue Share (%), by Types 2025 & 2033
- Figure 18: Europe IT Assessment Revenue (million), by Country 2025 & 2033
- Figure 19: Europe IT Assessment Revenue Share (%), by Country 2025 & 2033
- Figure 20: Middle East & Africa IT Assessment Revenue (million), by Application 2025 & 2033
- Figure 21: Middle East & Africa IT Assessment Revenue Share (%), by Application 2025 & 2033
- Figure 22: Middle East & Africa IT Assessment Revenue (million), by Types 2025 & 2033
- Figure 23: Middle East & Africa IT Assessment Revenue Share (%), by Types 2025 & 2033
- Figure 24: Middle East & Africa IT Assessment Revenue (million), by Country 2025 & 2033
- Figure 25: Middle East & Africa IT Assessment Revenue Share (%), by Country 2025 & 2033
- Figure 26: Asia Pacific IT Assessment Revenue (million), by Application 2025 & 2033
- Figure 27: Asia Pacific IT Assessment Revenue Share (%), by Application 2025 & 2033
- Figure 28: Asia Pacific IT Assessment Revenue (million), by Types 2025 & 2033
- Figure 29: Asia Pacific IT Assessment Revenue Share (%), by Types 2025 & 2033
- Figure 30: Asia Pacific IT Assessment Revenue (million), by Country 2025 & 2033
- Figure 31: Asia Pacific IT Assessment Revenue Share (%), by Country 2025 & 2033
List of Tables
- Table 1: Global IT Assessment Revenue million Forecast, by Application 2020 & 2033
- Table 2: Global IT Assessment Revenue million Forecast, by Types 2020 & 2033
- Table 3: Global IT Assessment Revenue million Forecast, by Region 2020 & 2033
- Table 4: Global IT Assessment Revenue million Forecast, by Application 2020 & 2033
- Table 5: Global IT Assessment Revenue million Forecast, by Types 2020 & 2033
- Table 6: Global IT Assessment Revenue million Forecast, by Country 2020 & 2033
- Table 7: United States IT Assessment Revenue (million) Forecast, by Application 2020 & 2033
- Table 8: Canada IT Assessment Revenue (million) Forecast, by Application 2020 & 2033
- Table 9: Mexico IT Assessment Revenue (million) Forecast, by Application 2020 & 2033
- Table 10: Global IT Assessment Revenue million Forecast, by Application 2020 & 2033
- Table 11: Global IT Assessment Revenue million Forecast, by Types 2020 & 2033
- Table 12: Global IT Assessment Revenue million Forecast, by Country 2020 & 2033
- Table 13: Brazil IT Assessment Revenue (million) Forecast, by Application 2020 & 2033
- Table 14: Argentina IT Assessment Revenue (million) Forecast, by Application 2020 & 2033
- Table 15: Rest of South America IT Assessment Revenue (million) Forecast, by Application 2020 & 2033
- Table 16: Global IT Assessment Revenue million Forecast, by Application 2020 & 2033
- Table 17: Global IT Assessment Revenue million Forecast, by Types 2020 & 2033
- Table 18: Global IT Assessment Revenue million Forecast, by Country 2020 & 2033
- Table 19: United Kingdom IT Assessment Revenue (million) Forecast, by Application 2020 & 2033
- Table 20: Germany IT Assessment Revenue (million) Forecast, by Application 2020 & 2033
- Table 21: France IT Assessment Revenue (million) Forecast, by Application 2020 & 2033
- Table 22: Italy IT Assessment Revenue (million) Forecast, by Application 2020 & 2033
- Table 23: Spain IT Assessment Revenue (million) Forecast, by Application 2020 & 2033
- Table 24: Russia IT Assessment Revenue (million) Forecast, by Application 2020 & 2033
- Table 25: Benelux IT Assessment Revenue (million) Forecast, by Application 2020 & 2033
- Table 26: Nordics IT Assessment Revenue (million) Forecast, by Application 2020 & 2033
- Table 27: Rest of Europe IT Assessment Revenue (million) Forecast, by Application 2020 & 2033
- Table 28: Global IT Assessment Revenue million Forecast, by Application 2020 & 2033
- Table 29: Global IT Assessment Revenue million Forecast, by Types 2020 & 2033
- Table 30: Global IT Assessment Revenue million Forecast, by Country 2020 & 2033
- Table 31: Turkey IT Assessment Revenue (million) Forecast, by Application 2020 & 2033
- Table 32: Israel IT Assessment Revenue (million) Forecast, by Application 2020 & 2033
- Table 33: GCC IT Assessment Revenue (million) Forecast, by Application 2020 & 2033
- Table 34: North Africa IT Assessment Revenue (million) Forecast, by Application 2020 & 2033
- Table 35: South Africa IT Assessment Revenue (million) Forecast, by Application 2020 & 2033
- Table 36: Rest of Middle East & Africa IT Assessment Revenue (million) Forecast, by Application 2020 & 2033
- Table 37: Global IT Assessment Revenue million Forecast, by Application 2020 & 2033
- Table 38: Global IT Assessment Revenue million Forecast, by Types 2020 & 2033
- Table 39: Global IT Assessment Revenue million Forecast, by Country 2020 & 2033
- Table 40: China IT Assessment Revenue (million) Forecast, by Application 2020 & 2033
- Table 41: India IT Assessment Revenue (million) Forecast, by Application 2020 & 2033
- Table 42: Japan IT Assessment Revenue (million) Forecast, by Application 2020 & 2033
- Table 43: South Korea IT Assessment Revenue (million) Forecast, by Application 2020 & 2033
- Table 44: ASEAN IT Assessment Revenue (million) Forecast, by Application 2020 & 2033
- Table 45: Oceania IT Assessment Revenue (million) Forecast, by Application 2020 & 2033
- Table 46: Rest of Asia Pacific IT Assessment Revenue (million) Forecast, by Application 2020 & 2033
Frequently Asked Questions
1. What is the projected Compound Annual Growth Rate (CAGR) of the IT Assessment?
The projected CAGR is approximately 8.9%.
2. Which companies are prominent players in the IT Assessment?
Key companies in the market include Zunesis, Enterprise Integration, Brave River Solutions, OneNeck IT Solutions, Xigent, IBM, 3RT Networks, Nomios, Resolute, Infopulse, Lazorpoint, Belden, CSP, Zindagi Technologies, Synoptek, A3logics, Power Consulting, Aqueduct, Fiserv, TestPros, TUV Rheinland, GooAnn.
3. What are the main segments of the IT Assessment?
The market segments include Application, Types.
4. Can you provide details about the market size?
The market size is estimated to be USD 2752 million as of 2022.
5. What are some drivers contributing to market growth?
N/A
6. What are the notable trends driving market growth?
N/A
7. Are there any restraints impacting market growth?
N/A
8. Can you provide examples of recent developments in the market?
N/A
9. What pricing options are available for accessing the report?
Pricing options include single-user, multi-user, and enterprise licenses priced at USD 3350.00, USD 5025.00, and USD 6700.00 respectively.
10. Is the market size provided in terms of value or volume?
The market size is provided in terms of value, measured in million.
11. Are there any specific market keywords associated with the report?
Yes, the market keyword associated with the report is "IT Assessment," which aids in identifying and referencing the specific market segment covered.
12. How do I determine which pricing option suits my needs best?
The pricing options vary based on user requirements and access needs. Individual users may opt for single-user licenses, while businesses requiring broader access may choose multi-user or enterprise licenses for cost-effective access to the report.
13. Are there any additional resources or data provided in the IT Assessment report?
While the report offers comprehensive insights, it's advisable to review the specific contents or supplementary materials provided to ascertain if additional resources or data are available.
14. How can I stay updated on further developments or reports in the IT Assessment?
To stay informed about further developments, trends, and reports in the IT Assessment, consider subscribing to industry newsletters, following relevant companies and organizations, or regularly checking reputable industry news sources and publications.
Methodology
Step 1 - Identification of Relevant Samples Size from Population Database


Step 2 - Approaches for Defining Global Market Size (Value, Volume* & Price*)

Note*: In applicable scenarios
Step 3 - Data Sources
Primary Research
- Web Analytics
- Survey Reports
- Research Institute
- Latest Research Reports
- Opinion Leaders
Secondary Research
- Annual Reports
- White Paper
- Latest Press Release
- Industry Association
- Paid Database
- Investor Presentations

Step 4 - Data Triangulation
Involves using different sources of information in order to increase the validity of a study
These sources are likely to be stakeholders in a program - participants, other researchers, program staff, other community members, and so on.
Then we put all data in single framework & apply various statistical tools to find out the dynamic on the market.
During the analysis stage, feedback from the stakeholder groups would be compared to determine areas of agreement as well as areas of divergence