

Key Insights
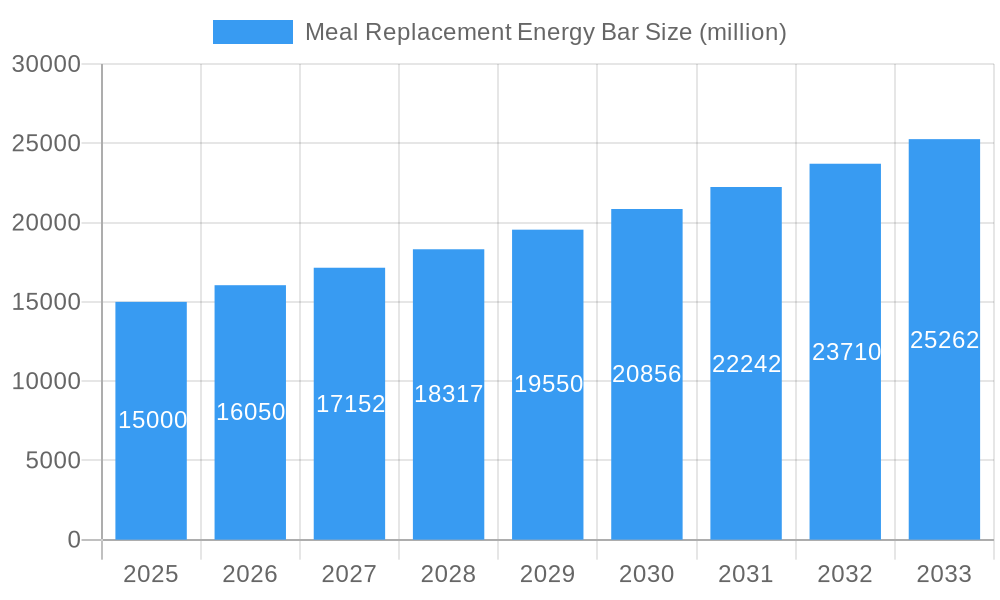
The global meal replacement energy bar market is poised for significant expansion, driven by heightened health awareness, dynamic lifestyles, and the escalating demand for convenient, nutrient-dense food solutions. The market, valued at $14632 million in the base year of 2025, is projected to grow at a Compound Annual Growth Rate (CAGR) of 6.4% from 2025 to 2033, reaching an estimated $24575 million by 2033. This upward trajectory is propelled by several key drivers: the pervasive influence of health and fitness trends, the increasing incidence of chronic conditions necessitating specialized dietary management, and the broadening availability of diverse product formulations catering to specific dietary requirements and preferences, such as vegan, keto, and high-protein options. Leading companies, including Simply Protein, Optimum Nutrition, and Clif Bar, are actively innovating through novel product introductions and strategic alliances, thereby extending their market presence and consumer engagement.
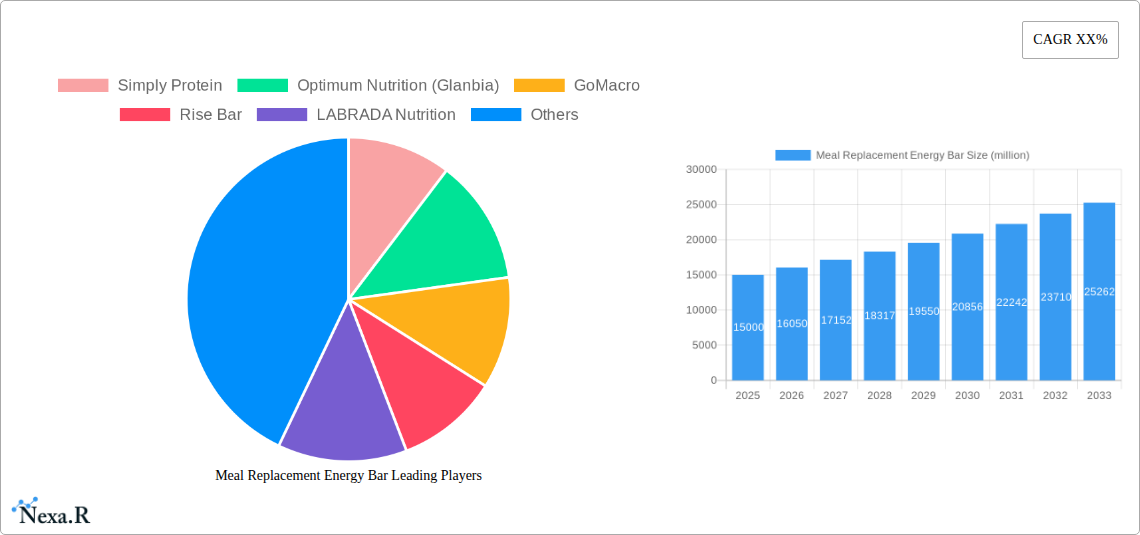
Meal Replacement Energy Bar Market Size (In Billion)
Nevertheless, the market confronts certain obstacles, including rigorous regulatory frameworks, volatility in raw material pricing, and growing consumer apprehension regarding artificial additives and excessive sugar content. The competitive arena is characterized by intense dynamism, with established enterprises and nascent brands actively contending for market share. Companies achieving success are prioritizing the development of superior-quality products with transparent labeling, aligning with the evolving expectations of health-conscious consumers. Segment analysis highlights substantial growth prospects within specialized bars designed for specific dietary needs (e.g., gluten-free, organic). Regional disparities in consumer preferences and purchasing behaviors present both avenues for advancement and challenges for global expansion. The forecast period anticipates sustained market growth, underpinned by continuous consumer adoption and ongoing product innovation.
Meal Replacement Energy Bar Company Market Share
Meal Replacement Energy Bar Market Report: 2019-2033
This comprehensive report provides an in-depth analysis of the global meal replacement energy bar market, encompassing market dynamics, growth trends, regional performance, competitive landscape, and future outlook. The study period spans 2019-2033, with a base year of 2025 and a forecast period of 2025-2033. This report is crucial for industry professionals, investors, and stakeholders seeking to understand and capitalize on opportunities within this rapidly evolving market. The report leverages proprietary data and industry expertise to deliver actionable insights. The total market size is predicted to reach xx million units by 2033.
Meal Replacement Energy Bar Market Dynamics & Structure
This section analyzes the market's competitive structure, technological advancements, regulatory landscape, and market dynamics. The market is characterized by a mix of established players and emerging brands, resulting in a dynamic competitive landscape. Key factors influencing market dynamics include:
- Market Concentration: The market exhibits moderate concentration, with key players like Simply Protein, Optimum Nutrition (Glanbia), and Clif Bar & Company holding significant market share (xx% combined in 2025). Smaller players, however, contribute significantly to market innovation and competition.
- Technological Innovation: Ongoing innovations focus on improved nutritional profiles (e.g., increased protein content, functional ingredients), sustainable packaging, and enhanced taste profiles. Innovation barriers include cost of research and development, and regulatory approvals for new ingredients.
- Regulatory Frameworks: Food safety regulations and labeling requirements significantly impact product development and market access. Variations in regulations across different geographies contribute to market complexity.
- Competitive Product Substitutes: Meal replacement shakes, protein powders, and other convenient food options compete directly with energy bars. This necessitates continuous product improvement and differentiation.
- End-User Demographics: The primary target market includes health-conscious individuals, athletes, busy professionals, and individuals seeking convenient meal replacements. Growth is driven by increased awareness of health and wellness and a rising demand for functional foods.
- M&A Trends: The market has witnessed a moderate level of mergers and acquisitions activity in recent years, with xx major deals recorded between 2019 and 2024. These transactions have reshaped the competitive landscape and accelerated innovation.
Meal Replacement Energy Bar Growth Trends & Insights
This section presents a detailed analysis of market size evolution, adoption rates, technological disruptions, and consumer behavior shifts, utilizing proprietary data and advanced analytical methodologies. The global meal replacement energy bar market experienced significant growth during the historical period (2019-2024), reaching xx million units in 2024. This growth is projected to continue throughout the forecast period (2025-2033), with a compound annual growth rate (CAGR) of xx% expected. Key factors driving this growth include:
- Increasing demand for convenient and healthy food options.
- Rising health and fitness awareness among consumers.
- Growing adoption of plant-based and clean-label products.
- Technological advancements leading to product innovation and improved taste and texture.
- Expansion of distribution channels, including e-commerce and specialized retail stores.
Market penetration for meal replacement energy bars is expected to reach xx% by 2033, indicating considerable room for further market growth.
Dominant Regions, Countries, or Segments in Meal Replacement Energy Bar
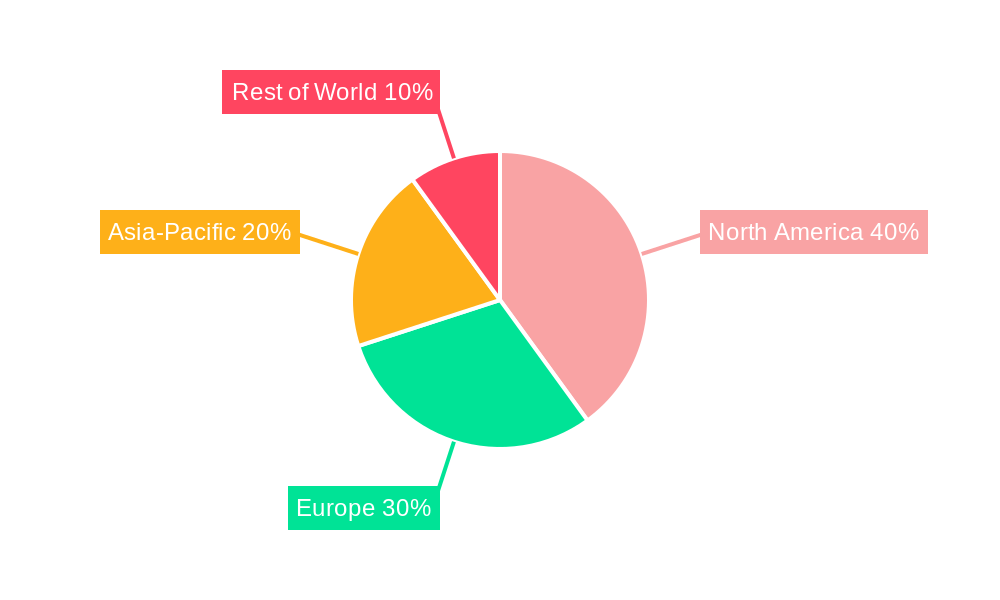
North America currently holds the largest market share (xx%) in the global meal replacement energy bar market, followed by Europe (xx%) and Asia-Pacific (xx%). This dominance is attributed to factors including:
- High consumer awareness of health and wellness in North America and Europe.
- Well-established distribution networks and retail infrastructure.
- Strong presence of key market players.
- Higher disposable incomes and greater purchasing power.
However, emerging economies in Asia-Pacific are experiencing rapid growth, fueled by increasing urbanization, rising disposable incomes, and changing consumer lifestyles. Key drivers for growth in specific regions include:
- North America: High disposable incomes, established health and wellness culture.
- Europe: Growing preference for convenient and healthy food options. Stringent food regulations.
- Asia-Pacific: Rising disposable incomes, increasing health awareness, and expanding distribution channels.
Meal Replacement Energy Bar Product Landscape
The meal replacement energy bar market offers a wide variety of products, catering to different dietary needs and preferences. Innovations include the development of bars with enhanced protein content, organic ingredients, and unique flavor profiles. Key advancements include the use of sustainable packaging and the incorporation of functional ingredients such as probiotics and adaptogens. Unique selling propositions (USPs) include improved taste and texture, convenience, and health benefits such as increased energy levels and improved muscle recovery.
Key Drivers, Barriers & Challenges in Meal Replacement Energy Bar
Key Drivers:
- Increasing health and wellness awareness: Consumers are increasingly focused on healthy eating and fitness.
- Convenience: Energy bars offer a convenient and portable meal replacement option.
- Product innovation: New product development focuses on improved taste, nutrition, and sustainability.
- Expanding distribution channels: E-commerce and specialized retailers broaden market access.
Key Challenges:
- Competition: Intense competition from established and emerging players.
- Regulatory hurdles: Food safety and labeling regulations vary across regions.
- Supply chain disruptions: Supply chain vulnerabilities can impact production and availability.
- Maintaining high quality and consistency: Maintaining product quality and consistency is vital for building customer trust.
Emerging Opportunities in Meal Replacement Energy Bar
Significant opportunities exist in:
- Expanding into untapped markets: Developing countries offer substantial growth potential.
- Developing novel product formats: Exploring innovative formats, such as high-protein bars or bars targeting specific dietary needs.
- Personalization and customization: Offering bars tailored to individual dietary requirements.
- Leveraging technology: Using technology to enhance product traceability and customer experience.
Growth Accelerators in the Meal Replacement Energy Bar Industry
Long-term growth is accelerated by strategic partnerships, technological breakthroughs driving innovation, and expansion into new geographic markets. Focus on sustainability and ethical sourcing is also crucial. The development of personalized nutrition solutions offers substantial growth potential.
Key Players Shaping the Meal Replacement Energy Bar Market
- Simply Protein
- Optimum Nutrition (Glanbia)
- GoMacro
- Rise Bar
- LABRADA Nutrition
- Clif Bar & Company
- Abbott Nutrition
- Herbalife
- Kellogg
- SlimFast (Glanbia)
- BE-KIND (Kind LLC)
- Quest Nutrition
- ffit8
- PhD
- OPTISLIM
- Lvshou
- DGI
- GYMMAX
Notable Milestones in Meal Replacement Energy Bar Sector
- 2020: Launch of several plant-based energy bars by major players.
- 2021: Increased focus on sustainable packaging among leading brands.
- 2022: Several mergers and acquisitions within the industry reshape the competitive landscape.
- 2023: Significant investment in research and development to enhance product formulations.
In-Depth Meal Replacement Energy Bar Market Outlook
The meal replacement energy bar market is poised for robust growth over the next decade. Continued innovation, expansion into new markets, and strategic partnerships will drive this expansion. Opportunities exist for companies to develop personalized products, expand into new channels, and leverage digital marketing strategies to capture market share. The potential for the market to reach xx million units by 2033 is significant, and further growth is projected beyond this timeframe.
Meal Replacement Energy Bar Segmentation
-
1. Application
- 1.1. Online Sales
- 1.2. Offline Sales
-
2. Types
- 2.1. Nuts
- 2.2. Fruit, Vegetable and Cereal
- 2.3. Other
Meal Replacement Energy Bar Segmentation By Geography
-
1. North America
- 1.1. United States
- 1.2. Canada
- 1.3. Mexico
-
2. South America
- 2.1. Brazil
- 2.2. Argentina
- 2.3. Rest of South America
-
3. Europe
- 3.1. United Kingdom
- 3.2. Germany
- 3.3. France
- 3.4. Italy
- 3.5. Spain
- 3.6. Russia
- 3.7. Benelux
- 3.8. Nordics
- 3.9. Rest of Europe
-
4. Middle East & Africa
- 4.1. Turkey
- 4.2. Israel
- 4.3. GCC
- 4.4. North Africa
- 4.5. South Africa
- 4.6. Rest of Middle East & Africa
-
5. Asia Pacific
- 5.1. China
- 5.2. India
- 5.3. Japan
- 5.4. South Korea
- 5.5. ASEAN
- 5.6. Oceania
- 5.7. Rest of Asia Pacific
Meal Replacement Energy Bar Regional Market Share
Geographic Coverage of Meal Replacement Energy Bar
Meal Replacement Energy Bar REPORT HIGHLIGHTS
| Aspects | Details |
|---|---|
| Study Period | 2020-2034 |
| Base Year | 2025 |
| Estimated Year | 2026 |
| Forecast Period | 2026-2034 |
| Historical Period | 2020-2025 |
| Growth Rate | CAGR of 6.4% from 2020-2034 |
| Segmentation |
|
Table of Contents
- 1. Introduction
- 1.1. Research Scope
- 1.2. Market Segmentation
- 1.3. Research Methodology
- 1.4. Definitions and Assumptions
- 2. Executive Summary
- 2.1. Introduction
- 3. Market Dynamics
- 3.1. Introduction
- 3.2. Market Drivers
- 3.3. Market Restrains
- 3.4. Market Trends
- 4. Market Factor Analysis
- 4.1. Porters Five Forces
- 4.2. Supply/Value Chain
- 4.3. PESTEL analysis
- 4.4. Market Entropy
- 4.5. Patent/Trademark Analysis
- 5. Global Meal Replacement Energy Bar Analysis, Insights and Forecast, 2020-2032
- 5.1. Market Analysis, Insights and Forecast - by Application
- 5.1.1. Online Sales
- 5.1.2. Offline Sales
- 5.2. Market Analysis, Insights and Forecast - by Types
- 5.2.1. Nuts
- 5.2.2. Fruit, Vegetable and Cereal
- 5.2.3. Other
- 5.3. Market Analysis, Insights and Forecast - by Region
- 5.3.1. North America
- 5.3.2. South America
- 5.3.3. Europe
- 5.3.4. Middle East & Africa
- 5.3.5. Asia Pacific
- 5.1. Market Analysis, Insights and Forecast - by Application
- 6. North America Meal Replacement Energy Bar Analysis, Insights and Forecast, 2020-2032
- 6.1. Market Analysis, Insights and Forecast - by Application
- 6.1.1. Online Sales
- 6.1.2. Offline Sales
- 6.2. Market Analysis, Insights and Forecast - by Types
- 6.2.1. Nuts
- 6.2.2. Fruit, Vegetable and Cereal
- 6.2.3. Other
- 6.1. Market Analysis, Insights and Forecast - by Application
- 7. South America Meal Replacement Energy Bar Analysis, Insights and Forecast, 2020-2032
- 7.1. Market Analysis, Insights and Forecast - by Application
- 7.1.1. Online Sales
- 7.1.2. Offline Sales
- 7.2. Market Analysis, Insights and Forecast - by Types
- 7.2.1. Nuts
- 7.2.2. Fruit, Vegetable and Cereal
- 7.2.3. Other
- 7.1. Market Analysis, Insights and Forecast - by Application
- 8. Europe Meal Replacement Energy Bar Analysis, Insights and Forecast, 2020-2032
- 8.1. Market Analysis, Insights and Forecast - by Application
- 8.1.1. Online Sales
- 8.1.2. Offline Sales
- 8.2. Market Analysis, Insights and Forecast - by Types
- 8.2.1. Nuts
- 8.2.2. Fruit, Vegetable and Cereal
- 8.2.3. Other
- 8.1. Market Analysis, Insights and Forecast - by Application
- 9. Middle East & Africa Meal Replacement Energy Bar Analysis, Insights and Forecast, 2020-2032
- 9.1. Market Analysis, Insights and Forecast - by Application
- 9.1.1. Online Sales
- 9.1.2. Offline Sales
- 9.2. Market Analysis, Insights and Forecast - by Types
- 9.2.1. Nuts
- 9.2.2. Fruit, Vegetable and Cereal
- 9.2.3. Other
- 9.1. Market Analysis, Insights and Forecast - by Application
- 10. Asia Pacific Meal Replacement Energy Bar Analysis, Insights and Forecast, 2020-2032
- 10.1. Market Analysis, Insights and Forecast - by Application
- 10.1.1. Online Sales
- 10.1.2. Offline Sales
- 10.2. Market Analysis, Insights and Forecast - by Types
- 10.2.1. Nuts
- 10.2.2. Fruit, Vegetable and Cereal
- 10.2.3. Other
- 10.1. Market Analysis, Insights and Forecast - by Application
- 11. Competitive Analysis
- 11.1. Global Market Share Analysis 2025
- 11.2. Company Profiles
- 11.2.1 Simply Protein
- 11.2.1.1. Overview
- 11.2.1.2. Products
- 11.2.1.3. SWOT Analysis
- 11.2.1.4. Recent Developments
- 11.2.1.5. Financials (Based on Availability)
- 11.2.2 Optimum Nutrition (Glanbia)
- 11.2.2.1. Overview
- 11.2.2.2. Products
- 11.2.2.3. SWOT Analysis
- 11.2.2.4. Recent Developments
- 11.2.2.5. Financials (Based on Availability)
- 11.2.3 GoMacro
- 11.2.3.1. Overview
- 11.2.3.2. Products
- 11.2.3.3. SWOT Analysis
- 11.2.3.4. Recent Developments
- 11.2.3.5. Financials (Based on Availability)
- 11.2.4 Rise Bar
- 11.2.4.1. Overview
- 11.2.4.2. Products
- 11.2.4.3. SWOT Analysis
- 11.2.4.4. Recent Developments
- 11.2.4.5. Financials (Based on Availability)
- 11.2.5 LABRADA Nutrition
- 11.2.5.1. Overview
- 11.2.5.2. Products
- 11.2.5.3. SWOT Analysis
- 11.2.5.4. Recent Developments
- 11.2.5.5. Financials (Based on Availability)
- 11.2.6 Clif Bar & Company
- 11.2.6.1. Overview
- 11.2.6.2. Products
- 11.2.6.3. SWOT Analysis
- 11.2.6.4. Recent Developments
- 11.2.6.5. Financials (Based on Availability)
- 11.2.7 Abbott Nutrition
- 11.2.7.1. Overview
- 11.2.7.2. Products
- 11.2.7.3. SWOT Analysis
- 11.2.7.4. Recent Developments
- 11.2.7.5. Financials (Based on Availability)
- 11.2.8 Herbalife
- 11.2.8.1. Overview
- 11.2.8.2. Products
- 11.2.8.3. SWOT Analysis
- 11.2.8.4. Recent Developments
- 11.2.8.5. Financials (Based on Availability)
- 11.2.9 Kellogg
- 11.2.9.1. Overview
- 11.2.9.2. Products
- 11.2.9.3. SWOT Analysis
- 11.2.9.4. Recent Developments
- 11.2.9.5. Financials (Based on Availability)
- 11.2.10 SlimFast (Glanbia)
- 11.2.10.1. Overview
- 11.2.10.2. Products
- 11.2.10.3. SWOT Analysis
- 11.2.10.4. Recent Developments
- 11.2.10.5. Financials (Based on Availability)
- 11.2.11 BE-KIND (Kind LLC)
- 11.2.11.1. Overview
- 11.2.11.2. Products
- 11.2.11.3. SWOT Analysis
- 11.2.11.4. Recent Developments
- 11.2.11.5. Financials (Based on Availability)
- 11.2.12 Quest Nutrition
- 11.2.12.1. Overview
- 11.2.12.2. Products
- 11.2.12.3. SWOT Analysis
- 11.2.12.4. Recent Developments
- 11.2.12.5. Financials (Based on Availability)
- 11.2.13 ffit8
- 11.2.13.1. Overview
- 11.2.13.2. Products
- 11.2.13.3. SWOT Analysis
- 11.2.13.4. Recent Developments
- 11.2.13.5. Financials (Based on Availability)
- 11.2.14 PhD
- 11.2.14.1. Overview
- 11.2.14.2. Products
- 11.2.14.3. SWOT Analysis
- 11.2.14.4. Recent Developments
- 11.2.14.5. Financials (Based on Availability)
- 11.2.15 OPTISLIM
- 11.2.15.1. Overview
- 11.2.15.2. Products
- 11.2.15.3. SWOT Analysis
- 11.2.15.4. Recent Developments
- 11.2.15.5. Financials (Based on Availability)
- 11.2.16 Lvshou
- 11.2.16.1. Overview
- 11.2.16.2. Products
- 11.2.16.3. SWOT Analysis
- 11.2.16.4. Recent Developments
- 11.2.16.5. Financials (Based on Availability)
- 11.2.17 DGI
- 11.2.17.1. Overview
- 11.2.17.2. Products
- 11.2.17.3. SWOT Analysis
- 11.2.17.4. Recent Developments
- 11.2.17.5. Financials (Based on Availability)
- 11.2.18 GYMMAX
- 11.2.18.1. Overview
- 11.2.18.2. Products
- 11.2.18.3. SWOT Analysis
- 11.2.18.4. Recent Developments
- 11.2.18.5. Financials (Based on Availability)
- 11.2.1 Simply Protein
List of Figures
- Figure 1: Global Meal Replacement Energy Bar Revenue Breakdown (million, %) by Region 2025 & 2033
- Figure 2: North America Meal Replacement Energy Bar Revenue (million), by Application 2025 & 2033
- Figure 3: North America Meal Replacement Energy Bar Revenue Share (%), by Application 2025 & 2033
- Figure 4: North America Meal Replacement Energy Bar Revenue (million), by Types 2025 & 2033
- Figure 5: North America Meal Replacement Energy Bar Revenue Share (%), by Types 2025 & 2033
- Figure 6: North America Meal Replacement Energy Bar Revenue (million), by Country 2025 & 2033
- Figure 7: North America Meal Replacement Energy Bar Revenue Share (%), by Country 2025 & 2033
- Figure 8: South America Meal Replacement Energy Bar Revenue (million), by Application 2025 & 2033
- Figure 9: South America Meal Replacement Energy Bar Revenue Share (%), by Application 2025 & 2033
- Figure 10: South America Meal Replacement Energy Bar Revenue (million), by Types 2025 & 2033
- Figure 11: South America Meal Replacement Energy Bar Revenue Share (%), by Types 2025 & 2033
- Figure 12: South America Meal Replacement Energy Bar Revenue (million), by Country 2025 & 2033
- Figure 13: South America Meal Replacement Energy Bar Revenue Share (%), by Country 2025 & 2033
- Figure 14: Europe Meal Replacement Energy Bar Revenue (million), by Application 2025 & 2033
- Figure 15: Europe Meal Replacement Energy Bar Revenue Share (%), by Application 2025 & 2033
- Figure 16: Europe Meal Replacement Energy Bar Revenue (million), by Types 2025 & 2033
- Figure 17: Europe Meal Replacement Energy Bar Revenue Share (%), by Types 2025 & 2033
- Figure 18: Europe Meal Replacement Energy Bar Revenue (million), by Country 2025 & 2033
- Figure 19: Europe Meal Replacement Energy Bar Revenue Share (%), by Country 2025 & 2033
- Figure 20: Middle East & Africa Meal Replacement Energy Bar Revenue (million), by Application 2025 & 2033
- Figure 21: Middle East & Africa Meal Replacement Energy Bar Revenue Share (%), by Application 2025 & 2033
- Figure 22: Middle East & Africa Meal Replacement Energy Bar Revenue (million), by Types 2025 & 2033
- Figure 23: Middle East & Africa Meal Replacement Energy Bar Revenue Share (%), by Types 2025 & 2033
- Figure 24: Middle East & Africa Meal Replacement Energy Bar Revenue (million), by Country 2025 & 2033
- Figure 25: Middle East & Africa Meal Replacement Energy Bar Revenue Share (%), by Country 2025 & 2033
- Figure 26: Asia Pacific Meal Replacement Energy Bar Revenue (million), by Application 2025 & 2033
- Figure 27: Asia Pacific Meal Replacement Energy Bar Revenue Share (%), by Application 2025 & 2033
- Figure 28: Asia Pacific Meal Replacement Energy Bar Revenue (million), by Types 2025 & 2033
- Figure 29: Asia Pacific Meal Replacement Energy Bar Revenue Share (%), by Types 2025 & 2033
- Figure 30: Asia Pacific Meal Replacement Energy Bar Revenue (million), by Country 2025 & 2033
- Figure 31: Asia Pacific Meal Replacement Energy Bar Revenue Share (%), by Country 2025 & 2033
List of Tables
- Table 1: Global Meal Replacement Energy Bar Revenue million Forecast, by Application 2020 & 2033
- Table 2: Global Meal Replacement Energy Bar Revenue million Forecast, by Types 2020 & 2033
- Table 3: Global Meal Replacement Energy Bar Revenue million Forecast, by Region 2020 & 2033
- Table 4: Global Meal Replacement Energy Bar Revenue million Forecast, by Application 2020 & 2033
- Table 5: Global Meal Replacement Energy Bar Revenue million Forecast, by Types 2020 & 2033
- Table 6: Global Meal Replacement Energy Bar Revenue million Forecast, by Country 2020 & 2033
- Table 7: United States Meal Replacement Energy Bar Revenue (million) Forecast, by Application 2020 & 2033
- Table 8: Canada Meal Replacement Energy Bar Revenue (million) Forecast, by Application 2020 & 2033
- Table 9: Mexico Meal Replacement Energy Bar Revenue (million) Forecast, by Application 2020 & 2033
- Table 10: Global Meal Replacement Energy Bar Revenue million Forecast, by Application 2020 & 2033
- Table 11: Global Meal Replacement Energy Bar Revenue million Forecast, by Types 2020 & 2033
- Table 12: Global Meal Replacement Energy Bar Revenue million Forecast, by Country 2020 & 2033
- Table 13: Brazil Meal Replacement Energy Bar Revenue (million) Forecast, by Application 2020 & 2033
- Table 14: Argentina Meal Replacement Energy Bar Revenue (million) Forecast, by Application 2020 & 2033
- Table 15: Rest of South America Meal Replacement Energy Bar Revenue (million) Forecast, by Application 2020 & 2033
- Table 16: Global Meal Replacement Energy Bar Revenue million Forecast, by Application 2020 & 2033
- Table 17: Global Meal Replacement Energy Bar Revenue million Forecast, by Types 2020 & 2033
- Table 18: Global Meal Replacement Energy Bar Revenue million Forecast, by Country 2020 & 2033
- Table 19: United Kingdom Meal Replacement Energy Bar Revenue (million) Forecast, by Application 2020 & 2033
- Table 20: Germany Meal Replacement Energy Bar Revenue (million) Forecast, by Application 2020 & 2033
- Table 21: France Meal Replacement Energy Bar Revenue (million) Forecast, by Application 2020 & 2033
- Table 22: Italy Meal Replacement Energy Bar Revenue (million) Forecast, by Application 2020 & 2033
- Table 23: Spain Meal Replacement Energy Bar Revenue (million) Forecast, by Application 2020 & 2033
- Table 24: Russia Meal Replacement Energy Bar Revenue (million) Forecast, by Application 2020 & 2033
- Table 25: Benelux Meal Replacement Energy Bar Revenue (million) Forecast, by Application 2020 & 2033
- Table 26: Nordics Meal Replacement Energy Bar Revenue (million) Forecast, by Application 2020 & 2033
- Table 27: Rest of Europe Meal Replacement Energy Bar Revenue (million) Forecast, by Application 2020 & 2033
- Table 28: Global Meal Replacement Energy Bar Revenue million Forecast, by Application 2020 & 2033
- Table 29: Global Meal Replacement Energy Bar Revenue million Forecast, by Types 2020 & 2033
- Table 30: Global Meal Replacement Energy Bar Revenue million Forecast, by Country 2020 & 2033
- Table 31: Turkey Meal Replacement Energy Bar Revenue (million) Forecast, by Application 2020 & 2033
- Table 32: Israel Meal Replacement Energy Bar Revenue (million) Forecast, by Application 2020 & 2033
- Table 33: GCC Meal Replacement Energy Bar Revenue (million) Forecast, by Application 2020 & 2033
- Table 34: North Africa Meal Replacement Energy Bar Revenue (million) Forecast, by Application 2020 & 2033
- Table 35: South Africa Meal Replacement Energy Bar Revenue (million) Forecast, by Application 2020 & 2033
- Table 36: Rest of Middle East & Africa Meal Replacement Energy Bar Revenue (million) Forecast, by Application 2020 & 2033
- Table 37: Global Meal Replacement Energy Bar Revenue million Forecast, by Application 2020 & 2033
- Table 38: Global Meal Replacement Energy Bar Revenue million Forecast, by Types 2020 & 2033
- Table 39: Global Meal Replacement Energy Bar Revenue million Forecast, by Country 2020 & 2033
- Table 40: China Meal Replacement Energy Bar Revenue (million) Forecast, by Application 2020 & 2033
- Table 41: India Meal Replacement Energy Bar Revenue (million) Forecast, by Application 2020 & 2033
- Table 42: Japan Meal Replacement Energy Bar Revenue (million) Forecast, by Application 2020 & 2033
- Table 43: South Korea Meal Replacement Energy Bar Revenue (million) Forecast, by Application 2020 & 2033
- Table 44: ASEAN Meal Replacement Energy Bar Revenue (million) Forecast, by Application 2020 & 2033
- Table 45: Oceania Meal Replacement Energy Bar Revenue (million) Forecast, by Application 2020 & 2033
- Table 46: Rest of Asia Pacific Meal Replacement Energy Bar Revenue (million) Forecast, by Application 2020 & 2033
Frequently Asked Questions
1. What is the projected Compound Annual Growth Rate (CAGR) of the Meal Replacement Energy Bar?
The projected CAGR is approximately 6.4%.
2. Which companies are prominent players in the Meal Replacement Energy Bar?
Key companies in the market include Simply Protein, Optimum Nutrition (Glanbia), GoMacro, Rise Bar, LABRADA Nutrition, Clif Bar & Company, Abbott Nutrition, Herbalife, Kellogg, SlimFast (Glanbia), BE-KIND (Kind LLC), Quest Nutrition, ffit8, PhD, OPTISLIM, Lvshou, DGI, GYMMAX.
3. What are the main segments of the Meal Replacement Energy Bar?
The market segments include Application, Types.
4. Can you provide details about the market size?
The market size is estimated to be USD 14632 million as of 2022.
5. What are some drivers contributing to market growth?
N/A
6. What are the notable trends driving market growth?
N/A
7. Are there any restraints impacting market growth?
N/A
8. Can you provide examples of recent developments in the market?
N/A
9. What pricing options are available for accessing the report?
Pricing options include single-user, multi-user, and enterprise licenses priced at USD 5600.00, USD 8400.00, and USD 11200.00 respectively.
10. Is the market size provided in terms of value or volume?
The market size is provided in terms of value, measured in million.
11. Are there any specific market keywords associated with the report?
Yes, the market keyword associated with the report is "Meal Replacement Energy Bar," which aids in identifying and referencing the specific market segment covered.
12. How do I determine which pricing option suits my needs best?
The pricing options vary based on user requirements and access needs. Individual users may opt for single-user licenses, while businesses requiring broader access may choose multi-user or enterprise licenses for cost-effective access to the report.
13. Are there any additional resources or data provided in the Meal Replacement Energy Bar report?
While the report offers comprehensive insights, it's advisable to review the specific contents or supplementary materials provided to ascertain if additional resources or data are available.
14. How can I stay updated on further developments or reports in the Meal Replacement Energy Bar?
To stay informed about further developments, trends, and reports in the Meal Replacement Energy Bar, consider subscribing to industry newsletters, following relevant companies and organizations, or regularly checking reputable industry news sources and publications.
Methodology
Step 1 - Identification of Relevant Samples Size from Population Database


Step 2 - Approaches for Defining Global Market Size (Value, Volume* & Price*)

Note*: In applicable scenarios
Step 3 - Data Sources
Primary Research
- Web Analytics
- Survey Reports
- Research Institute
- Latest Research Reports
- Opinion Leaders
Secondary Research
- Annual Reports
- White Paper
- Latest Press Release
- Industry Association
- Paid Database
- Investor Presentations

Step 4 - Data Triangulation
Involves using different sources of information in order to increase the validity of a study
These sources are likely to be stakeholders in a program - participants, other researchers, program staff, other community members, and so on.
Then we put all data in single framework & apply various statistical tools to find out the dynamic on the market.
During the analysis stage, feedback from the stakeholder groups would be compared to determine areas of agreement as well as areas of divergence