

Key Insights
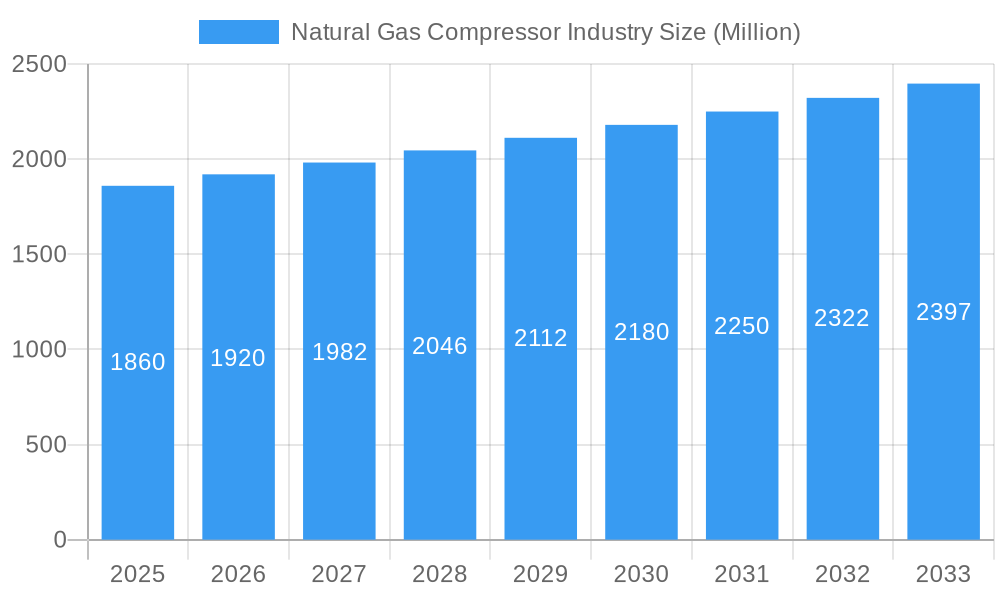
The global natural gas compressor market, valued at $1.86 billion in 2025, is projected to experience steady growth, driven by increasing natural gas demand for power generation and industrial applications. The market's Compound Annual Growth Rate (CAGR) of 3.13% from 2025 to 2033 reflects a continuous, albeit moderate, expansion. Key drivers include the rising global energy consumption, particularly in developing economies, and the increasing adoption of natural gas as a cleaner-burning fossil fuel compared to coal and oil. This shift is further fueled by government initiatives promoting energy transition and reducing carbon emissions. Technological advancements in compressor design, leading to improved efficiency and reduced operational costs, also contribute to market growth. The market is segmented by compressor type (reciprocating, screw) and application (upstream, midstream, downstream). Reciprocating compressors currently dominate due to their versatility and suitability for various applications, while screw compressors are gaining traction for their higher efficiency in specific applications. Upstream applications, primarily related to gas production and processing, are expected to hold a significant market share, followed by midstream and downstream segments. Geographic distribution shows North America and Asia Pacific as key regions, with robust growth anticipated in developing Asian economies due to infrastructure development and rising energy needs. However, market growth may face some restraints such as fluctuating natural gas prices and the ongoing shift towards renewable energy sources. Nevertheless, the long-term outlook for the natural gas compressor market remains positive, supported by the continuing role of natural gas in the global energy mix.
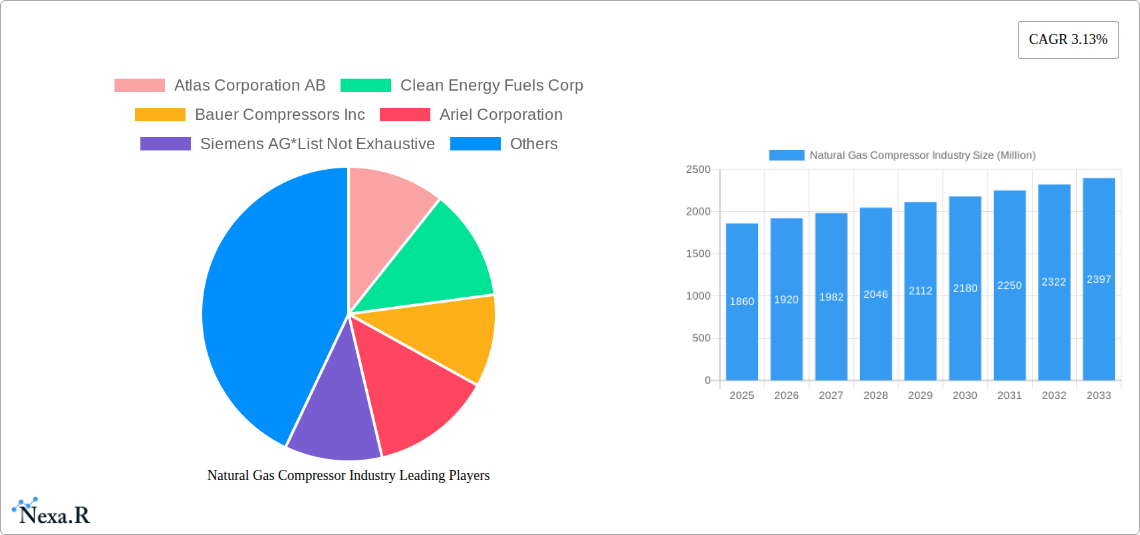
Natural Gas Compressor Industry Market Size (In Billion)
The competitive landscape features a mix of established global players and specialized regional manufacturers. Major players include Atlas Copco, Clean Energy Fuels Corp, Bauer Compressors, Ariel Corporation, Siemens, Burckhardt Compression, Ingersoll Rand, General Electric, HMS Group, and Howden Group. These companies are focusing on innovation, strategic partnerships, and mergers & acquisitions to enhance their market position. The increasing demand for energy-efficient compressors, coupled with stricter environmental regulations, is pushing manufacturers to invest in research and development to meet evolving market needs. Future growth will likely be influenced by the success of these companies in adapting to the shifting energy landscape and in providing cost-effective, eco-friendly compressor solutions. Regional variations in market growth will be influenced by factors such as government policies, economic conditions, and infrastructure development.
Natural Gas Compressor Industry Company Market Share
Natural Gas Compressor Industry Market Report: 2019-2033
This comprehensive report provides a detailed analysis of the Natural Gas Compressor industry, encompassing market dynamics, growth trends, regional analysis, product landscape, key players, and future outlook. The report covers the parent market of industrial compressors and the child market of natural gas compressors, providing a granular view of the sector. The study period spans 2019-2033, with 2025 as the base and estimated year. The forecast period is 2025-2033, and the historical period is 2019-2024. This report is invaluable for industry professionals, investors, and strategic decision-makers seeking to understand and capitalize on opportunities within this dynamic market. Market values are presented in Million units.
Natural Gas Compressor Industry Market Dynamics & Structure
The natural gas compressor market is characterized by moderate concentration, with several major players holding significant market share. Technological innovation, driven by the need for increased efficiency and reduced emissions, is a key driver. Stringent environmental regulations and evolving safety standards influence market dynamics. The industry faces competition from alternative technologies, but natural gas's role in energy transition sustains demand. End-user demographics show a heavy reliance on energy companies for upstream, midstream, and downstream applications. M&A activity has been moderate, with consolidation focused on technological expertise and market expansion.
- Market Concentration: xx% held by top 5 players (estimated).
- Technological Innovation: Focus on energy efficiency, reduced emissions (e.g., low-NOx compressors), and digitalization (predictive maintenance).
- Regulatory Framework: Stringent emissions standards (e.g., EPA regulations) and safety protocols influence compressor design and operation.
- Competitive Substitutes: Electric compressors, alternative energy solutions (e.g., renewable natural gas).
- End-User Demographics: Primarily oil and gas companies (upstream, midstream, downstream), industrial gas producers, and LNG facilities.
- M&A Trends: xx deals completed between 2019-2024 (estimated), primarily focused on expanding geographical reach and product portfolio.
Natural Gas Compressor Industry Growth Trends & Insights
The natural gas compressor market witnessed significant growth during the historical period (2019-2024). Driven by increasing natural gas production and infrastructure development, particularly in regions with substantial reserves, the market experienced a CAGR of xx% (estimated). Technological advancements, including the adoption of more efficient compressor technologies, further accelerated growth. Shifting consumer behavior towards cleaner energy sources, albeit gradually, remains a supportive factor. The forecast period (2025-2033) anticipates continued growth, albeit at a slightly moderated pace, driven by ongoing infrastructure investments and expansion in the LNG sector. Market penetration of advanced compressor technologies is expected to increase steadily during the forecast period.
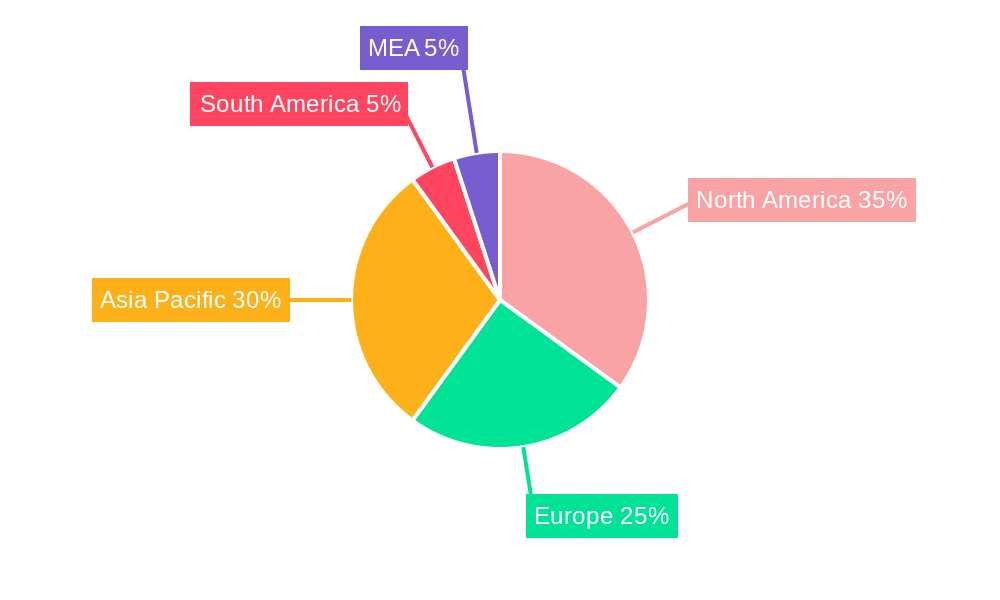
Dominant Regions, Countries, or Segments in Natural Gas Compressor Industry
The North American and Asia-Pacific regions are currently the dominant markets for natural gas compressors. Within these regions, specific countries like the United States, Canada, China, and India exhibit strong growth potential, driven by expanding energy infrastructure and industrial growth. In terms of segments, the upstream and midstream segments currently show the largest market share, reflecting the substantial demand for compression in natural gas production and transportation.
- Key Drivers:
- North America: Robust shale gas production, growing LNG export capacity, and supportive regulatory environment.
- Asia-Pacific: Rapid industrialization, increasing energy demand, and significant investments in gas infrastructure.
- Upstream: Strong demand for natural gas compression in upstream operations (production and processing).
- Midstream: Expansion of gas pipelines and processing facilities drives demand for natural gas compression.
Natural Gas Compressor Industry Product Landscape
The natural gas compressor market offers a diverse range of products, primarily categorized by type (reciprocating, screw, centrifugal) and application (upstream, midstream, downstream). Recent innovations focus on enhancing efficiency, reducing emissions, and improving reliability through advanced materials, improved designs, and digital technologies. Unique selling propositions include optimized energy consumption, reduced maintenance needs, and enhanced safety features. Technological advancements concentrate on integrating digital monitoring and control systems for predictive maintenance and optimized performance.
Key Drivers, Barriers & Challenges in Natural Gas Compressor Industry
Key Drivers: Growing natural gas production, increasing demand for LNG, expanding pipeline infrastructure, and government incentives for natural gas utilization. Technological advancements leading to more efficient and environmentally friendly compressors also drive the market.
Key Challenges: Fluctuations in natural gas prices, stringent environmental regulations, high initial investment costs for advanced compressor technologies, and potential supply chain disruptions impact market growth. These challenges can lead to project delays and increased operational costs. Competitive pressures from alternative energy sources also pose a challenge.
Emerging Opportunities in Natural Gas Compressor Industry
The natural gas compressor market presents opportunities in several areas. These include expansion into emerging markets with growing energy demand, development of innovative compressor technologies with enhanced efficiency and reduced emissions, and the integration of digital technologies to optimize compressor operations and enhance predictive maintenance capabilities. Further opportunities lie in serving niche applications, such as renewable natural gas compression and gas storage facilities.
Growth Accelerators in the Natural Gas Compressor Industry Industry
Long-term growth is accelerated by technological advancements such as the development of high-efficiency compressors, the integration of digital technologies for enhanced monitoring and predictive maintenance, and strategic partnerships among compressor manufacturers, EPC contractors, and end-users to deliver integrated solutions. Expansion into new geographical markets and diversification into new applications will further fuel growth.
Key Players Shaping the Natural Gas Compressor Industry Market
- Atlas Corporation AB
- Clean Energy Fuels Corp
- Bauer Compressors Inc
- Ariel Corporation
- Siemens AG
- Burckhardt Compression Holding AG
- Ingersoll Rand PLC
- General Electric Company
- HMS Group
- Howden Group Ltd
Notable Milestones in Natural Gas Compressor Industry Sector
- April 2023: Baker Hughes awarded a contract for two main refrigerant compressors (MRCs) for Qatar's North Field South (NFS) project, highlighting the growing demand for large-scale LNG compression systems.
- January 2022: Burckhardt Compression secured a contract for compression solutions for IOCL's polypropylene plant in India, showcasing the role of natural gas compressors in petrochemical applications.
In-Depth Natural Gas Compressor Industry Market Outlook
The future of the natural gas compressor market looks promising, driven by sustained demand for natural gas, ongoing investments in gas infrastructure, and technological innovation leading to increased efficiency and reduced emissions. Strategic partnerships and market expansion into emerging economies will be crucial for continued growth. The market is poised for further consolidation, with larger players potentially acquiring smaller companies to expand their product portfolios and technological capabilities.
Natural Gas Compressor Industry Segmentation
-
1. Type
- 1.1. Reciprocating
- 1.2. Screw
-
2. Application
- 2.1. Upstream
- 2.2. Downstream
- 2.3. Midstream
Natural Gas Compressor Industry Segmentation By Geography
-
1. North America
- 1.1. United States
- 1.2. Canada
- 1.3. Mexico
-
2. Europe
- 2.1. Germany
- 2.2. France
- 2.3. Spain
- 2.4. United Kingdom
- 2.5. Rest of Europe
-
3. Asia Pacific
- 3.1. China
- 3.2. India
- 3.3. Malaysia
- 3.4. Indonesia
- 3.5. Rest of Asia Pacifc
-
4. South America
- 4.1. Brazil
- 4.2. Argentina
- 4.3. Colombia
- 4.4. Rest of South America
- 5. Middle East
-
6. Saudi Arabia
- 6.1. United Arab Emirated
- 6.2. Nigeria
- 6.3. South Africa
- 6.4. Rest of Middle East
Natural Gas Compressor Industry Regional Market Share
Geographic Coverage of Natural Gas Compressor Industry
Natural Gas Compressor Industry REPORT HIGHLIGHTS
| Aspects | Details |
|---|---|
| Study Period | 2020-2034 |
| Base Year | 2025 |
| Estimated Year | 2026 |
| Forecast Period | 2026-2034 |
| Historical Period | 2020-2025 |
| Growth Rate | CAGR of 3.13% from 2020-2034 |
| Segmentation |
|
Table of Contents
- 1. Introduction
- 1.1. Research Scope
- 1.2. Market Segmentation
- 1.3. Research Objective
- 1.4. Definitions and Assumptions
- 2. Executive Summary
- 2.1. Market Snapshot
- 3. Market Dynamics
- 3.1. Market Drivers
- 3.2. Market Restrains
- 3.3. Market Trends
- 3.4. Market Opportunities
- 4. Market Factor Analysis
- 4.1. Porters Five Forces
- 4.1.1. Bargaining Power of Suppliers
- 4.1.2. Bargaining Power of Buyers
- 4.1.3. Threat of New Entrants
- 4.1.4. Threat of Substitutes
- 4.1.5. Competitive Rivalry
- 4.2. PESTEL analysis
- 4.3. BCG Analysis
- 4.3.1. Stars (High Growth, High Market Share)
- 4.3.2. Cash Cows (Low Growth, High Market Share)
- 4.3.3. Question Mark (High Growth, Low Market Share)
- 4.3.4. Dogs (Low Growth, Low Market Share)
- 4.4. Ansoff Matrix Analysis
- 4.5. Supply Chain Analysis
- 4.6. Regulatory Landscape
- 4.7. Current Market Potential and Opportunity Assessment (TAM–SAM–SOM Framework)
- 4.8. NRP Analyst Note
- 4.1. Porters Five Forces
- 5. Market Analysis, Insights and Forecast 2021-2033
- 5.1. Market Analysis, Insights and Forecast - by Type
- 5.1.1. Reciprocating
- 5.1.2. Screw
- 5.2. Market Analysis, Insights and Forecast - by Application
- 5.2.1. Upstream
- 5.2.2. Downstream
- 5.2.3. Midstream
- 5.3. Market Analysis, Insights and Forecast - by Region
- 5.3.1. North America
- 5.3.2. Europe
- 5.3.3. Asia Pacific
- 5.3.4. South America
- 5.3.5. Middle East
- 5.3.6. Saudi Arabia
- 5.1. Market Analysis, Insights and Forecast - by Type
- 6. Global Natural Gas Compressor Industry Analysis, Insights and Forecast, 2021-2033
- 6.1. Market Analysis, Insights and Forecast - by Type
- 6.1.1. Reciprocating
- 6.1.2. Screw
- 6.2. Market Analysis, Insights and Forecast - by Application
- 6.2.1. Upstream
- 6.2.2. Downstream
- 6.2.3. Midstream
- 6.1. Market Analysis, Insights and Forecast - by Type
- 7. North America Natural Gas Compressor Industry Analysis, Insights and Forecast, 2020-2032
- 7.1. Market Analysis, Insights and Forecast - by Type
- 7.1.1. Reciprocating
- 7.1.2. Screw
- 7.2. Market Analysis, Insights and Forecast - by Application
- 7.2.1. Upstream
- 7.2.2. Downstream
- 7.2.3. Midstream
- 7.1. Market Analysis, Insights and Forecast - by Type
- 8. Europe Natural Gas Compressor Industry Analysis, Insights and Forecast, 2020-2032
- 8.1. Market Analysis, Insights and Forecast - by Type
- 8.1.1. Reciprocating
- 8.1.2. Screw
- 8.2. Market Analysis, Insights and Forecast - by Application
- 8.2.1. Upstream
- 8.2.2. Downstream
- 8.2.3. Midstream
- 8.1. Market Analysis, Insights and Forecast - by Type
- 9. Asia Pacific Natural Gas Compressor Industry Analysis, Insights and Forecast, 2020-2032
- 9.1. Market Analysis, Insights and Forecast - by Type
- 9.1.1. Reciprocating
- 9.1.2. Screw
- 9.2. Market Analysis, Insights and Forecast - by Application
- 9.2.1. Upstream
- 9.2.2. Downstream
- 9.2.3. Midstream
- 9.1. Market Analysis, Insights and Forecast - by Type
- 10. South America Natural Gas Compressor Industry Analysis, Insights and Forecast, 2020-2032
- 10.1. Market Analysis, Insights and Forecast - by Type
- 10.1.1. Reciprocating
- 10.1.2. Screw
- 10.2. Market Analysis, Insights and Forecast - by Application
- 10.2.1. Upstream
- 10.2.2. Downstream
- 10.2.3. Midstream
- 10.1. Market Analysis, Insights and Forecast - by Type
- 11. Middle East Natural Gas Compressor Industry Analysis, Insights and Forecast, 2020-2032
- 11.1. Market Analysis, Insights and Forecast - by Type
- 11.1.1. Reciprocating
- 11.1.2. Screw
- 11.2. Market Analysis, Insights and Forecast - by Application
- 11.2.1. Upstream
- 11.2.2. Downstream
- 11.2.3. Midstream
- 11.1. Market Analysis, Insights and Forecast - by Type
- 12. Saudi Arabia Natural Gas Compressor Industry Analysis, Insights and Forecast, 2020-2032
- 12.1. Market Analysis, Insights and Forecast - by Type
- 12.1.1. Reciprocating
- 12.1.2. Screw
- 12.2. Market Analysis, Insights and Forecast - by Application
- 12.2.1. Upstream
- 12.2.2. Downstream
- 12.2.3. Midstream
- 12.1. Market Analysis, Insights and Forecast - by Type
- 13. Competitive Analysis
- 13.1. Company Profiles
- 13.1.1 Atlas Corporation AB
- 13.1.1.1. Company Overview
- 13.1.1.2. Products
- 13.1.1.3. Company Financials
- 13.1.1.4. SWOT Analysis
- 13.1.2 Clean Energy Fuels Corp
- 13.1.2.1. Company Overview
- 13.1.2.2. Products
- 13.1.2.3. Company Financials
- 13.1.2.4. SWOT Analysis
- 13.1.3 Bauer Compressors Inc
- 13.1.3.1. Company Overview
- 13.1.3.2. Products
- 13.1.3.3. Company Financials
- 13.1.3.4. SWOT Analysis
- 13.1.4 Ariel Corporation
- 13.1.4.1. Company Overview
- 13.1.4.2. Products
- 13.1.4.3. Company Financials
- 13.1.4.4. SWOT Analysis
- 13.1.5 Siemens AG*List Not Exhaustive
- 13.1.5.1. Company Overview
- 13.1.5.2. Products
- 13.1.5.3. Company Financials
- 13.1.5.4. SWOT Analysis
- 13.1.6 Burckhardt Compression Holding AG
- 13.1.6.1. Company Overview
- 13.1.6.2. Products
- 13.1.6.3. Company Financials
- 13.1.6.4. SWOT Analysis
- 13.1.7 Ingersoll Rand PLC
- 13.1.7.1. Company Overview
- 13.1.7.2. Products
- 13.1.7.3. Company Financials
- 13.1.7.4. SWOT Analysis
- 13.1.8 General Electric Company
- 13.1.8.1. Company Overview
- 13.1.8.2. Products
- 13.1.8.3. Company Financials
- 13.1.8.4. SWOT Analysis
- 13.1.9 HMS Group
- 13.1.9.1. Company Overview
- 13.1.9.2. Products
- 13.1.9.3. Company Financials
- 13.1.9.4. SWOT Analysis
- 13.1.10 Howden Group Ltd
- 13.1.10.1. Company Overview
- 13.1.10.2. Products
- 13.1.10.3. Company Financials
- 13.1.10.4. SWOT Analysis
- 13.1.1 Atlas Corporation AB
- 13.2. Market Entropy
- 13.2.1 Company's Key Areas Served
- 13.2.2 Recent Developments
- 13.3. Company Market Share Analysis 2025
- 13.3.1 Top 5 Companies Market Share Analysis
- 13.3.2 Top 3 Companies Market Share Analysis
- 13.4. List of Potential Customers
- 14. Research Methodology
List of Figures
- Figure 1: Global Natural Gas Compressor Industry Revenue Breakdown (Million, %) by Region 2025 & 2033
- Figure 2: North America Natural Gas Compressor Industry Revenue (Million), by Type 2025 & 2033
- Figure 3: North America Natural Gas Compressor Industry Revenue Share (%), by Type 2025 & 2033
- Figure 4: North America Natural Gas Compressor Industry Revenue (Million), by Application 2025 & 2033
- Figure 5: North America Natural Gas Compressor Industry Revenue Share (%), by Application 2025 & 2033
- Figure 6: North America Natural Gas Compressor Industry Revenue (Million), by Country 2025 & 2033
- Figure 7: North America Natural Gas Compressor Industry Revenue Share (%), by Country 2025 & 2033
- Figure 8: Europe Natural Gas Compressor Industry Revenue (Million), by Type 2025 & 2033
- Figure 9: Europe Natural Gas Compressor Industry Revenue Share (%), by Type 2025 & 2033
- Figure 10: Europe Natural Gas Compressor Industry Revenue (Million), by Application 2025 & 2033
- Figure 11: Europe Natural Gas Compressor Industry Revenue Share (%), by Application 2025 & 2033
- Figure 12: Europe Natural Gas Compressor Industry Revenue (Million), by Country 2025 & 2033
- Figure 13: Europe Natural Gas Compressor Industry Revenue Share (%), by Country 2025 & 2033
- Figure 14: Asia Pacific Natural Gas Compressor Industry Revenue (Million), by Type 2025 & 2033
- Figure 15: Asia Pacific Natural Gas Compressor Industry Revenue Share (%), by Type 2025 & 2033
- Figure 16: Asia Pacific Natural Gas Compressor Industry Revenue (Million), by Application 2025 & 2033
- Figure 17: Asia Pacific Natural Gas Compressor Industry Revenue Share (%), by Application 2025 & 2033
- Figure 18: Asia Pacific Natural Gas Compressor Industry Revenue (Million), by Country 2025 & 2033
- Figure 19: Asia Pacific Natural Gas Compressor Industry Revenue Share (%), by Country 2025 & 2033
- Figure 20: South America Natural Gas Compressor Industry Revenue (Million), by Type 2025 & 2033
- Figure 21: South America Natural Gas Compressor Industry Revenue Share (%), by Type 2025 & 2033
- Figure 22: South America Natural Gas Compressor Industry Revenue (Million), by Application 2025 & 2033
- Figure 23: South America Natural Gas Compressor Industry Revenue Share (%), by Application 2025 & 2033
- Figure 24: South America Natural Gas Compressor Industry Revenue (Million), by Country 2025 & 2033
- Figure 25: South America Natural Gas Compressor Industry Revenue Share (%), by Country 2025 & 2033
- Figure 26: Middle East Natural Gas Compressor Industry Revenue (Million), by Type 2025 & 2033
- Figure 27: Middle East Natural Gas Compressor Industry Revenue Share (%), by Type 2025 & 2033
- Figure 28: Middle East Natural Gas Compressor Industry Revenue (Million), by Application 2025 & 2033
- Figure 29: Middle East Natural Gas Compressor Industry Revenue Share (%), by Application 2025 & 2033
- Figure 30: Middle East Natural Gas Compressor Industry Revenue (Million), by Country 2025 & 2033
- Figure 31: Middle East Natural Gas Compressor Industry Revenue Share (%), by Country 2025 & 2033
- Figure 32: Saudi Arabia Natural Gas Compressor Industry Revenue (Million), by Type 2025 & 2033
- Figure 33: Saudi Arabia Natural Gas Compressor Industry Revenue Share (%), by Type 2025 & 2033
- Figure 34: Saudi Arabia Natural Gas Compressor Industry Revenue (Million), by Application 2025 & 2033
- Figure 35: Saudi Arabia Natural Gas Compressor Industry Revenue Share (%), by Application 2025 & 2033
- Figure 36: Saudi Arabia Natural Gas Compressor Industry Revenue (Million), by Country 2025 & 2033
- Figure 37: Saudi Arabia Natural Gas Compressor Industry Revenue Share (%), by Country 2025 & 2033
List of Tables
- Table 1: Global Natural Gas Compressor Industry Revenue Million Forecast, by Type 2020 & 2033
- Table 2: Global Natural Gas Compressor Industry Revenue Million Forecast, by Application 2020 & 2033
- Table 3: Global Natural Gas Compressor Industry Revenue Million Forecast, by Region 2020 & 2033
- Table 4: Global Natural Gas Compressor Industry Revenue Million Forecast, by Type 2020 & 2033
- Table 5: Global Natural Gas Compressor Industry Revenue Million Forecast, by Application 2020 & 2033
- Table 6: Global Natural Gas Compressor Industry Revenue Million Forecast, by Country 2020 & 2033
- Table 7: United States Natural Gas Compressor Industry Revenue (Million) Forecast, by Application 2020 & 2033
- Table 8: Canada Natural Gas Compressor Industry Revenue (Million) Forecast, by Application 2020 & 2033
- Table 9: Mexico Natural Gas Compressor Industry Revenue (Million) Forecast, by Application 2020 & 2033
- Table 10: Global Natural Gas Compressor Industry Revenue Million Forecast, by Type 2020 & 2033
- Table 11: Global Natural Gas Compressor Industry Revenue Million Forecast, by Application 2020 & 2033
- Table 12: Global Natural Gas Compressor Industry Revenue Million Forecast, by Country 2020 & 2033
- Table 13: Germany Natural Gas Compressor Industry Revenue (Million) Forecast, by Application 2020 & 2033
- Table 14: France Natural Gas Compressor Industry Revenue (Million) Forecast, by Application 2020 & 2033
- Table 15: Spain Natural Gas Compressor Industry Revenue (Million) Forecast, by Application 2020 & 2033
- Table 16: United Kingdom Natural Gas Compressor Industry Revenue (Million) Forecast, by Application 2020 & 2033
- Table 17: Rest of Europe Natural Gas Compressor Industry Revenue (Million) Forecast, by Application 2020 & 2033
- Table 18: Global Natural Gas Compressor Industry Revenue Million Forecast, by Type 2020 & 2033
- Table 19: Global Natural Gas Compressor Industry Revenue Million Forecast, by Application 2020 & 2033
- Table 20: Global Natural Gas Compressor Industry Revenue Million Forecast, by Country 2020 & 2033
- Table 21: China Natural Gas Compressor Industry Revenue (Million) Forecast, by Application 2020 & 2033
- Table 22: India Natural Gas Compressor Industry Revenue (Million) Forecast, by Application 2020 & 2033
- Table 23: Malaysia Natural Gas Compressor Industry Revenue (Million) Forecast, by Application 2020 & 2033
- Table 24: Indonesia Natural Gas Compressor Industry Revenue (Million) Forecast, by Application 2020 & 2033
- Table 25: Rest of Asia Pacifc Natural Gas Compressor Industry Revenue (Million) Forecast, by Application 2020 & 2033
- Table 26: Global Natural Gas Compressor Industry Revenue Million Forecast, by Type 2020 & 2033
- Table 27: Global Natural Gas Compressor Industry Revenue Million Forecast, by Application 2020 & 2033
- Table 28: Global Natural Gas Compressor Industry Revenue Million Forecast, by Country 2020 & 2033
- Table 29: Brazil Natural Gas Compressor Industry Revenue (Million) Forecast, by Application 2020 & 2033
- Table 30: Argentina Natural Gas Compressor Industry Revenue (Million) Forecast, by Application 2020 & 2033
- Table 31: Colombia Natural Gas Compressor Industry Revenue (Million) Forecast, by Application 2020 & 2033
- Table 32: Rest of South America Natural Gas Compressor Industry Revenue (Million) Forecast, by Application 2020 & 2033
- Table 33: Global Natural Gas Compressor Industry Revenue Million Forecast, by Type 2020 & 2033
- Table 34: Global Natural Gas Compressor Industry Revenue Million Forecast, by Application 2020 & 2033
- Table 35: Global Natural Gas Compressor Industry Revenue Million Forecast, by Country 2020 & 2033
- Table 36: Global Natural Gas Compressor Industry Revenue Million Forecast, by Type 2020 & 2033
- Table 37: Global Natural Gas Compressor Industry Revenue Million Forecast, by Application 2020 & 2033
- Table 38: Global Natural Gas Compressor Industry Revenue Million Forecast, by Country 2020 & 2033
- Table 39: United Arab Emirated Natural Gas Compressor Industry Revenue (Million) Forecast, by Application 2020 & 2033
- Table 40: Nigeria Natural Gas Compressor Industry Revenue (Million) Forecast, by Application 2020 & 2033
- Table 41: South Africa Natural Gas Compressor Industry Revenue (Million) Forecast, by Application 2020 & 2033
- Table 42: Rest of Middle East Natural Gas Compressor Industry Revenue (Million) Forecast, by Application 2020 & 2033
Frequently Asked Questions
1. What is the projected Compound Annual Growth Rate (CAGR) of the Natural Gas Compressor Industry?
The projected CAGR is approximately 3.13%.
2. Which companies are prominent players in the Natural Gas Compressor Industry?
Key companies in the market include Atlas Corporation AB, Clean Energy Fuels Corp, Bauer Compressors Inc, Ariel Corporation, Siemens AG*List Not Exhaustive, Burckhardt Compression Holding AG, Ingersoll Rand PLC, General Electric Company, HMS Group, Howden Group Ltd.
3. What are the main segments of the Natural Gas Compressor Industry?
The market segments include Type, Application.
4. Can you provide details about the market size?
The market size is estimated to be USD 1.86 Million as of 2022.
5. What are some drivers contributing to market growth?
4.; Growth in Natural Gas Consumption for Various Applications.
6. What are the notable trends driving market growth?
Midstream Sector Expected to Dominate the Market.
7. Are there any restraints impacting market growth?
4.; Growing Penetration of Renewables in the Energy Sector.
8. Can you provide examples of recent developments in the market?
April 2023: Oilfield services specialist Baker Hughes has been awarded a contract to supply partner QatarEnergy with two main refrigerant compressors (MRCs) for Qatar's North Field South (NFS) project. Qatargas will execute the expansion project. Each MRC train will consist of three Frame 9E DLN Ultra Low NOx gas turbines and six centrifugal compressors across two LNG trains for a total scope of supply of six gas turbines to drive 12 compressors.
9. What pricing options are available for accessing the report?
Pricing options include single-user, multi-user, and enterprise licenses priced at USD 4750, USD 5250, and USD 8750 respectively.
10. Is the market size provided in terms of value or volume?
The market size is provided in terms of value, measured in Million.
11. Are there any specific market keywords associated with the report?
Yes, the market keyword associated with the report is "Natural Gas Compressor Industry," which aids in identifying and referencing the specific market segment covered.
12. How do I determine which pricing option suits my needs best?
The pricing options vary based on user requirements and access needs. Individual users may opt for single-user licenses, while businesses requiring broader access may choose multi-user or enterprise licenses for cost-effective access to the report.
13. Are there any additional resources or data provided in the Natural Gas Compressor Industry report?
While the report offers comprehensive insights, it's advisable to review the specific contents or supplementary materials provided to ascertain if additional resources or data are available.
14. How can I stay updated on further developments or reports in the Natural Gas Compressor Industry?
To stay informed about further developments, trends, and reports in the Natural Gas Compressor Industry, consider subscribing to industry newsletters, following relevant companies and organizations, or regularly checking reputable industry news sources and publications.
Methodology
Step 1 - Identification of Relevant Samples Size from Population Database


Step 2 - Approaches for Defining Global Market Size (Value, Volume* & Price*)

Note*: In applicable scenarios
Step 3 - Data Sources
Primary Research
- Web Analytics
- Survey Reports
- Research Institute
- Latest Research Reports
- Opinion Leaders
Secondary Research
- Annual Reports
- White Paper
- Latest Press Release
- Industry Association
- Paid Database
- Investor Presentations

Step 4 - Data Triangulation
Involves using different sources of information in order to increase the validity of a study
These sources are likely to be stakeholders in a program - participants, other researchers, program staff, other community members, and so on.
Then we put all data in single framework & apply various statistical tools to find out the dynamic on the market.
During the analysis stage, feedback from the stakeholder groups would be compared to determine areas of agreement as well as areas of divergence