

Key Insights
The global offshore decommissioning services market is poised for substantial expansion, driven by the increasing number of aging offshore oil and gas assets and a growing imperative for regulatory compliance in responsible end-of-life asset removal. The market is projected to grow at a Compound Annual Growth Rate (CAGR) of 6.5%, reaching an estimated market size of $11.1 billion by the base year 2025. Key growth catalysts include stringent environmental regulations mandating the minimization of ecological impact and the rising cost of decommissioning operations, which in turn fuels demand for efficient and cost-effective solutions. Advancements in subsea decommissioning technologies, remotely operated vehicles (ROVs), and enhanced recycling processes are further propelling market growth. Market segmentation by water depth, including shallow, deepwater, and ultra-deepwater, highlights varying technical requirements and cost structures, with deepwater and ultra-deepwater segments anticipated to experience higher growth due to their inherent complexity and the need for specialized expertise. Leading industry players such as Aker Solutions ASA, DNV GL, and TechnipFMC PLC are at the forefront of innovation, securing significant market share through strategic alliances and technological breakthroughs. Geographically, North America, Europe, and Asia Pacific are primary contributors, reflecting the concentration of mature offshore oil and gas infrastructure in these regions. Emerging markets in the Middle East and Africa are also expected to witness significant growth as exploration and production activities mature, necessitating decommissioning services in the coming decades.
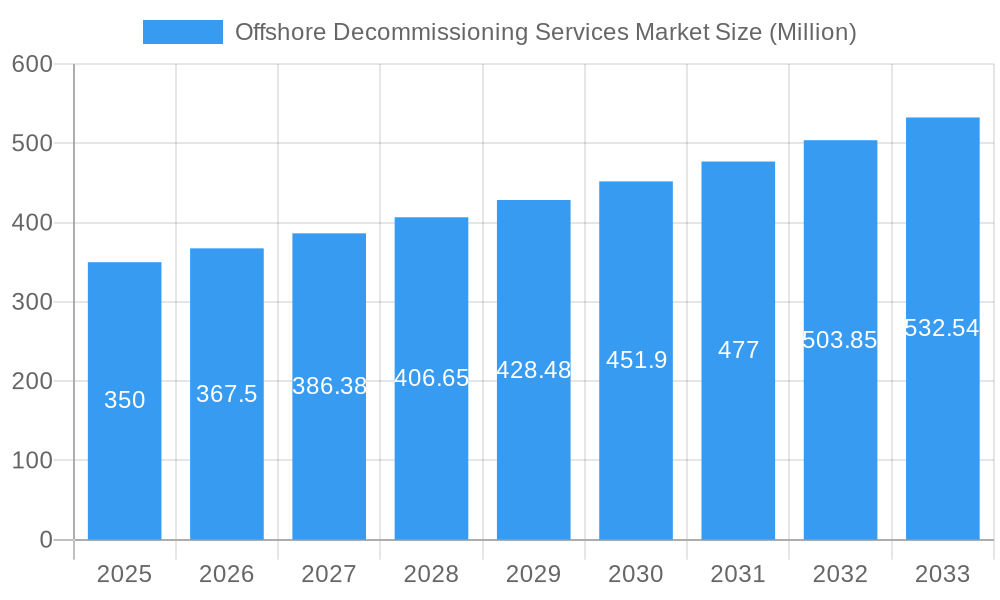
Offshore Decommissioning Services Market Market Size (In Billion)
Despite challenges such as high capital expenditure, logistical complexities in remote offshore environments, and potential specialized skill shortages, the expanding fleet of aging offshore assets, coupled with heightened environmental consciousness, solidifies this market's rapid growth trajectory. The forecast period anticipates sustained expansion, with deepwater and ultra-deepwater segments expected to be particularly lucrative due to their elevated complexity and specialized demands. The competitive landscape is anticipated to remain dynamic, characterized by ongoing mergers, acquisitions, and continuous innovation focused on enhancing efficiency and optimizing costs within the industry. A growing emphasis on sustainable decommissioning practices aligns with global sustainability objectives and aims to reduce environmental footprints.
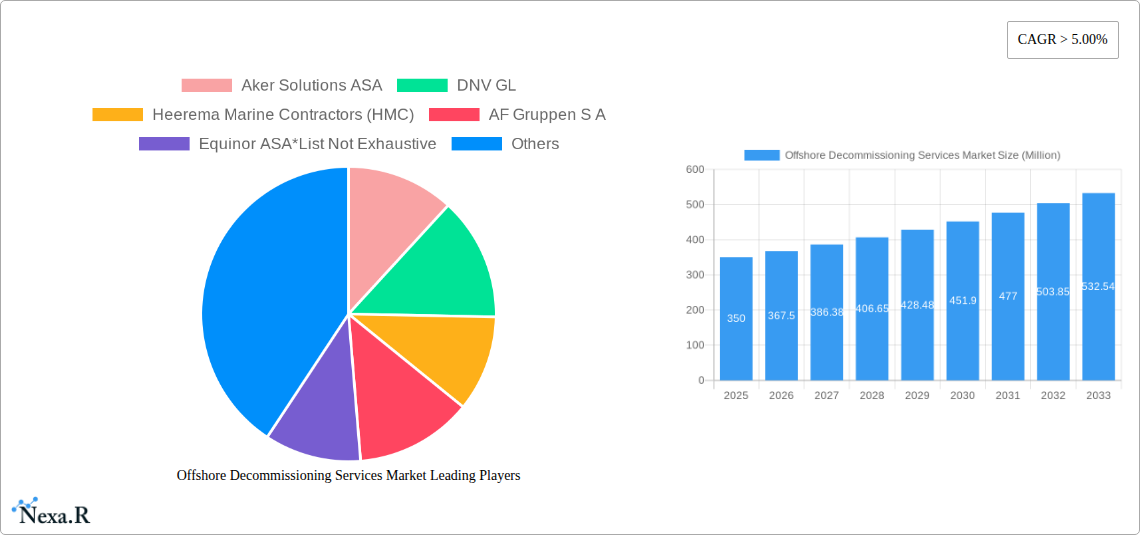
Offshore Decommissioning Services Market Company Market Share
Offshore Decommissioning Services Market: A Comprehensive Report (2019-2033)
This comprehensive report provides an in-depth analysis of the Offshore Decommissioning Services Market, encompassing market dynamics, growth trends, regional segmentation, product landscape, key players, and future outlook. The study period covers 2019-2033, with 2025 as the base and estimated year. The forecast period is 2025-2033, and the historical period is 2019-2024. This report is invaluable for industry professionals, investors, and stakeholders seeking to understand and capitalize on opportunities within this rapidly evolving market. The market is segmented by water depth: Shallow Water, Deepwater, and Ultra-Deepwater.
Parent Market: Oil and Gas Services Market Child Market: Decommissioning Services
Offshore Decommissioning Services Market Dynamics & Structure
The Offshore Decommissioning Services market is characterized by moderate concentration, with a few major players holding significant market share. The market size in 2025 is estimated at $XX Million. Technological innovation, driven by advancements in robotics, automation, and subsea technologies, is a key driver. Stringent regulatory frameworks governing environmental protection and safety are shaping industry practices. Competitive substitutes are limited, with decommissioning largely requiring specialized expertise and equipment. The end-user demographics primarily consist of oil and gas companies, and M&A activity is increasing, driven by the need for scale and specialized capabilities.
- Market Concentration: Moderately concentrated, with top 5 players holding approximately xx% market share in 2025.
- Technological Innovation: Significant advancements in remotely operated vehicles (ROVs), autonomous underwater vehicles (AUVs), and AI-powered solutions.
- Regulatory Framework: Increasingly stringent environmental regulations are driving demand for advanced, environmentally friendly decommissioning technologies.
- M&A Activity: XX major M&A deals were recorded between 2019 and 2024, signaling consolidation in the market.
- Innovation Barriers: High capital expenditure requirements and complex regulatory approvals hinder rapid innovation.
Offshore Decommissioning Services Market Growth Trends & Insights
The Offshore Decommissioning Services market is experiencing robust growth, driven by the aging global offshore oil and gas infrastructure and the increasing need for environmentally responsible decommissioning. The market is projected to witness a CAGR of xx% during the forecast period (2025-2033), reaching an estimated $XX Million by 2033. This growth is fueled by technological advancements leading to improved efficiency and reduced costs, as well as rising environmental awareness. Consumer behavior shifts towards sustainable practices are also playing a crucial role. Adoption rates of advanced decommissioning technologies are steadily increasing, with a projected penetration rate of xx% by 2033. Technological disruptions, such as the increased use of AI and robotics, are transforming the sector, allowing for faster, safer, and more cost-effective operations.
Dominant Regions, Countries, or Segments in Offshore Decommissioning Services Market
The North Sea region currently dominates the Offshore Decommissioning Services market, owing to its mature oil and gas infrastructure and large number of aging platforms. The deepwater segment is experiencing faster growth compared to shallow water due to the higher complexity and cost associated with deep-sea decommissioning projects.
- North Sea (UK, Norway, Netherlands): High concentration of aging offshore assets, supportive regulatory environment.
- Gulf of Mexico: Significant activity driven by aging platforms and increasing regulatory pressure.
- Deepwater Segment: High growth potential due to increasing complexity and cost associated with deep-sea operations. Higher demand for specialized equipment and expertise.
Offshore Decommissioning Services Market Product Landscape
The product landscape is characterized by specialized equipment and services tailored for various water depths and decommissioning phases. This includes subsea cutting and removal, platform dismantling, well plugging and abandonment, and waste management solutions. Key innovations involve the application of robotics, AI, and advanced materials to enhance efficiency, safety, and environmental performance. Unique selling propositions often center around reduced environmental impact, faster project completion times, and cost optimization.
Key Drivers, Barriers & Challenges in Offshore Decommissioning Services Market
Key Drivers:
- Increasing number of aging offshore oil and gas assets requiring decommissioning.
- Stringent environmental regulations driving the adoption of sustainable decommissioning practices.
- Technological advancements leading to increased efficiency and reduced costs.
Challenges & Restraints:
- High initial investment costs associated with specialized equipment and technology.
- Complex regulatory approvals and permitting processes.
- Potential supply chain disruptions affecting the availability of essential materials and equipment. These issues are predicted to cause a xx% delay in some projects by 2030.
Emerging Opportunities in Offshore Decommissioning Services Market
- Untapped Markets: Emerging economies with developing offshore oil and gas sectors present significant growth opportunities.
- Innovative Applications: Development of novel technologies for decommissioning complex structures and challenging environments.
- Evolving Consumer Preferences: Growing demand for sustainable and environmentally friendly decommissioning solutions.
Growth Accelerators in the Offshore Decommissioning Services Market Industry
Technological breakthroughs in robotics, AI, and subsea technologies are driving efficiency gains and reducing costs. Strategic partnerships between service providers and oil and gas companies are fostering innovation and knowledge sharing. Expansion into new geographical markets with large aging offshore infrastructure provides significant growth opportunities.
Key Players Shaping the Offshore Decommissioning Services Market Market
- Aker Solutions ASA
- DNV GL
- Heerema Marine Contractors (HMC)
- AF Gruppen S A
- Equinor ASA
- Able UK
- John Wood Group PLC
- DeepOcean Group Holding B V
- TechnipFMC PLC
- Allseas Group
Notable Milestones in Offshore Decommissioning Services Market Sector
- 2020: Introduction of a new robotic platform for subsea cutting operations by Company X.
- 2022: Successful completion of a large-scale decommissioning project in the North Sea by Company Y, highlighting cost-effective techniques.
- 2023: Merger between two major service providers, leading to increased market consolidation. (Further details would be included here if available)
In-Depth Offshore Decommissioning Services Market Market Outlook
The Offshore Decommissioning Services market is poised for significant growth, fueled by a confluence of factors. Technological advancements, increasing regulatory pressure, and the growing number of aging offshore structures all contribute to a positive outlook. Strategic partnerships and investments in innovative technologies will be critical to capitalizing on emerging opportunities within this dynamic market. The market's sustained growth is expected, driven by the increasing demand for safe and environmentally responsible decommissioning practices.
Offshore Decommissioning Services Market Segmentation
-
1. Water Depth
- 1.1. Shallow Water
- 1.2. Deepwater and Ultra-Deepwater
Offshore Decommissioning Services Market Segmentation By Geography
- 1. North America
- 2. Europe
- 3. Asia Pacific
- 4. South America
- 5. Middle East and Africa
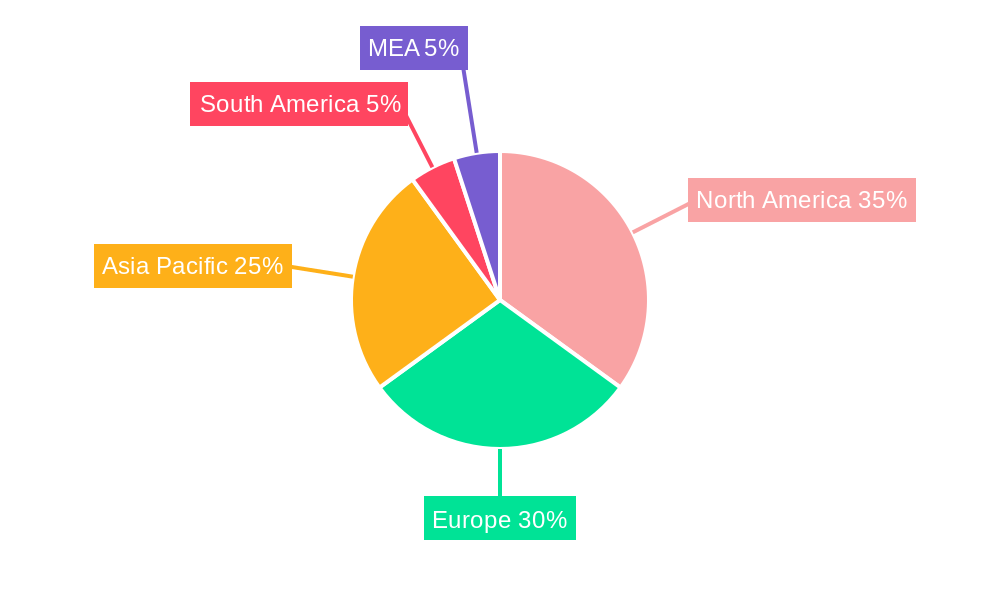
Offshore Decommissioning Services Market Regional Market Share
Geographic Coverage of Offshore Decommissioning Services Market
Offshore Decommissioning Services Market REPORT HIGHLIGHTS
| Aspects | Details |
|---|---|
| Study Period | 2020-2034 |
| Base Year | 2025 |
| Estimated Year | 2026 |
| Forecast Period | 2026-2034 |
| Historical Period | 2020-2025 |
| Growth Rate | CAGR of 6.5% from 2020-2034 |
| Segmentation |
|
Table of Contents
- 1. Introduction
- 1.1. Research Scope
- 1.2. Market Segmentation
- 1.3. Research Objective
- 1.4. Definitions and Assumptions
- 2. Executive Summary
- 2.1. Market Snapshot
- 3. Market Dynamics
- 3.1. Market Drivers
- 3.2. Market Restrains
- 3.3. Market Trends
- 3.4. Market Opportunities
- 4. Market Factor Analysis
- 4.1. Porters Five Forces
- 4.1.1. Bargaining Power of Suppliers
- 4.1.2. Bargaining Power of Buyers
- 4.1.3. Threat of New Entrants
- 4.1.4. Threat of Substitutes
- 4.1.5. Competitive Rivalry
- 4.2. PESTEL analysis
- 4.3. BCG Analysis
- 4.3.1. Stars (High Growth, High Market Share)
- 4.3.2. Cash Cows (Low Growth, High Market Share)
- 4.3.3. Question Mark (High Growth, Low Market Share)
- 4.3.4. Dogs (Low Growth, Low Market Share)
- 4.4. Ansoff Matrix Analysis
- 4.5. Supply Chain Analysis
- 4.6. Regulatory Landscape
- 4.7. Current Market Potential and Opportunity Assessment (TAM–SAM–SOM Framework)
- 4.8. NRP Analyst Note
- 4.1. Porters Five Forces
- 5. Market Analysis, Insights and Forecast 2021-2033
- 5.1. Market Analysis, Insights and Forecast - by Water Depth
- 5.1.1. Shallow Water
- 5.1.2. Deepwater and Ultra-Deepwater
- 5.2. Market Analysis, Insights and Forecast - by Region
- 5.2.1. North America
- 5.2.2. Europe
- 5.2.3. Asia Pacific
- 5.2.4. South America
- 5.2.5. Middle East and Africa
- 5.1. Market Analysis, Insights and Forecast - by Water Depth
- 6. Global Offshore Decommissioning Services Market Analysis, Insights and Forecast, 2021-2033
- 6.1. Market Analysis, Insights and Forecast - by Water Depth
- 6.1.1. Shallow Water
- 6.1.2. Deepwater and Ultra-Deepwater
- 6.1. Market Analysis, Insights and Forecast - by Water Depth
- 7. North America Offshore Decommissioning Services Market Analysis, Insights and Forecast, 2020-2032
- 7.1. Market Analysis, Insights and Forecast - by Water Depth
- 7.1.1. Shallow Water
- 7.1.2. Deepwater and Ultra-Deepwater
- 7.1. Market Analysis, Insights and Forecast - by Water Depth
- 8. Europe Offshore Decommissioning Services Market Analysis, Insights and Forecast, 2020-2032
- 8.1. Market Analysis, Insights and Forecast - by Water Depth
- 8.1.1. Shallow Water
- 8.1.2. Deepwater and Ultra-Deepwater
- 8.1. Market Analysis, Insights and Forecast - by Water Depth
- 9. Asia Pacific Offshore Decommissioning Services Market Analysis, Insights and Forecast, 2020-2032
- 9.1. Market Analysis, Insights and Forecast - by Water Depth
- 9.1.1. Shallow Water
- 9.1.2. Deepwater and Ultra-Deepwater
- 9.1. Market Analysis, Insights and Forecast - by Water Depth
- 10. South America Offshore Decommissioning Services Market Analysis, Insights and Forecast, 2020-2032
- 10.1. Market Analysis, Insights and Forecast - by Water Depth
- 10.1.1. Shallow Water
- 10.1.2. Deepwater and Ultra-Deepwater
- 10.1. Market Analysis, Insights and Forecast - by Water Depth
- 11. Middle East and Africa Offshore Decommissioning Services Market Analysis, Insights and Forecast, 2020-2032
- 11.1. Market Analysis, Insights and Forecast - by Water Depth
- 11.1.1. Shallow Water
- 11.1.2. Deepwater and Ultra-Deepwater
- 11.1. Market Analysis, Insights and Forecast - by Water Depth
- 12. Competitive Analysis
- 12.1. Company Profiles
- 12.1.1 Aker Solutions ASA
- 12.1.1.1. Company Overview
- 12.1.1.2. Products
- 12.1.1.3. Company Financials
- 12.1.1.4. SWOT Analysis
- 12.1.2 DNV GL
- 12.1.2.1. Company Overview
- 12.1.2.2. Products
- 12.1.2.3. Company Financials
- 12.1.2.4. SWOT Analysis
- 12.1.3 Heerema Marine Contractors (HMC)
- 12.1.3.1. Company Overview
- 12.1.3.2. Products
- 12.1.3.3. Company Financials
- 12.1.3.4. SWOT Analysis
- 12.1.4 AF Gruppen S A
- 12.1.4.1. Company Overview
- 12.1.4.2. Products
- 12.1.4.3. Company Financials
- 12.1.4.4. SWOT Analysis
- 12.1.5 Equinor ASA*List Not Exhaustive
- 12.1.5.1. Company Overview
- 12.1.5.2. Products
- 12.1.5.3. Company Financials
- 12.1.5.4. SWOT Analysis
- 12.1.6 Able UK
- 12.1.6.1. Company Overview
- 12.1.6.2. Products
- 12.1.6.3. Company Financials
- 12.1.6.4. SWOT Analysis
- 12.1.7 John Wood Group PLC
- 12.1.7.1. Company Overview
- 12.1.7.2. Products
- 12.1.7.3. Company Financials
- 12.1.7.4. SWOT Analysis
- 12.1.8 DeepOcean Group Holding B V
- 12.1.8.1. Company Overview
- 12.1.8.2. Products
- 12.1.8.3. Company Financials
- 12.1.8.4. SWOT Analysis
- 12.1.9 TechnipFMC PLC
- 12.1.9.1. Company Overview
- 12.1.9.2. Products
- 12.1.9.3. Company Financials
- 12.1.9.4. SWOT Analysis
- 12.1.10 Allseas Group
- 12.1.10.1. Company Overview
- 12.1.10.2. Products
- 12.1.10.3. Company Financials
- 12.1.10.4. SWOT Analysis
- 12.1.1 Aker Solutions ASA
- 12.2. Market Entropy
- 12.2.1 Company's Key Areas Served
- 12.2.2 Recent Developments
- 12.3. Company Market Share Analysis 2025
- 12.3.1 Top 5 Companies Market Share Analysis
- 12.3.2 Top 3 Companies Market Share Analysis
- 12.4. List of Potential Customers
- 13. Research Methodology
List of Figures
- Figure 1: Global Offshore Decommissioning Services Market Revenue Breakdown (billion, %) by Region 2025 & 2033
- Figure 2: North America Offshore Decommissioning Services Market Revenue (billion), by Water Depth 2025 & 2033
- Figure 3: North America Offshore Decommissioning Services Market Revenue Share (%), by Water Depth 2025 & 2033
- Figure 4: North America Offshore Decommissioning Services Market Revenue (billion), by Country 2025 & 2033
- Figure 5: North America Offshore Decommissioning Services Market Revenue Share (%), by Country 2025 & 2033
- Figure 6: Europe Offshore Decommissioning Services Market Revenue (billion), by Water Depth 2025 & 2033
- Figure 7: Europe Offshore Decommissioning Services Market Revenue Share (%), by Water Depth 2025 & 2033
- Figure 8: Europe Offshore Decommissioning Services Market Revenue (billion), by Country 2025 & 2033
- Figure 9: Europe Offshore Decommissioning Services Market Revenue Share (%), by Country 2025 & 2033
- Figure 10: Asia Pacific Offshore Decommissioning Services Market Revenue (billion), by Water Depth 2025 & 2033
- Figure 11: Asia Pacific Offshore Decommissioning Services Market Revenue Share (%), by Water Depth 2025 & 2033
- Figure 12: Asia Pacific Offshore Decommissioning Services Market Revenue (billion), by Country 2025 & 2033
- Figure 13: Asia Pacific Offshore Decommissioning Services Market Revenue Share (%), by Country 2025 & 2033
- Figure 14: South America Offshore Decommissioning Services Market Revenue (billion), by Water Depth 2025 & 2033
- Figure 15: South America Offshore Decommissioning Services Market Revenue Share (%), by Water Depth 2025 & 2033
- Figure 16: South America Offshore Decommissioning Services Market Revenue (billion), by Country 2025 & 2033
- Figure 17: South America Offshore Decommissioning Services Market Revenue Share (%), by Country 2025 & 2033
- Figure 18: Middle East and Africa Offshore Decommissioning Services Market Revenue (billion), by Water Depth 2025 & 2033
- Figure 19: Middle East and Africa Offshore Decommissioning Services Market Revenue Share (%), by Water Depth 2025 & 2033
- Figure 20: Middle East and Africa Offshore Decommissioning Services Market Revenue (billion), by Country 2025 & 2033
- Figure 21: Middle East and Africa Offshore Decommissioning Services Market Revenue Share (%), by Country 2025 & 2033
List of Tables
- Table 1: Global Offshore Decommissioning Services Market Revenue billion Forecast, by Water Depth 2020 & 2033
- Table 2: Global Offshore Decommissioning Services Market Revenue billion Forecast, by Region 2020 & 2033
- Table 3: Global Offshore Decommissioning Services Market Revenue billion Forecast, by Water Depth 2020 & 2033
- Table 4: Global Offshore Decommissioning Services Market Revenue billion Forecast, by Country 2020 & 2033
- Table 5: Global Offshore Decommissioning Services Market Revenue billion Forecast, by Water Depth 2020 & 2033
- Table 6: Global Offshore Decommissioning Services Market Revenue billion Forecast, by Country 2020 & 2033
- Table 7: Global Offshore Decommissioning Services Market Revenue billion Forecast, by Water Depth 2020 & 2033
- Table 8: Global Offshore Decommissioning Services Market Revenue billion Forecast, by Country 2020 & 2033
- Table 9: Global Offshore Decommissioning Services Market Revenue billion Forecast, by Water Depth 2020 & 2033
- Table 10: Global Offshore Decommissioning Services Market Revenue billion Forecast, by Country 2020 & 2033
- Table 11: Global Offshore Decommissioning Services Market Revenue billion Forecast, by Water Depth 2020 & 2033
- Table 12: Global Offshore Decommissioning Services Market Revenue billion Forecast, by Country 2020 & 2033
Frequently Asked Questions
1. What is the projected Compound Annual Growth Rate (CAGR) of the Offshore Decommissioning Services Market?
The projected CAGR is approximately 6.5%.
2. Which companies are prominent players in the Offshore Decommissioning Services Market?
Key companies in the market include Aker Solutions ASA, DNV GL, Heerema Marine Contractors (HMC), AF Gruppen S A, Equinor ASA*List Not Exhaustive, Able UK, John Wood Group PLC, DeepOcean Group Holding B V, TechnipFMC PLC, Allseas Group.
3. What are the main segments of the Offshore Decommissioning Services Market?
The market segments include Water Depth.
4. Can you provide details about the market size?
The market size is estimated to be USD 11.1 billion as of 2022.
5. What are some drivers contributing to market growth?
4.; Increasing Demand for Secure. Sustainable. and Clean Energy.
6. What are the notable trends driving market growth?
Shallow Water to Dominate the Market.
7. Are there any restraints impacting market growth?
4.; High Cost of Production of Biofuels.
8. Can you provide examples of recent developments in the market?
N/A
9. What pricing options are available for accessing the report?
Pricing options include single-user, multi-user, and enterprise licenses priced at USD 4750, USD 5250, and USD 8750 respectively.
10. Is the market size provided in terms of value or volume?
The market size is provided in terms of value, measured in billion.
11. Are there any specific market keywords associated with the report?
Yes, the market keyword associated with the report is "Offshore Decommissioning Services Market," which aids in identifying and referencing the specific market segment covered.
12. How do I determine which pricing option suits my needs best?
The pricing options vary based on user requirements and access needs. Individual users may opt for single-user licenses, while businesses requiring broader access may choose multi-user or enterprise licenses for cost-effective access to the report.
13. Are there any additional resources or data provided in the Offshore Decommissioning Services Market report?
While the report offers comprehensive insights, it's advisable to review the specific contents or supplementary materials provided to ascertain if additional resources or data are available.
14. How can I stay updated on further developments or reports in the Offshore Decommissioning Services Market?
To stay informed about further developments, trends, and reports in the Offshore Decommissioning Services Market, consider subscribing to industry newsletters, following relevant companies and organizations, or regularly checking reputable industry news sources and publications.
Methodology
Step 1 - Identification of Relevant Samples Size from Population Database


Step 2 - Approaches for Defining Global Market Size (Value, Volume* & Price*)

Note*: In applicable scenarios
Step 3 - Data Sources
Primary Research
- Web Analytics
- Survey Reports
- Research Institute
- Latest Research Reports
- Opinion Leaders
Secondary Research
- Annual Reports
- White Paper
- Latest Press Release
- Industry Association
- Paid Database
- Investor Presentations

Step 4 - Data Triangulation
Involves using different sources of information in order to increase the validity of a study
These sources are likely to be stakeholders in a program - participants, other researchers, program staff, other community members, and so on.
Then we put all data in single framework & apply various statistical tools to find out the dynamic on the market.
During the analysis stage, feedback from the stakeholder groups would be compared to determine areas of agreement as well as areas of divergence