

Key Insights
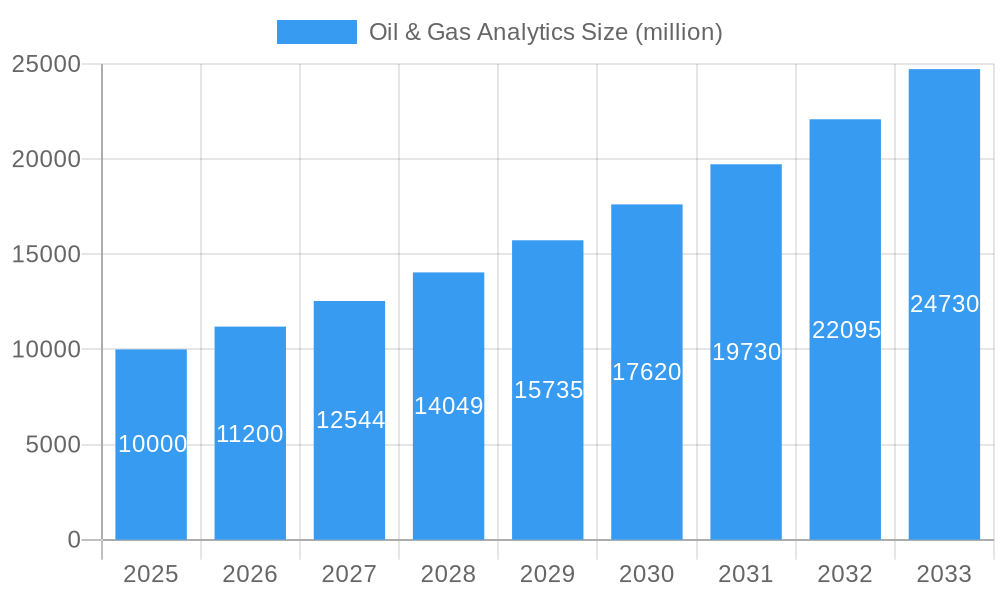
The Oil & Gas Analytics market is experiencing robust growth, driven by the increasing need for operational efficiency, enhanced safety measures, and improved decision-making within the energy sector. The market's expansion is fueled by several key factors. Firstly, the adoption of advanced technologies like artificial intelligence (AI), machine learning (ML), and big data analytics is transforming how oil and gas companies manage their operations. These technologies enable predictive maintenance, optimize production processes, and improve resource allocation, leading to significant cost savings and increased profitability. Secondly, stringent government regulations and growing environmental concerns are pushing companies to adopt sustainable practices, creating a demand for analytics solutions that help monitor emissions, optimize energy consumption, and ensure compliance. Finally, the volatile nature of the oil and gas market necessitates better forecasting and risk management capabilities, further increasing the reliance on advanced analytics. We estimate the market size in 2025 to be approximately $10 billion, with a compound annual growth rate (CAGR) of 12% projected through 2033. This growth is expected to be driven by continued digital transformation within the industry and the increasing adoption of cloud-based analytics solutions.
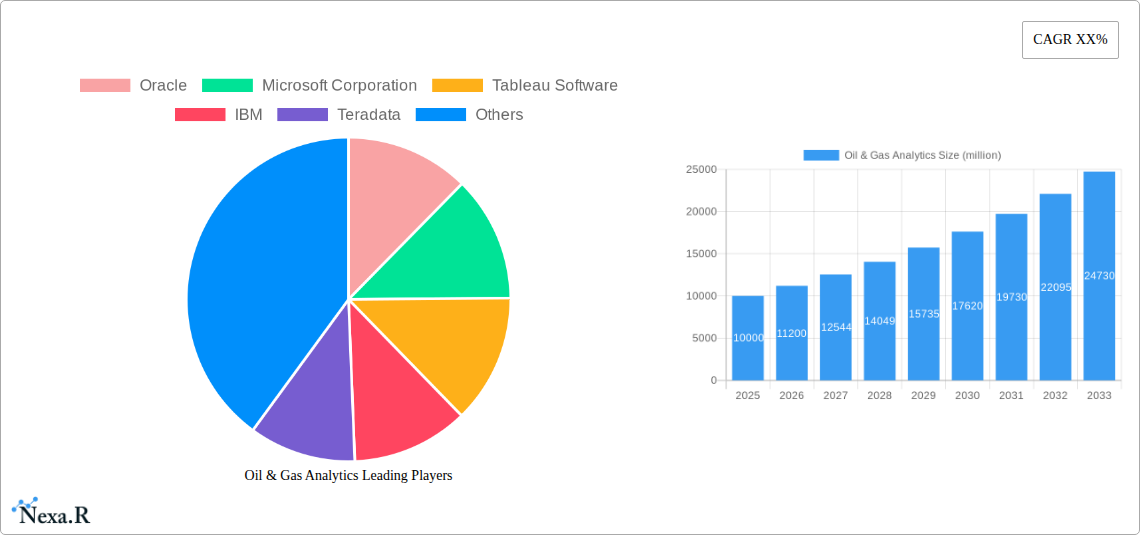
Oil & Gas Analytics Market Size (In Billion)
The competitive landscape is characterized by a mix of established technology vendors and specialized consulting firms. Major players like Oracle, Microsoft, and SAP offer comprehensive analytics platforms, while companies such as Tableau and TIBCO provide specialized data visualization and business intelligence tools. The consulting firms play a crucial role in integrating these technologies and providing customized solutions tailored to the specific needs of oil and gas companies. The market is geographically diverse, with North America and Europe currently holding significant market share. However, the Asia-Pacific region is expected to witness substantial growth in the coming years, driven by increasing investments in oil and gas exploration and production in the region. The restraints to growth include high initial investment costs for implementing advanced analytics solutions and the need for skilled professionals to manage and interpret the generated data. However, the long-term benefits of improved efficiency and decision-making are expected to outweigh these challenges, ensuring continued growth in the market.
Oil & Gas Analytics Company Market Share
Oil & Gas Analytics Market Report: 2019-2033
This comprehensive report provides a detailed analysis of the Oil & Gas Analytics market, encompassing market dynamics, growth trends, regional segmentation, product landscape, key players, and future outlook. The study period covers 2019-2033, with 2025 serving as the base and estimated year. The forecast period spans 2025-2033, while the historical period encompasses 2019-2024. The report projects a market size of xx million USD in 2025, growing at a CAGR of xx% during the forecast period. This report is crucial for oil & gas companies, analytics providers, investors, and industry consultants seeking to understand and capitalize on opportunities within this rapidly evolving market.
Oil & Gas Analytics Market Dynamics & Structure
The Oil & Gas Analytics market, valued at xx million USD in 2024, exhibits a moderately consolidated structure with key players competing on factors such as technological innovation, data security capabilities, and service offerings. The market is witnessing significant technological advancements, primarily driven by the increasing adoption of cloud-based solutions, artificial intelligence (AI), machine learning (ML), and the Internet of Things (IoT). Regulatory compliance, particularly related to data privacy and security, is a crucial factor influencing market dynamics. The market also witnesses competitive pressures from the emergence of specialized analytics solutions focused on specific segments within the Oil & Gas industry. Mergers and acquisitions (M&A) activity remains a significant aspect, with an estimated xx deals completed in the past five years, leading to increased market concentration.
- Market Concentration: Moderately Consolidated (xx% market share held by top 5 players in 2024)
- Technological Innovation Drivers: AI, ML, Cloud Computing, IoT, Big Data Analytics
- Regulatory Frameworks: Data privacy regulations (GDPR, CCPA), cybersecurity standards
- Competitive Product Substitutes: Traditional data analysis methods, specialized industry consulting
- End-User Demographics: Upstream, Midstream, Downstream Oil & Gas companies, Government Agencies
- M&A Trends: Increasing consolidation, focus on acquiring specialized technology providers
Oil & Gas Analytics Growth Trends & Insights
The Oil & Gas Analytics market has experienced substantial growth over the past few years, driven by factors such as increasing operational efficiency demands, the need for improved risk management, and the growing adoption of digital transformation initiatives. The market size has expanded from xx million USD in 2019 to xx million USD in 2024, indicating a strong growth trajectory. The rising adoption of advanced analytics techniques across various segments of the Oil & Gas value chain (upstream, midstream, and downstream) is a key growth driver. Technological advancements such as AI, machine learning, and cloud computing are significantly disrupting traditional operations and creating new opportunities for market growth. Consumer behavior is shifting towards data-driven decision-making, further fueling the demand for comprehensive analytics solutions.
- Market Size Evolution: Significant growth from xx million USD in 2019 to xx million USD in 2024, projected to reach xx million USD by 2033.
- Adoption Rates: Increasing adoption across all segments, with upstream sector showing highest growth.
- Technological Disruptions: AI/ML-driven predictive analytics, real-time data processing, and cloud-based platforms are transforming the sector.
- Consumer Behavior Shifts: Data-driven decision making is becoming increasingly prevalent.
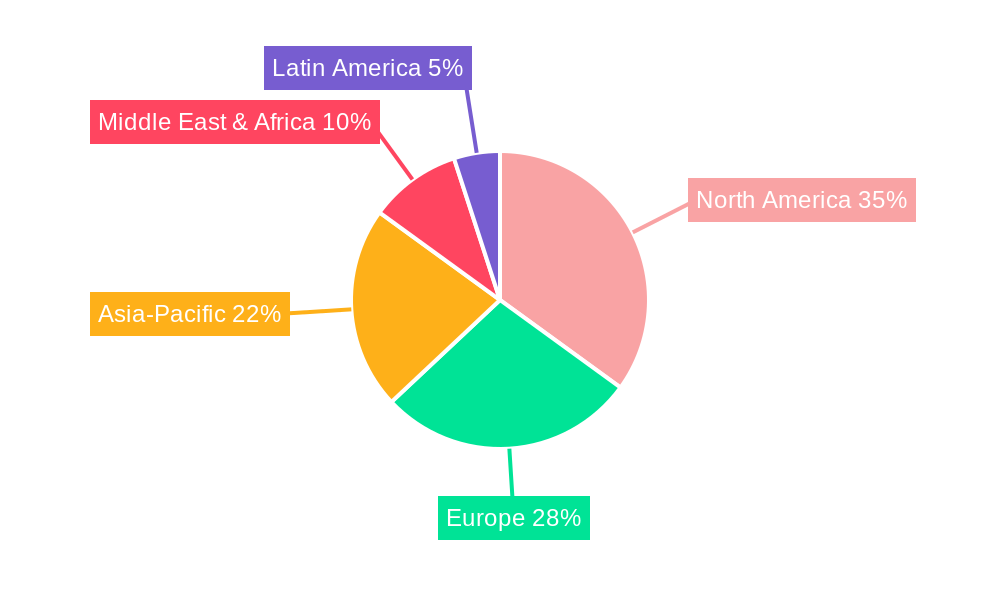
Dominant Regions, Countries, or Segments in Oil & Gas Analytics
North America holds the largest market share in the Oil & Gas Analytics market, driven by high technological adoption rates, robust digital infrastructure, and the presence of major industry players. The region’s strong regulatory framework and significant investments in R&D are also contributing to its dominance. Europe follows closely, with significant growth potential due to increased focus on digital transformation and sustainable energy solutions. The Asia-Pacific region exhibits rapid growth, driven by rising energy demands and government initiatives promoting technological advancements.
- Key Drivers (North America): Strong digital infrastructure, technological innovation, regulatory support, high adoption rates.
- Key Drivers (Europe): Increasing focus on digital transformation, sustainable energy solutions, and robust data privacy regulations.
- Key Drivers (Asia-Pacific): Rising energy demand, government initiatives promoting digital technologies, and growing investments in the oil and gas sector.
- Market Share: North America (xx%), Europe (xx%), Asia-Pacific (xx%), Rest of World (xx%) (2024 data)
Oil & Gas Analytics Product Landscape
The Oil & Gas Analytics market offers a diverse range of products, including predictive maintenance solutions, reservoir modeling software, production optimization tools, and risk management platforms. These solutions leverage various advanced technologies such as AI, ML, and big data analytics to improve operational efficiency, reduce costs, and mitigate risks. Key product innovations include real-time data processing capabilities, enhanced visualization tools, and integrated platforms combining various analytics functions. The unique selling propositions include improved accuracy, reduced downtime, optimized resource allocation, and enhanced decision-making.
Key Drivers, Barriers & Challenges in Oil & Gas Analytics
Key Drivers: The increasing need for improved operational efficiency, stringent regulatory compliance, and the growing adoption of digital transformation are key drivers of the Oil & Gas Analytics market. Moreover, the demand for enhanced risk management and improved decision-making capabilities is fueling market growth.
Key Challenges & Restraints: High implementation costs, data security concerns, and the lack of skilled professionals are significant challenges hindering market growth. Additionally, integration complexities with existing legacy systems and the need for continuous data quality management pose significant hurdles. The projected impact of these challenges is a reduced market penetration rate by xx% by 2033.
Emerging Opportunities in Oil & Gas Analytics
Emerging opportunities include the expansion of analytics solutions into untapped markets, such as smaller oil and gas companies, and the development of innovative applications focused on specific operational challenges. Moreover, the growing demand for sustainable and environmentally friendly operations is creating new opportunities for analytics solutions focused on carbon emissions reduction and resource optimization. The use of blockchain technology to improve supply chain transparency and data security presents additional growth potential.
Growth Accelerators in the Oil & Gas Analytics Industry
Technological advancements, particularly in AI, ML, and cloud computing, are key growth catalysts. Strategic partnerships between analytics providers and oil & gas companies accelerate market adoption. Expanding into new geographic markets, particularly in developing economies with high energy demand, offers significant growth potential. A focus on developing user-friendly, cost-effective solutions will further enhance market penetration.
Key Players Shaping the Oil & Gas Analytics Market
- Oracle
- Microsoft Corporation
- Tableau Software
- IBM
- Teradata
- SAS Institute, Inc.
- SAP SE
- TIBCO Software, Inc.
- Deloitte
- Capgemini
- Cognizant
- Hitachi Ltd.
- Accenture
- Cisco Systems, Inc.
- Hewlett Packard Enterprise Development LP.
Notable Milestones in Oil & Gas Analytics Sector
- 2020-Q4: Launch of AI-powered predictive maintenance platform by a major analytics provider.
- 2021-Q2: Acquisition of a specialized reservoir modeling company by a leading Oil & Gas firm.
- 2022-Q3: Introduction of cloud-based analytics solution focusing on carbon emissions monitoring.
- 2023-Q1: Several major Oil & Gas companies implement blockchain technology for supply chain optimization.
In-Depth Oil & Gas Analytics Market Outlook
The Oil & Gas Analytics market is poised for continued robust growth driven by technological innovation, increasing regulatory pressures, and the ongoing digital transformation across the industry. Strategic partnerships, investment in R&D, and the expansion into emerging markets will be critical for companies seeking to capitalize on the market’s long-term potential. The market’s future growth will significantly depend on the continued development of user-friendly, cost-effective, and scalable analytics solutions that address the specific needs of the oil and gas industry.
Oil & Gas Analytics Segmentation
-
1. Application
- 1.1. Professional Oil & Gas Analytics
- 1.2. Cloud Oil & Gas Analytics
- 1.3. Integrated Oil & Gas Analytics
-
2. Types
- 2.1. On-Premise Oil & Gas Analytics
- 2.2. Hosted Oil & Gas Analytics
Oil & Gas Analytics Segmentation By Geography
-
1. North America
- 1.1. United States
- 1.2. Canada
- 1.3. Mexico
-
2. South America
- 2.1. Brazil
- 2.2. Argentina
- 2.3. Rest of South America
-
3. Europe
- 3.1. United Kingdom
- 3.2. Germany
- 3.3. France
- 3.4. Italy
- 3.5. Spain
- 3.6. Russia
- 3.7. Benelux
- 3.8. Nordics
- 3.9. Rest of Europe
-
4. Middle East & Africa
- 4.1. Turkey
- 4.2. Israel
- 4.3. GCC
- 4.4. North Africa
- 4.5. South Africa
- 4.6. Rest of Middle East & Africa
-
5. Asia Pacific
- 5.1. China
- 5.2. India
- 5.3. Japan
- 5.4. South Korea
- 5.5. ASEAN
- 5.6. Oceania
- 5.7. Rest of Asia Pacific
Oil & Gas Analytics Regional Market Share
Geographic Coverage of Oil & Gas Analytics
Oil & Gas Analytics REPORT HIGHLIGHTS
| Aspects | Details |
|---|---|
| Study Period | 2020-2034 |
| Base Year | 2025 |
| Estimated Year | 2026 |
| Forecast Period | 2026-2034 |
| Historical Period | 2020-2025 |
| Growth Rate | CAGR of 32.76% from 2020-2034 |
| Segmentation |
|
Table of Contents
- 1. Introduction
- 1.1. Research Scope
- 1.2. Market Segmentation
- 1.3. Research Objective
- 1.4. Definitions and Assumptions
- 2. Executive Summary
- 2.1. Market Snapshot
- 3. Market Dynamics
- 3.1. Market Drivers
- 3.2. Market Restrains
- 3.3. Market Trends
- 3.4. Market Opportunities
- 4. Market Factor Analysis
- 4.1. Porters Five Forces
- 4.1.1. Bargaining Power of Suppliers
- 4.1.2. Bargaining Power of Buyers
- 4.1.3. Threat of New Entrants
- 4.1.4. Threat of Substitutes
- 4.1.5. Competitive Rivalry
- 4.2. PESTEL analysis
- 4.3. BCG Analysis
- 4.3.1. Stars (High Growth, High Market Share)
- 4.3.2. Cash Cows (Low Growth, High Market Share)
- 4.3.3. Question Mark (High Growth, Low Market Share)
- 4.3.4. Dogs (Low Growth, Low Market Share)
- 4.4. Ansoff Matrix Analysis
- 4.5. Supply Chain Analysis
- 4.6. Regulatory Landscape
- 4.7. Current Market Potential and Opportunity Assessment (TAM–SAM–SOM Framework)
- 4.8. NRP Analyst Note
- 4.1. Porters Five Forces
- 5. Market Analysis, Insights and Forecast 2021-2033
- 5.1. Market Analysis, Insights and Forecast - by Application
- 5.1.1. Professional Oil & Gas Analytics
- 5.1.2. Cloud Oil & Gas Analytics
- 5.1.3. Integrated Oil & Gas Analytics
- 5.2. Market Analysis, Insights and Forecast - by Types
- 5.2.1. On-Premise Oil & Gas Analytics
- 5.2.2. Hosted Oil & Gas Analytics
- 5.3. Market Analysis, Insights and Forecast - by Region
- 5.3.1. North America
- 5.3.2. South America
- 5.3.3. Europe
- 5.3.4. Middle East & Africa
- 5.3.5. Asia Pacific
- 5.1. Market Analysis, Insights and Forecast - by Application
- 6. Global Oil & Gas Analytics Analysis, Insights and Forecast, 2021-2033
- 6.1. Market Analysis, Insights and Forecast - by Application
- 6.1.1. Professional Oil & Gas Analytics
- 6.1.2. Cloud Oil & Gas Analytics
- 6.1.3. Integrated Oil & Gas Analytics
- 6.2. Market Analysis, Insights and Forecast - by Types
- 6.2.1. On-Premise Oil & Gas Analytics
- 6.2.2. Hosted Oil & Gas Analytics
- 6.1. Market Analysis, Insights and Forecast - by Application
- 7. North America Oil & Gas Analytics Analysis, Insights and Forecast, 2020-2032
- 7.1. Market Analysis, Insights and Forecast - by Application
- 7.1.1. Professional Oil & Gas Analytics
- 7.1.2. Cloud Oil & Gas Analytics
- 7.1.3. Integrated Oil & Gas Analytics
- 7.2. Market Analysis, Insights and Forecast - by Types
- 7.2.1. On-Premise Oil & Gas Analytics
- 7.2.2. Hosted Oil & Gas Analytics
- 7.1. Market Analysis, Insights and Forecast - by Application
- 8. South America Oil & Gas Analytics Analysis, Insights and Forecast, 2020-2032
- 8.1. Market Analysis, Insights and Forecast - by Application
- 8.1.1. Professional Oil & Gas Analytics
- 8.1.2. Cloud Oil & Gas Analytics
- 8.1.3. Integrated Oil & Gas Analytics
- 8.2. Market Analysis, Insights and Forecast - by Types
- 8.2.1. On-Premise Oil & Gas Analytics
- 8.2.2. Hosted Oil & Gas Analytics
- 8.1. Market Analysis, Insights and Forecast - by Application
- 9. Europe Oil & Gas Analytics Analysis, Insights and Forecast, 2020-2032
- 9.1. Market Analysis, Insights and Forecast - by Application
- 9.1.1. Professional Oil & Gas Analytics
- 9.1.2. Cloud Oil & Gas Analytics
- 9.1.3. Integrated Oil & Gas Analytics
- 9.2. Market Analysis, Insights and Forecast - by Types
- 9.2.1. On-Premise Oil & Gas Analytics
- 9.2.2. Hosted Oil & Gas Analytics
- 9.1. Market Analysis, Insights and Forecast - by Application
- 10. Middle East & Africa Oil & Gas Analytics Analysis, Insights and Forecast, 2020-2032
- 10.1. Market Analysis, Insights and Forecast - by Application
- 10.1.1. Professional Oil & Gas Analytics
- 10.1.2. Cloud Oil & Gas Analytics
- 10.1.3. Integrated Oil & Gas Analytics
- 10.2. Market Analysis, Insights and Forecast - by Types
- 10.2.1. On-Premise Oil & Gas Analytics
- 10.2.2. Hosted Oil & Gas Analytics
- 10.1. Market Analysis, Insights and Forecast - by Application
- 11. Asia Pacific Oil & Gas Analytics Analysis, Insights and Forecast, 2020-2032
- 11.1. Market Analysis, Insights and Forecast - by Application
- 11.1.1. Professional Oil & Gas Analytics
- 11.1.2. Cloud Oil & Gas Analytics
- 11.1.3. Integrated Oil & Gas Analytics
- 11.2. Market Analysis, Insights and Forecast - by Types
- 11.2.1. On-Premise Oil & Gas Analytics
- 11.2.2. Hosted Oil & Gas Analytics
- 11.1. Market Analysis, Insights and Forecast - by Application
- 12. Competitive Analysis
- 12.1. Company Profiles
- 12.1.1 Oracle
- 12.1.1.1. Company Overview
- 12.1.1.2. Products
- 12.1.1.3. Company Financials
- 12.1.1.4. SWOT Analysis
- 12.1.2 Microsoft Corporation
- 12.1.2.1. Company Overview
- 12.1.2.2. Products
- 12.1.2.3. Company Financials
- 12.1.2.4. SWOT Analysis
- 12.1.3 Tableau Software
- 12.1.3.1. Company Overview
- 12.1.3.2. Products
- 12.1.3.3. Company Financials
- 12.1.3.4. SWOT Analysis
- 12.1.4 IBM
- 12.1.4.1. Company Overview
- 12.1.4.2. Products
- 12.1.4.3. Company Financials
- 12.1.4.4. SWOT Analysis
- 12.1.5 Teradata
- 12.1.5.1. Company Overview
- 12.1.5.2. Products
- 12.1.5.3. Company Financials
- 12.1.5.4. SWOT Analysis
- 12.1.6 SAS Institute
- 12.1.6.1. Company Overview
- 12.1.6.2. Products
- 12.1.6.3. Company Financials
- 12.1.6.4. SWOT Analysis
- 12.1.7 Inc.
- 12.1.7.1. Company Overview
- 12.1.7.2. Products
- 12.1.7.3. Company Financials
- 12.1.7.4. SWOT Analysis
- 12.1.8 SAP SE
- 12.1.8.1. Company Overview
- 12.1.8.2. Products
- 12.1.8.3. Company Financials
- 12.1.8.4. SWOT Analysis
- 12.1.9 TIBCO Software
- 12.1.9.1. Company Overview
- 12.1.9.2. Products
- 12.1.9.3. Company Financials
- 12.1.9.4. SWOT Analysis
- 12.1.10 Inc.
- 12.1.10.1. Company Overview
- 12.1.10.2. Products
- 12.1.10.3. Company Financials
- 12.1.10.4. SWOT Analysis
- 12.1.11 Deloitte
- 12.1.11.1. Company Overview
- 12.1.11.2. Products
- 12.1.11.3. Company Financials
- 12.1.11.4. SWOT Analysis
- 12.1.12 Capgemini
- 12.1.12.1. Company Overview
- 12.1.12.2. Products
- 12.1.12.3. Company Financials
- 12.1.12.4. SWOT Analysis
- 12.1.13 Cognizant
- 12.1.13.1. Company Overview
- 12.1.13.2. Products
- 12.1.13.3. Company Financials
- 12.1.13.4. SWOT Analysis
- 12.1.14 Hitachi Ltd.
- 12.1.14.1. Company Overview
- 12.1.14.2. Products
- 12.1.14.3. Company Financials
- 12.1.14.4. SWOT Analysis
- 12.1.15 Accenture
- 12.1.15.1. Company Overview
- 12.1.15.2. Products
- 12.1.15.3. Company Financials
- 12.1.15.4. SWOT Analysis
- 12.1.16 Cisco Systems
- 12.1.16.1. Company Overview
- 12.1.16.2. Products
- 12.1.16.3. Company Financials
- 12.1.16.4. SWOT Analysis
- 12.1.17 Inc.
- 12.1.17.1. Company Overview
- 12.1.17.2. Products
- 12.1.17.3. Company Financials
- 12.1.17.4. SWOT Analysis
- 12.1.18 Hewlett Packard Enterprise Development LP.
- 12.1.18.1. Company Overview
- 12.1.18.2. Products
- 12.1.18.3. Company Financials
- 12.1.18.4. SWOT Analysis
- 12.1.1 Oracle
- 12.2. Market Entropy
- 12.2.1 Company's Key Areas Served
- 12.2.2 Recent Developments
- 12.3. Company Market Share Analysis 2025
- 12.3.1 Top 5 Companies Market Share Analysis
- 12.3.2 Top 3 Companies Market Share Analysis
- 12.4. List of Potential Customers
- 13. Research Methodology
List of Figures
- Figure 1: Global Oil & Gas Analytics Revenue Breakdown (billion, %) by Region 2025 & 2033
- Figure 2: North America Oil & Gas Analytics Revenue (billion), by Application 2025 & 2033
- Figure 3: North America Oil & Gas Analytics Revenue Share (%), by Application 2025 & 2033
- Figure 4: North America Oil & Gas Analytics Revenue (billion), by Types 2025 & 2033
- Figure 5: North America Oil & Gas Analytics Revenue Share (%), by Types 2025 & 2033
- Figure 6: North America Oil & Gas Analytics Revenue (billion), by Country 2025 & 2033
- Figure 7: North America Oil & Gas Analytics Revenue Share (%), by Country 2025 & 2033
- Figure 8: South America Oil & Gas Analytics Revenue (billion), by Application 2025 & 2033
- Figure 9: South America Oil & Gas Analytics Revenue Share (%), by Application 2025 & 2033
- Figure 10: South America Oil & Gas Analytics Revenue (billion), by Types 2025 & 2033
- Figure 11: South America Oil & Gas Analytics Revenue Share (%), by Types 2025 & 2033
- Figure 12: South America Oil & Gas Analytics Revenue (billion), by Country 2025 & 2033
- Figure 13: South America Oil & Gas Analytics Revenue Share (%), by Country 2025 & 2033
- Figure 14: Europe Oil & Gas Analytics Revenue (billion), by Application 2025 & 2033
- Figure 15: Europe Oil & Gas Analytics Revenue Share (%), by Application 2025 & 2033
- Figure 16: Europe Oil & Gas Analytics Revenue (billion), by Types 2025 & 2033
- Figure 17: Europe Oil & Gas Analytics Revenue Share (%), by Types 2025 & 2033
- Figure 18: Europe Oil & Gas Analytics Revenue (billion), by Country 2025 & 2033
- Figure 19: Europe Oil & Gas Analytics Revenue Share (%), by Country 2025 & 2033
- Figure 20: Middle East & Africa Oil & Gas Analytics Revenue (billion), by Application 2025 & 2033
- Figure 21: Middle East & Africa Oil & Gas Analytics Revenue Share (%), by Application 2025 & 2033
- Figure 22: Middle East & Africa Oil & Gas Analytics Revenue (billion), by Types 2025 & 2033
- Figure 23: Middle East & Africa Oil & Gas Analytics Revenue Share (%), by Types 2025 & 2033
- Figure 24: Middle East & Africa Oil & Gas Analytics Revenue (billion), by Country 2025 & 2033
- Figure 25: Middle East & Africa Oil & Gas Analytics Revenue Share (%), by Country 2025 & 2033
- Figure 26: Asia Pacific Oil & Gas Analytics Revenue (billion), by Application 2025 & 2033
- Figure 27: Asia Pacific Oil & Gas Analytics Revenue Share (%), by Application 2025 & 2033
- Figure 28: Asia Pacific Oil & Gas Analytics Revenue (billion), by Types 2025 & 2033
- Figure 29: Asia Pacific Oil & Gas Analytics Revenue Share (%), by Types 2025 & 2033
- Figure 30: Asia Pacific Oil & Gas Analytics Revenue (billion), by Country 2025 & 2033
- Figure 31: Asia Pacific Oil & Gas Analytics Revenue Share (%), by Country 2025 & 2033
List of Tables
- Table 1: Global Oil & Gas Analytics Revenue billion Forecast, by Application 2020 & 2033
- Table 2: Global Oil & Gas Analytics Revenue billion Forecast, by Types 2020 & 2033
- Table 3: Global Oil & Gas Analytics Revenue billion Forecast, by Region 2020 & 2033
- Table 4: Global Oil & Gas Analytics Revenue billion Forecast, by Application 2020 & 2033
- Table 5: Global Oil & Gas Analytics Revenue billion Forecast, by Types 2020 & 2033
- Table 6: Global Oil & Gas Analytics Revenue billion Forecast, by Country 2020 & 2033
- Table 7: United States Oil & Gas Analytics Revenue (billion) Forecast, by Application 2020 & 2033
- Table 8: Canada Oil & Gas Analytics Revenue (billion) Forecast, by Application 2020 & 2033
- Table 9: Mexico Oil & Gas Analytics Revenue (billion) Forecast, by Application 2020 & 2033
- Table 10: Global Oil & Gas Analytics Revenue billion Forecast, by Application 2020 & 2033
- Table 11: Global Oil & Gas Analytics Revenue billion Forecast, by Types 2020 & 2033
- Table 12: Global Oil & Gas Analytics Revenue billion Forecast, by Country 2020 & 2033
- Table 13: Brazil Oil & Gas Analytics Revenue (billion) Forecast, by Application 2020 & 2033
- Table 14: Argentina Oil & Gas Analytics Revenue (billion) Forecast, by Application 2020 & 2033
- Table 15: Rest of South America Oil & Gas Analytics Revenue (billion) Forecast, by Application 2020 & 2033
- Table 16: Global Oil & Gas Analytics Revenue billion Forecast, by Application 2020 & 2033
- Table 17: Global Oil & Gas Analytics Revenue billion Forecast, by Types 2020 & 2033
- Table 18: Global Oil & Gas Analytics Revenue billion Forecast, by Country 2020 & 2033
- Table 19: United Kingdom Oil & Gas Analytics Revenue (billion) Forecast, by Application 2020 & 2033
- Table 20: Germany Oil & Gas Analytics Revenue (billion) Forecast, by Application 2020 & 2033
- Table 21: France Oil & Gas Analytics Revenue (billion) Forecast, by Application 2020 & 2033
- Table 22: Italy Oil & Gas Analytics Revenue (billion) Forecast, by Application 2020 & 2033
- Table 23: Spain Oil & Gas Analytics Revenue (billion) Forecast, by Application 2020 & 2033
- Table 24: Russia Oil & Gas Analytics Revenue (billion) Forecast, by Application 2020 & 2033
- Table 25: Benelux Oil & Gas Analytics Revenue (billion) Forecast, by Application 2020 & 2033
- Table 26: Nordics Oil & Gas Analytics Revenue (billion) Forecast, by Application 2020 & 2033
- Table 27: Rest of Europe Oil & Gas Analytics Revenue (billion) Forecast, by Application 2020 & 2033
- Table 28: Global Oil & Gas Analytics Revenue billion Forecast, by Application 2020 & 2033
- Table 29: Global Oil & Gas Analytics Revenue billion Forecast, by Types 2020 & 2033
- Table 30: Global Oil & Gas Analytics Revenue billion Forecast, by Country 2020 & 2033
- Table 31: Turkey Oil & Gas Analytics Revenue (billion) Forecast, by Application 2020 & 2033
- Table 32: Israel Oil & Gas Analytics Revenue (billion) Forecast, by Application 2020 & 2033
- Table 33: GCC Oil & Gas Analytics Revenue (billion) Forecast, by Application 2020 & 2033
- Table 34: North Africa Oil & Gas Analytics Revenue (billion) Forecast, by Application 2020 & 2033
- Table 35: South Africa Oil & Gas Analytics Revenue (billion) Forecast, by Application 2020 & 2033
- Table 36: Rest of Middle East & Africa Oil & Gas Analytics Revenue (billion) Forecast, by Application 2020 & 2033
- Table 37: Global Oil & Gas Analytics Revenue billion Forecast, by Application 2020 & 2033
- Table 38: Global Oil & Gas Analytics Revenue billion Forecast, by Types 2020 & 2033
- Table 39: Global Oil & Gas Analytics Revenue billion Forecast, by Country 2020 & 2033
- Table 40: China Oil & Gas Analytics Revenue (billion) Forecast, by Application 2020 & 2033
- Table 41: India Oil & Gas Analytics Revenue (billion) Forecast, by Application 2020 & 2033
- Table 42: Japan Oil & Gas Analytics Revenue (billion) Forecast, by Application 2020 & 2033
- Table 43: South Korea Oil & Gas Analytics Revenue (billion) Forecast, by Application 2020 & 2033
- Table 44: ASEAN Oil & Gas Analytics Revenue (billion) Forecast, by Application 2020 & 2033
- Table 45: Oceania Oil & Gas Analytics Revenue (billion) Forecast, by Application 2020 & 2033
- Table 46: Rest of Asia Pacific Oil & Gas Analytics Revenue (billion) Forecast, by Application 2020 & 2033
Frequently Asked Questions
1. What is the projected Compound Annual Growth Rate (CAGR) of the Oil & Gas Analytics?
The projected CAGR is approximately 32.76%.
2. Which companies are prominent players in the Oil & Gas Analytics?
Key companies in the market include Oracle, Microsoft Corporation, Tableau Software, IBM, Teradata, SAS Institute, Inc., SAP SE, TIBCO Software, Inc., Deloitte, Capgemini, Cognizant, Hitachi Ltd., Accenture, Cisco Systems, Inc., Hewlett Packard Enterprise Development LP..
3. What are the main segments of the Oil & Gas Analytics?
The market segments include Application, Types.
4. Can you provide details about the market size?
The market size is estimated to be USD 5.58 billion as of 2022.
5. What are some drivers contributing to market growth?
N/A
6. What are the notable trends driving market growth?
N/A
7. Are there any restraints impacting market growth?
N/A
8. Can you provide examples of recent developments in the market?
N/A
9. What pricing options are available for accessing the report?
Pricing options include single-user, multi-user, and enterprise licenses priced at USD 4900.00, USD 7350.00, and USD 9800.00 respectively.
10. Is the market size provided in terms of value or volume?
The market size is provided in terms of value, measured in billion.
11. Are there any specific market keywords associated with the report?
Yes, the market keyword associated with the report is "Oil & Gas Analytics," which aids in identifying and referencing the specific market segment covered.
12. How do I determine which pricing option suits my needs best?
The pricing options vary based on user requirements and access needs. Individual users may opt for single-user licenses, while businesses requiring broader access may choose multi-user or enterprise licenses for cost-effective access to the report.
13. Are there any additional resources or data provided in the Oil & Gas Analytics report?
While the report offers comprehensive insights, it's advisable to review the specific contents or supplementary materials provided to ascertain if additional resources or data are available.
14. How can I stay updated on further developments or reports in the Oil & Gas Analytics?
To stay informed about further developments, trends, and reports in the Oil & Gas Analytics, consider subscribing to industry newsletters, following relevant companies and organizations, or regularly checking reputable industry news sources and publications.
Methodology
Step 1 - Identification of Relevant Samples Size from Population Database


Step 2 - Approaches for Defining Global Market Size (Value, Volume* & Price*)

Note*: In applicable scenarios
Step 3 - Data Sources
Primary Research
- Web Analytics
- Survey Reports
- Research Institute
- Latest Research Reports
- Opinion Leaders
Secondary Research
- Annual Reports
- White Paper
- Latest Press Release
- Industry Association
- Paid Database
- Investor Presentations

Step 4 - Data Triangulation
Involves using different sources of information in order to increase the validity of a study
These sources are likely to be stakeholders in a program - participants, other researchers, program staff, other community members, and so on.
Then we put all data in single framework & apply various statistical tools to find out the dynamic on the market.
During the analysis stage, feedback from the stakeholder groups would be compared to determine areas of agreement as well as areas of divergence