

Key Insights
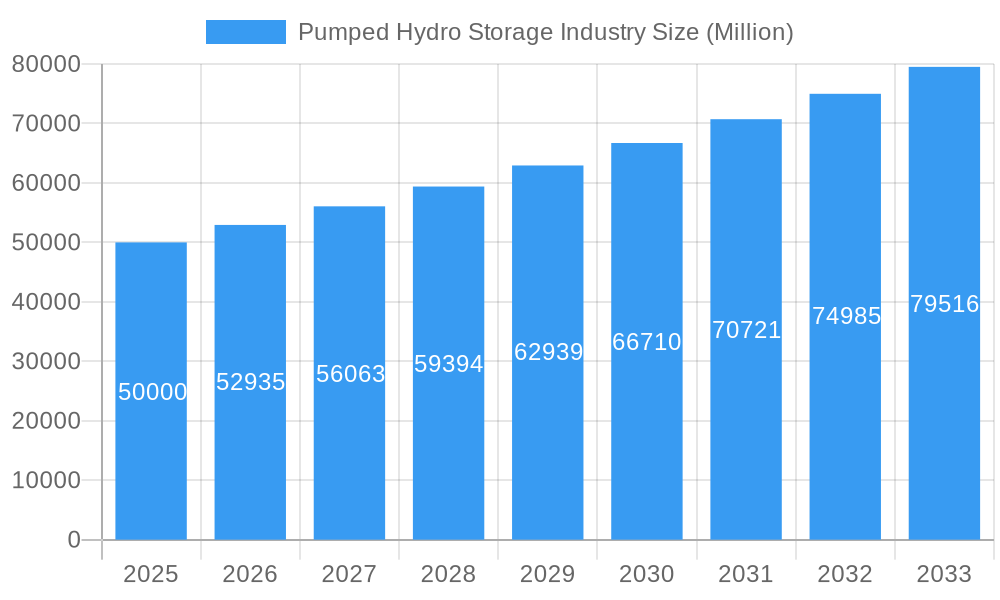
The Pumped Hydro Storage Industry is projected to experience robust growth, with a Compound Annual Growth Rate (CAGR) of 5.87% from 2025 to 2033. By 2025, the market size is expected to reach approximately $50,000 million, driven by the increasing demand for reliable energy storage solutions and the global push towards renewable energy integration. Key drivers include the need for grid stability and the growing investment in renewable energy projects. Major trends in the industry include the adoption of advanced technologies for more efficient energy storage and the expansion of pumped hydro storage facilities in regions with abundant renewable resources. The industry is segmented into open-loop and closed-loop systems, with closed-loop systems gaining traction due to their environmental benefits and flexibility in installation locations.
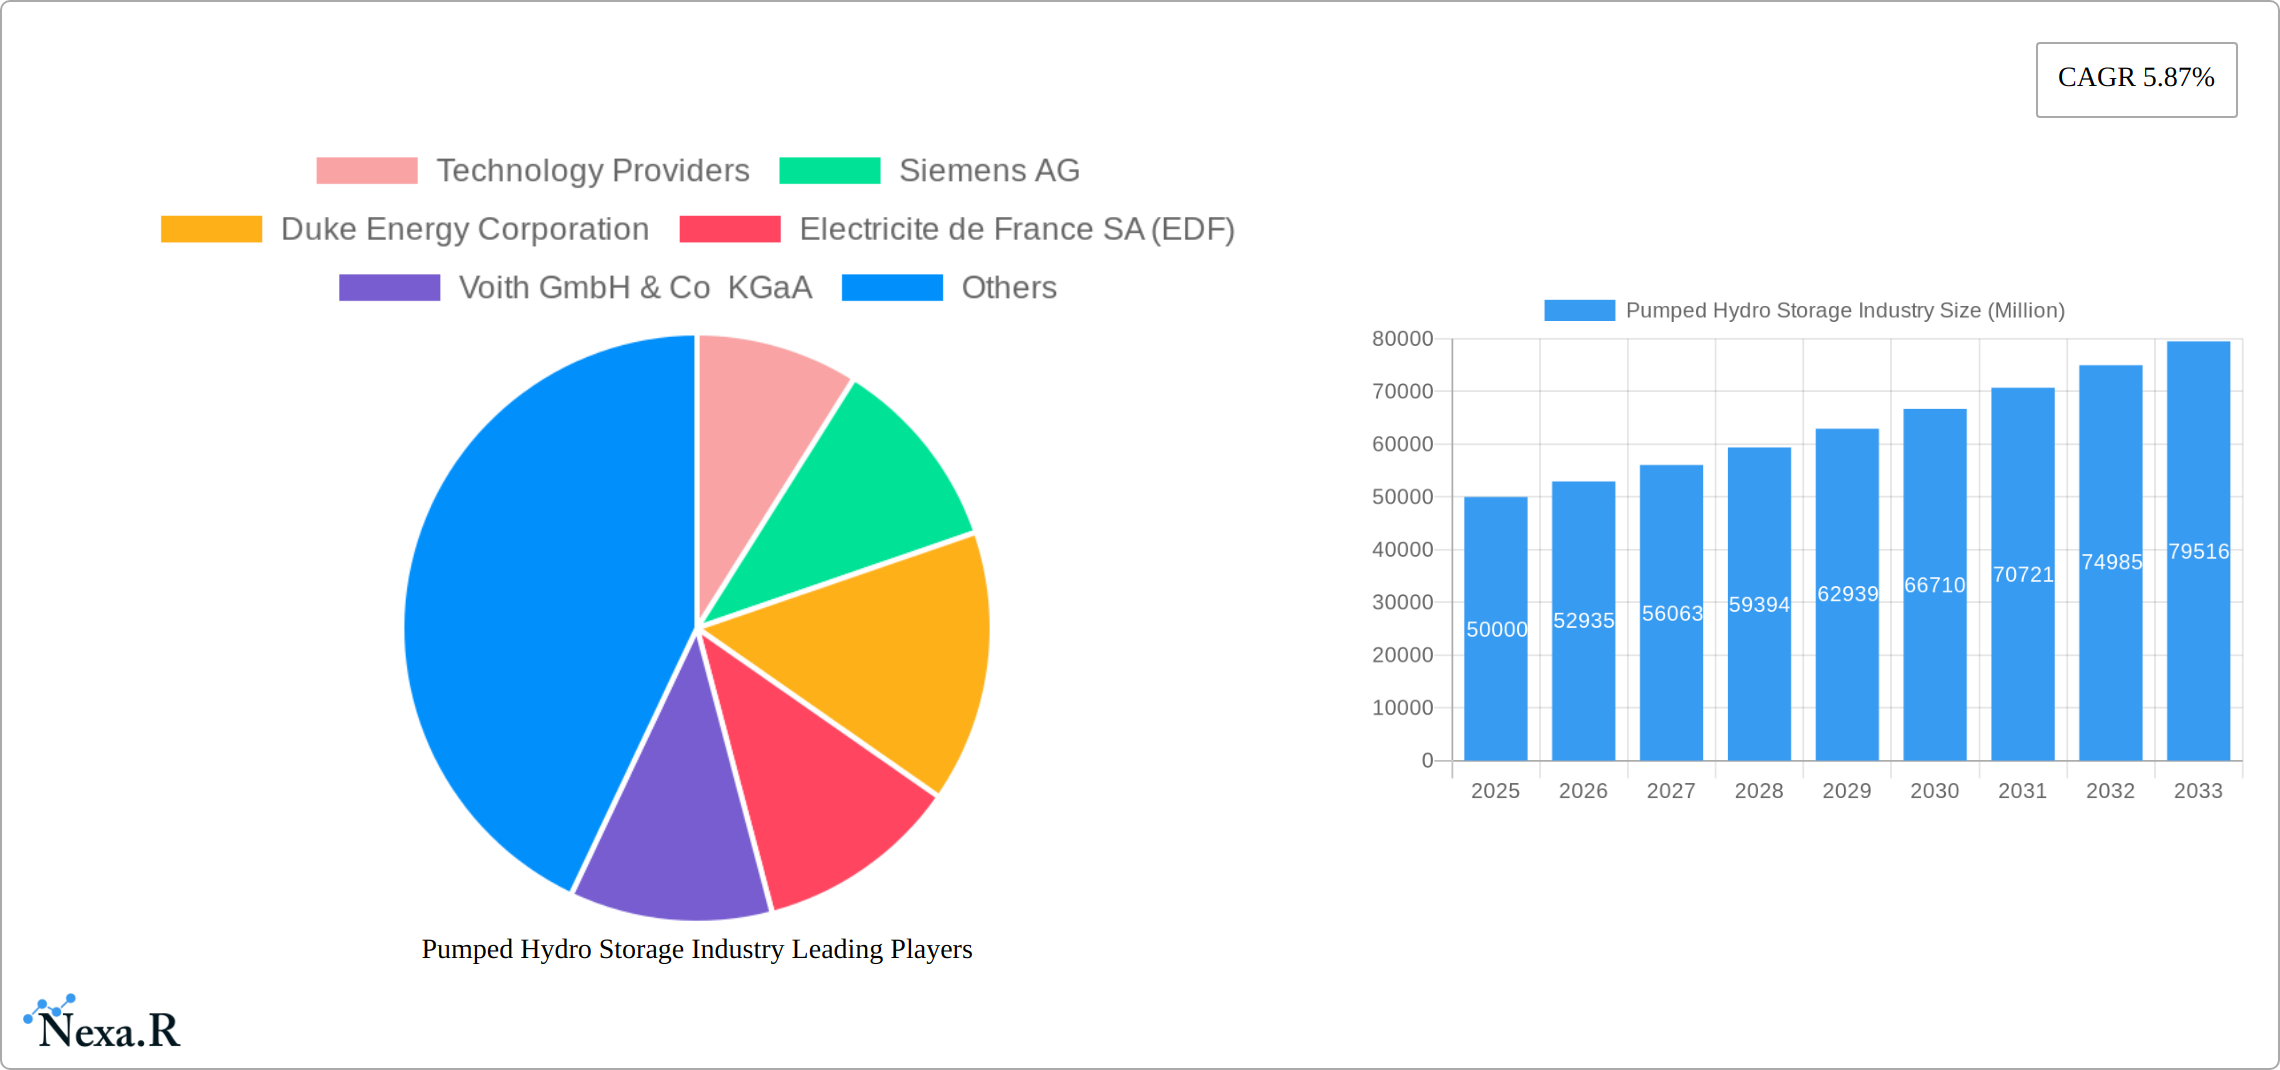
Pumped Hydro Storage Industry Market Size (In Billion)
Despite the optimistic growth projections, the Pumped Hydro Storage Industry faces certain restraints, such as high initial capital investments and environmental concerns related to large-scale projects. These challenges are being addressed through technological innovations and strategic partnerships between key players like Siemens AG, Duke Energy Corporation, and General Electric Company. The market is geographically diverse, with North America, Europe, and Asia Pacific being the leading regions due to their established energy infrastructure and supportive government policies. North America, in particular, is expected to maintain a significant market share due to the presence of major operators and ongoing investments in energy storage solutions. As the industry continues to evolve, it will play a crucial role in facilitating the transition to a more sustainable and resilient energy future.
Pumped Hydro Storage Industry Company Market Share
Pumped Hydro Storage Industry Market Report: 2019-2033
This comprehensive report provides an in-depth analysis of the Pumped Hydro Storage (PHS) industry, encompassing market dynamics, growth trends, regional dominance, product landscape, key players, and future outlook. The report covers the parent market of energy storage and the child market of pumped hydro storage, offering a granular view of this crucial sector in the renewable energy transition. The study period spans 2019-2033, with a base year of 2025 and a forecast period of 2025-2033. The report's data is presented in millions of units where applicable.
Pumped Hydro Storage Industry Market Dynamics & Structure
The PHS market is characterized by moderate concentration, with a few large players dominating technology provision and operation. Technological innovation, primarily focused on efficiency improvements and cost reduction, is a key driver, alongside supportive government regulations promoting renewable energy integration. Competitive substitutes include other energy storage technologies like batteries, but PHS maintains a significant advantage in terms of large-scale energy storage capacity. The market is witnessing increasing M&A activity, driven by the need for expansion and technological synergy.
- Market Concentration: Moderately concentrated, with top 5 players holding xx% market share in 2025.
- Technological Innovation: Focus on increasing efficiency (xx%), reducing costs (xx%), and improving lifespan.
- Regulatory Framework: Supportive policies in many regions driving project development.
- Competitive Substitutes: Battery storage, compressed air energy storage (CAES).
- End-User Demographics: Primarily utilities and independent power producers (IPPs).
- M&A Trends: xx major M&A deals in the past five years, totaling xx Million USD. Consolidation expected to continue. Innovation barriers include high capital expenditure and long lead times for project development.
Pumped Hydro Storage Industry Growth Trends & Insights
The Pumped Hydro Storage (PHS) market demonstrated substantial growth from 2019 to 2024 and is poised for continued robust expansion from 2025 to 2033. While precise figures are omitted here, projections indicate a significant market value increase by 2025, with a robust Compound Annual Growth Rate (CAGR) expected through 2033. This upward trajectory is fueled by several key factors. The escalating demand for grid-scale energy storage solutions is paramount, driven by the increasing integration of intermittent renewable energy sources like solar and wind power. Furthermore, supportive government policies worldwide are actively promoting decarbonization efforts within the power sector, creating a favorable regulatory environment for PHS development. Technological advancements, encompassing enhanced turbine designs, sophisticated digital control systems, and the implementation of advanced materials, are significantly improving the efficiency and cost-competitiveness of PHS technologies. Finally, evolving consumer preferences toward sustainable energy solutions are creating a robust market demand.
Dominant Regions, Countries, or Segments in Pumped Hydro Storage Industry
The Asia-Pacific region is projected to maintain its leading position in the PHS market throughout the forecast period. This dominance is attributed to the region's substantial investments in large-scale renewable energy projects coupled with supportive government policies and initiatives. China and India are particularly prominent growth markets, witnessing significant investments in PHS infrastructure development. Regarding system types, open-loop PHS systems currently command a larger market share compared to closed-loop systems, primarily due to lower initial capital expenditure (CAPEX) and the benefits of established technology. However, closed-loop systems present compelling advantages such as higher efficiency and a potentially smaller environmental footprint, promising notable growth in specific geographical contexts.
- Key Drivers in Asia-Pacific:
- Rapid expansion of renewable energy capacity (significant MW increase projected by 2033).
- Substantial government financial incentives and subsidies for energy storage projects (significant USD investment committed).
- Simultaneous increase in electricity demand and growing concerns regarding grid stability.
- Open-Loop Dominance: Lower CAPEX, mature technology, and broader geographical applicability.
- Closed-Loop Growth Potential: Higher efficiency, potential for smaller footprint, reduced environmental impact, and suitability for specific geographical contexts.
Pumped Hydro Storage Industry Product Landscape
The PHS industry is marked by ongoing innovation in turbine and pump technologies, leading to enhanced efficiency and reduced operational costs. Advancements in control systems and the increasing integration of digital technologies are improving grid integration and operational performance. Key selling propositions consistently emphasize long lifespan, substantial energy storage capacity, and reliable operation. These improvements are driven by ongoing technological advancements, including the utilization of cutting-edge materials, optimized hydraulic designs, and improved grid integration technologies. The focus remains on increasing efficiency and reducing the levelized cost of energy (LCOE).
Key Drivers, Barriers & Challenges in Pumped Hydro Storage Industry
Key Drivers:
- Increasing renewable energy penetration requiring grid-scale storage.
- Government policies supporting renewable energy integration and grid modernization.
- Growing concerns about energy security and climate change mitigation.
- Technological advancements reducing costs and improving efficiency.
Challenges:
- High capital expenditure (CAPEX) and long lead times for project development.
- Site-specific requirements and environmental concerns.
- Competition from other energy storage technologies (e.g., batteries).
- Regulatory hurdles and permitting processes. The impact of these challenges leads to a xx% delay in project completion on average.
Emerging Opportunities in Pumped Hydro Storage Industry
Emerging opportunities include leveraging PHS for ancillary services like frequency regulation, exploring innovative project financing models, and developing PHS solutions for smaller-scale applications. Untapped markets in developing economies present substantial growth potential. Integration with smart grids and digitalization offer further scope for optimizing operations and enhancing grid stability.
Growth Accelerators in the Pumped Hydro Storage Industry Industry
Technological breakthroughs in pump and turbine technology, coupled with reduced capital costs, will be key growth accelerators. Strategic partnerships between technology providers and operators are also crucial for project development and market expansion. Moreover, the increasing awareness of climate change and the need for grid stability will further propel the adoption of PHS systems globally.
Key Players Shaping the Pumped Hydro Storage Industry Market
- Technology Providers:
- Operators & Developers:
- Ansaldo Energia SpA
- General Electric Company
- Enel SpA
Notable Milestones in Pumped Hydro Storage Industry Sector
- June 2022: Adani Green Energy secured approval for four significant hydro-pumped storage projects (totaling 3,700 MW) in Andhra Pradesh, India, representing a substantial USD 2 billion investment commitment.
- January 2023: The Greenko Group announced a USD 1.2 billion investment in a large-scale pumped storage project (with 11 GWh daily storage capacity) in Madhya Pradesh, India, slated for commissioning in December 2024.
- *(Add more recent milestones here as they become available)*
In-Depth Pumped Hydro Storage Industry Market Outlook
The PHS market is poised for sustained growth, driven by a confluence of factors including increasing renewable energy integration, supportive government policies, technological advancements, and growing awareness of the need for grid stability and resilience. Strategic opportunities exist for companies to capitalize on the expanding market by investing in innovative technologies, forging strategic partnerships, and focusing on emerging markets. The future potential of PHS as a key component of the global energy transition is substantial.
Pumped Hydro Storage Industry Segmentation
-
1. Type
- 1.1. Open-loop
- 1.2. Closed-loop
Pumped Hydro Storage Industry Segmentation By Geography
- 1. North America
- 2. Europe
- 3. Asia Pacific
- 4. South America
- 5. Middle East and Africa
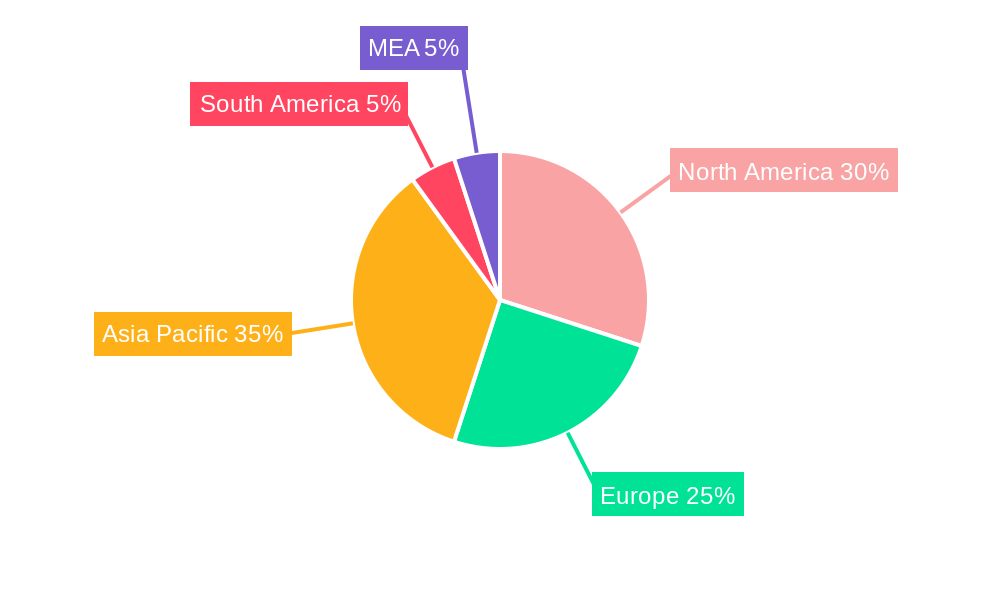
Pumped Hydro Storage Industry Regional Market Share
Geographic Coverage of Pumped Hydro Storage Industry
Pumped Hydro Storage Industry REPORT HIGHLIGHTS
| Aspects | Details |
|---|---|
| Study Period | 2020-2034 |
| Base Year | 2025 |
| Estimated Year | 2026 |
| Forecast Period | 2026-2034 |
| Historical Period | 2020-2025 |
| Growth Rate | CAGR of 11.8% from 2020-2034 |
| Segmentation |
|
Table of Contents
- 1. Introduction
- 1.1. Research Scope
- 1.2. Market Segmentation
- 1.3. Research Objective
- 1.4. Definitions and Assumptions
- 2. Executive Summary
- 2.1. Market Snapshot
- 3. Market Dynamics
- 3.1. Market Drivers
- 3.2. Market Restrains
- 3.3. Market Trends
- 3.4. Market Opportunities
- 4. Market Factor Analysis
- 4.1. Porters Five Forces
- 4.1.1. Bargaining Power of Suppliers
- 4.1.2. Bargaining Power of Buyers
- 4.1.3. Threat of New Entrants
- 4.1.4. Threat of Substitutes
- 4.1.5. Competitive Rivalry
- 4.2. PESTEL analysis
- 4.3. BCG Analysis
- 4.3.1. Stars (High Growth, High Market Share)
- 4.3.2. Cash Cows (Low Growth, High Market Share)
- 4.3.3. Question Mark (High Growth, Low Market Share)
- 4.3.4. Dogs (Low Growth, Low Market Share)
- 4.4. Ansoff Matrix Analysis
- 4.5. Supply Chain Analysis
- 4.6. Regulatory Landscape
- 4.7. Current Market Potential and Opportunity Assessment (TAM–SAM–SOM Framework)
- 4.8. NRP Analyst Note
- 4.1. Porters Five Forces
- 5. Market Analysis, Insights and Forecast 2021-2033
- 5.1. Market Analysis, Insights and Forecast - by Type
- 5.1.1. Open-loop
- 5.1.2. Closed-loop
- 5.2. Market Analysis, Insights and Forecast - by Region
- 5.2.1. North America
- 5.2.2. Europe
- 5.2.3. Asia Pacific
- 5.2.4. South America
- 5.2.5. Middle East and Africa
- 5.1. Market Analysis, Insights and Forecast - by Type
- 6. Global Pumped Hydro Storage Industry Analysis, Insights and Forecast, 2021-2033
- 6.1. Market Analysis, Insights and Forecast - by Type
- 6.1.1. Open-loop
- 6.1.2. Closed-loop
- 6.1. Market Analysis, Insights and Forecast - by Type
- 7. North America Pumped Hydro Storage Industry Analysis, Insights and Forecast, 2020-2032
- 7.1. Market Analysis, Insights and Forecast - by Type
- 7.1.1. Open-loop
- 7.1.2. Closed-loop
- 7.1. Market Analysis, Insights and Forecast - by Type
- 8. Europe Pumped Hydro Storage Industry Analysis, Insights and Forecast, 2020-2032
- 8.1. Market Analysis, Insights and Forecast - by Type
- 8.1.1. Open-loop
- 8.1.2. Closed-loop
- 8.1. Market Analysis, Insights and Forecast - by Type
- 9. Asia Pacific Pumped Hydro Storage Industry Analysis, Insights and Forecast, 2020-2032
- 9.1. Market Analysis, Insights and Forecast - by Type
- 9.1.1. Open-loop
- 9.1.2. Closed-loop
- 9.1. Market Analysis, Insights and Forecast - by Type
- 10. South America Pumped Hydro Storage Industry Analysis, Insights and Forecast, 2020-2032
- 10.1. Market Analysis, Insights and Forecast - by Type
- 10.1.1. Open-loop
- 10.1.2. Closed-loop
- 10.1. Market Analysis, Insights and Forecast - by Type
- 11. Middle East and Africa Pumped Hydro Storage Industry Analysis, Insights and Forecast, 2020-2032
- 11.1. Market Analysis, Insights and Forecast - by Type
- 11.1.1. Open-loop
- 11.1.2. Closed-loop
- 11.1. Market Analysis, Insights and Forecast - by Type
- 12. Competitive Analysis
- 12.1. Company Profiles
- 12.1.1 Technology Providers
- 12.1.1.1. Company Overview
- 12.1.1.2. Products
- 12.1.1.3. Company Financials
- 12.1.1.4. SWOT Analysis
- 12.1.2 Siemens AG
- 12.1.2.1. Company Overview
- 12.1.2.2. Products
- 12.1.2.3. Company Financials
- 12.1.2.4. SWOT Analysis
- 12.1.3 Duke Energy Corporation
- 12.1.3.1. Company Overview
- 12.1.3.2. Products
- 12.1.3.3. Company Financials
- 12.1.3.4. SWOT Analysis
- 12.1.4 Electricite de France SA (EDF)
- 12.1.4.1. Company Overview
- 12.1.4.2. Products
- 12.1.4.3. Company Financials
- 12.1.4.4. SWOT Analysis
- 12.1.5 Voith GmbH & Co KGaA
- 12.1.5.1. Company Overview
- 12.1.5.2. Products
- 12.1.5.3. Company Financials
- 12.1.5.4. SWOT Analysis
- 12.1.6 Iberdrola SA
- 12.1.6.1. Company Overview
- 12.1.6.2. Products
- 12.1.6.3. Company Financials
- 12.1.6.4. SWOT Analysis
- 12.1.7 EON SE
- 12.1.7.1. Company Overview
- 12.1.7.2. Products
- 12.1.7.3. Company Financials
- 12.1.7.4. SWOT Analysis
- 12.1.8 Mitsubishi Heavy Industries Ltd
- 12.1.8.1. Company Overview
- 12.1.8.2. Products
- 12.1.8.3. Company Financials
- 12.1.8.4. SWOT Analysis
- 12.1.9 Andritz AG
- 12.1.9.1. Company Overview
- 12.1.9.2. Products
- 12.1.9.3. Company Financials
- 12.1.9.4. SWOT Analysis
- 12.1.10 Operators
- 12.1.10.1. Company Overview
- 12.1.10.2. Products
- 12.1.10.3. Company Financials
- 12.1.10.4. SWOT Analysis
- 12.1.11 Ansaldo Energia SpA
- 12.1.11.1. Company Overview
- 12.1.11.2. Products
- 12.1.11.3. Company Financials
- 12.1.11.4. SWOT Analysis
- 12.1.12 General Electric Company
- 12.1.12.1. Company Overview
- 12.1.12.2. Products
- 12.1.12.3. Company Financials
- 12.1.12.4. SWOT Analysis
- 12.1.13 Enel SpA
- 12.1.13.1. Company Overview
- 12.1.13.2. Products
- 12.1.13.3. Company Financials
- 12.1.13.4. SWOT Analysis
- 12.1.1 Technology Providers
- 12.2. Market Entropy
- 12.2.1 Company's Key Areas Served
- 12.2.2 Recent Developments
- 12.3. Company Market Share Analysis 2025
- 12.3.1 Top 5 Companies Market Share Analysis
- 12.3.2 Top 3 Companies Market Share Analysis
- 12.4. List of Potential Customers
- 13. Research Methodology
List of Figures
- Figure 1: Global Pumped Hydro Storage Industry Revenue Breakdown (billion, %) by Region 2025 & 2033
- Figure 2: Global Pumped Hydro Storage Industry Volume Breakdown (Gigawatt, %) by Region 2025 & 2033
- Figure 3: North America Pumped Hydro Storage Industry Revenue (billion), by Type 2025 & 2033
- Figure 4: North America Pumped Hydro Storage Industry Volume (Gigawatt), by Type 2025 & 2033
- Figure 5: North America Pumped Hydro Storage Industry Revenue Share (%), by Type 2025 & 2033
- Figure 6: North America Pumped Hydro Storage Industry Volume Share (%), by Type 2025 & 2033
- Figure 7: North America Pumped Hydro Storage Industry Revenue (billion), by Country 2025 & 2033
- Figure 8: North America Pumped Hydro Storage Industry Volume (Gigawatt), by Country 2025 & 2033
- Figure 9: North America Pumped Hydro Storage Industry Revenue Share (%), by Country 2025 & 2033
- Figure 10: North America Pumped Hydro Storage Industry Volume Share (%), by Country 2025 & 2033
- Figure 11: Europe Pumped Hydro Storage Industry Revenue (billion), by Type 2025 & 2033
- Figure 12: Europe Pumped Hydro Storage Industry Volume (Gigawatt), by Type 2025 & 2033
- Figure 13: Europe Pumped Hydro Storage Industry Revenue Share (%), by Type 2025 & 2033
- Figure 14: Europe Pumped Hydro Storage Industry Volume Share (%), by Type 2025 & 2033
- Figure 15: Europe Pumped Hydro Storage Industry Revenue (billion), by Country 2025 & 2033
- Figure 16: Europe Pumped Hydro Storage Industry Volume (Gigawatt), by Country 2025 & 2033
- Figure 17: Europe Pumped Hydro Storage Industry Revenue Share (%), by Country 2025 & 2033
- Figure 18: Europe Pumped Hydro Storage Industry Volume Share (%), by Country 2025 & 2033
- Figure 19: Asia Pacific Pumped Hydro Storage Industry Revenue (billion), by Type 2025 & 2033
- Figure 20: Asia Pacific Pumped Hydro Storage Industry Volume (Gigawatt), by Type 2025 & 2033
- Figure 21: Asia Pacific Pumped Hydro Storage Industry Revenue Share (%), by Type 2025 & 2033
- Figure 22: Asia Pacific Pumped Hydro Storage Industry Volume Share (%), by Type 2025 & 2033
- Figure 23: Asia Pacific Pumped Hydro Storage Industry Revenue (billion), by Country 2025 & 2033
- Figure 24: Asia Pacific Pumped Hydro Storage Industry Volume (Gigawatt), by Country 2025 & 2033
- Figure 25: Asia Pacific Pumped Hydro Storage Industry Revenue Share (%), by Country 2025 & 2033
- Figure 26: Asia Pacific Pumped Hydro Storage Industry Volume Share (%), by Country 2025 & 2033
- Figure 27: South America Pumped Hydro Storage Industry Revenue (billion), by Type 2025 & 2033
- Figure 28: South America Pumped Hydro Storage Industry Volume (Gigawatt), by Type 2025 & 2033
- Figure 29: South America Pumped Hydro Storage Industry Revenue Share (%), by Type 2025 & 2033
- Figure 30: South America Pumped Hydro Storage Industry Volume Share (%), by Type 2025 & 2033
- Figure 31: South America Pumped Hydro Storage Industry Revenue (billion), by Country 2025 & 2033
- Figure 32: South America Pumped Hydro Storage Industry Volume (Gigawatt), by Country 2025 & 2033
- Figure 33: South America Pumped Hydro Storage Industry Revenue Share (%), by Country 2025 & 2033
- Figure 34: South America Pumped Hydro Storage Industry Volume Share (%), by Country 2025 & 2033
- Figure 35: Middle East and Africa Pumped Hydro Storage Industry Revenue (billion), by Type 2025 & 2033
- Figure 36: Middle East and Africa Pumped Hydro Storage Industry Volume (Gigawatt), by Type 2025 & 2033
- Figure 37: Middle East and Africa Pumped Hydro Storage Industry Revenue Share (%), by Type 2025 & 2033
- Figure 38: Middle East and Africa Pumped Hydro Storage Industry Volume Share (%), by Type 2025 & 2033
- Figure 39: Middle East and Africa Pumped Hydro Storage Industry Revenue (billion), by Country 2025 & 2033
- Figure 40: Middle East and Africa Pumped Hydro Storage Industry Volume (Gigawatt), by Country 2025 & 2033
- Figure 41: Middle East and Africa Pumped Hydro Storage Industry Revenue Share (%), by Country 2025 & 2033
- Figure 42: Middle East and Africa Pumped Hydro Storage Industry Volume Share (%), by Country 2025 & 2033
List of Tables
- Table 1: Global Pumped Hydro Storage Industry Revenue billion Forecast, by Type 2020 & 2033
- Table 2: Global Pumped Hydro Storage Industry Volume Gigawatt Forecast, by Type 2020 & 2033
- Table 3: Global Pumped Hydro Storage Industry Revenue billion Forecast, by Region 2020 & 2033
- Table 4: Global Pumped Hydro Storage Industry Volume Gigawatt Forecast, by Region 2020 & 2033
- Table 5: Global Pumped Hydro Storage Industry Revenue billion Forecast, by Type 2020 & 2033
- Table 6: Global Pumped Hydro Storage Industry Volume Gigawatt Forecast, by Type 2020 & 2033
- Table 7: Global Pumped Hydro Storage Industry Revenue billion Forecast, by Country 2020 & 2033
- Table 8: Global Pumped Hydro Storage Industry Volume Gigawatt Forecast, by Country 2020 & 2033
- Table 9: Global Pumped Hydro Storage Industry Revenue billion Forecast, by Type 2020 & 2033
- Table 10: Global Pumped Hydro Storage Industry Volume Gigawatt Forecast, by Type 2020 & 2033
- Table 11: Global Pumped Hydro Storage Industry Revenue billion Forecast, by Country 2020 & 2033
- Table 12: Global Pumped Hydro Storage Industry Volume Gigawatt Forecast, by Country 2020 & 2033
- Table 13: Global Pumped Hydro Storage Industry Revenue billion Forecast, by Type 2020 & 2033
- Table 14: Global Pumped Hydro Storage Industry Volume Gigawatt Forecast, by Type 2020 & 2033
- Table 15: Global Pumped Hydro Storage Industry Revenue billion Forecast, by Country 2020 & 2033
- Table 16: Global Pumped Hydro Storage Industry Volume Gigawatt Forecast, by Country 2020 & 2033
- Table 17: Global Pumped Hydro Storage Industry Revenue billion Forecast, by Type 2020 & 2033
- Table 18: Global Pumped Hydro Storage Industry Volume Gigawatt Forecast, by Type 2020 & 2033
- Table 19: Global Pumped Hydro Storage Industry Revenue billion Forecast, by Country 2020 & 2033
- Table 20: Global Pumped Hydro Storage Industry Volume Gigawatt Forecast, by Country 2020 & 2033
- Table 21: Global Pumped Hydro Storage Industry Revenue billion Forecast, by Type 2020 & 2033
- Table 22: Global Pumped Hydro Storage Industry Volume Gigawatt Forecast, by Type 2020 & 2033
- Table 23: Global Pumped Hydro Storage Industry Revenue billion Forecast, by Country 2020 & 2033
- Table 24: Global Pumped Hydro Storage Industry Volume Gigawatt Forecast, by Country 2020 & 2033
Frequently Asked Questions
1. What is the projected Compound Annual Growth Rate (CAGR) of the Pumped Hydro Storage Industry?
The projected CAGR is approximately 11.8%.
2. Which companies are prominent players in the Pumped Hydro Storage Industry?
Key companies in the market include Technology Providers, Siemens AG, Duke Energy Corporation, Electricite de France SA (EDF), Voith GmbH & Co KGaA, Iberdrola SA, EON SE, Mitsubishi Heavy Industries Ltd, Andritz AG, Operators, Ansaldo Energia SpA, General Electric Company, Enel SpA.
3. What are the main segments of the Pumped Hydro Storage Industry?
The market segments include Type.
4. Can you provide details about the market size?
The market size is estimated to be USD 349 billion as of 2022.
5. What are some drivers contributing to market growth?
4.; Reduction in Energy Bills Due to Self-Power Consumption4.; Increasing Installation of Solar PV Modules in Residential Segment.
6. What are the notable trends driving market growth?
Closed-loop Segment Expected to Dominate the Market.
7. Are there any restraints impacting market growth?
4.; High Installation Cost as Compared to Rooftop PV Systems.
8. Can you provide examples of recent developments in the market?
January 2023: The Greenko Group announced an investment of USD 1.2 billion to set up a pumped storage project in the Neemuch district of Madhya Pradesh, India. The project will have a daily storage capacity of 11 GWh. Further, the pumped hydro storage project will be connected to the interstate transmission system network and is expected to be commissioned in December 2024.
9. What pricing options are available for accessing the report?
Pricing options include single-user, multi-user, and enterprise licenses priced at USD 4750, USD 5250, and USD 8750 respectively.
10. Is the market size provided in terms of value or volume?
The market size is provided in terms of value, measured in billion and volume, measured in Gigawatt.
11. Are there any specific market keywords associated with the report?
Yes, the market keyword associated with the report is "Pumped Hydro Storage Industry," which aids in identifying and referencing the specific market segment covered.
12. How do I determine which pricing option suits my needs best?
The pricing options vary based on user requirements and access needs. Individual users may opt for single-user licenses, while businesses requiring broader access may choose multi-user or enterprise licenses for cost-effective access to the report.
13. Are there any additional resources or data provided in the Pumped Hydro Storage Industry report?
While the report offers comprehensive insights, it's advisable to review the specific contents or supplementary materials provided to ascertain if additional resources or data are available.
14. How can I stay updated on further developments or reports in the Pumped Hydro Storage Industry?
To stay informed about further developments, trends, and reports in the Pumped Hydro Storage Industry, consider subscribing to industry newsletters, following relevant companies and organizations, or regularly checking reputable industry news sources and publications.
Methodology
Step 1 - Identification of Relevant Samples Size from Population Database


Step 2 - Approaches for Defining Global Market Size (Value, Volume* & Price*)

Note*: In applicable scenarios
Step 3 - Data Sources
Primary Research
- Web Analytics
- Survey Reports
- Research Institute
- Latest Research Reports
- Opinion Leaders
Secondary Research
- Annual Reports
- White Paper
- Latest Press Release
- Industry Association
- Paid Database
- Investor Presentations

Step 4 - Data Triangulation
Involves using different sources of information in order to increase the validity of a study
These sources are likely to be stakeholders in a program - participants, other researchers, program staff, other community members, and so on.
Then we put all data in single framework & apply various statistical tools to find out the dynamic on the market.
During the analysis stage, feedback from the stakeholder groups would be compared to determine areas of agreement as well as areas of divergence