

Key Insights
The global Renewable Energy Inverters Market is set for substantial expansion, forecasted to reach $11.8 billion by 2024, exhibiting a Compound Annual Growth Rate (CAGR) of 14.2% through 2033. This growth is propelled by increasing demand for clean energy, supportive government policies, and advancements in inverter technology. The global shift towards decarbonization, coupled with rising investments in solar and wind energy projects, further accelerates market expansion. Innovations in smart grid integration, energy storage, and the development of compact, intelligent inverters are also key drivers enhancing adoption.
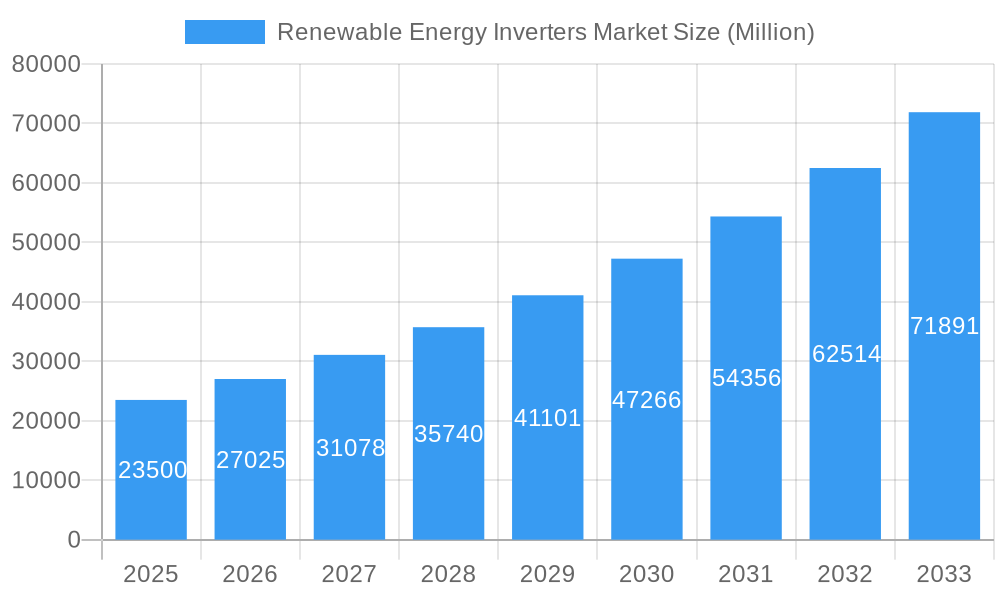
Renewable Energy Inverters Market Market Size (In Billion)
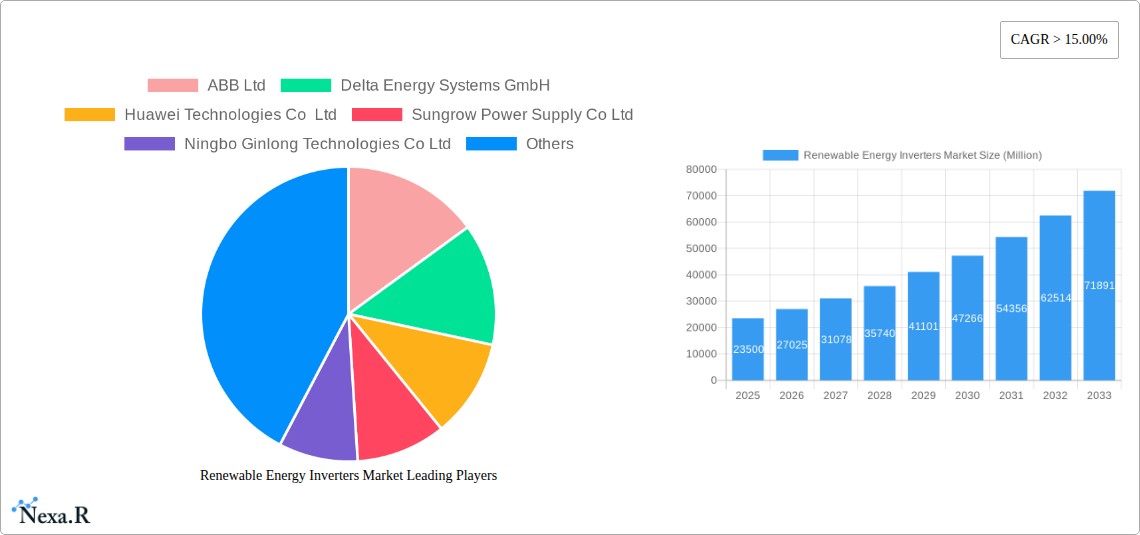
Market segmentation indicates strong performance for single-phase inverters in residential applications due to cost-effectiveness, while three-phase inverters will lead in commercial, industrial, and utility-scale projects. Inverters with power ratings of 41kW to 80kW and above 80kW are expected to experience the fastest growth, driven by larger utility and industrial solar and wind farms. The Asia Pacific region is a dominant market due to aggressive renewable energy targets and manufacturing prowess. North America and Europe are significant contributors, driven by environmental regulations and consumer demand for sustainable energy. Leading companies such as ABB Ltd, Sungrow Power Supply Co Ltd, and Huawei Technologies Co Ltd are actively investing in R&D to maintain market leadership.
Renewable Energy Inverters Market Company Market Share
Renewable Energy Inverters Market: Comprehensive Market Analysis & Future Outlook (2019-2033)
Gain unparalleled insights into the global renewable energy inverters market, a critical component driving the clean energy transition. This in-depth report provides a comprehensive analysis of market dynamics, growth trends, regional dominance, product landscape, key drivers, challenges, opportunities, and a detailed player landscape. With a focus on both parent market (Renewable Energy Inverters) and child markets (e.g., Solar Inverters, Wind Turbine Inverters, Battery Energy Storage System (BESS) Inverters), this report offers actionable intelligence for stakeholders across the value chain. We leverage advanced analytics and extensive primary and secondary research to deliver precise market valuations in million units, covering the historical period (2019-2024), base year (2025), estimated year (2025), and forecast period (2025-2033).
Renewable Energy Inverters Market Market Dynamics & Structure
The renewable energy inverters market is characterized by a moderately concentrated structure, with a few dominant global players holding significant market share. Technological innovation, particularly in areas like grid integration, smart functionalities, and enhanced efficiency, acts as a primary driver. Stringent regulatory frameworks and government incentives for renewable energy adoption globally are further stimulating demand. While competition is robust, the competitive product substitutes landscape is largely confined to incremental improvements within inverter technologies rather than entirely new alternatives for core functionality. End-user demographics are shifting, with a pronounced increase in demand from the utility-scale segment and a steady growth in the residential and commercial & industrial (C&I) sectors. Merger and acquisition (M&A) trends are evident as larger players seek to consolidate market presence, acquire innovative technologies, and expand their geographical reach.
- Market Concentration: Dominated by key players with a focus on R&D and global presence.
- Technological Innovation Drivers: Focus on grid modernization, energy storage integration, AI-driven optimization, and enhanced safety features.
- Regulatory Frameworks: Favorable government policies, renewable energy mandates, and net-metering schemes significantly influence market growth.
- Competitive Product Substitutes: Limited direct substitutes, with competition primarily revolving around performance, reliability, and cost-effectiveness of inverter technologies.
- End-User Demographics: Growing demand from utility-scale projects, alongside increasing adoption in residential and C&I sectors for distributed generation.
- M&A Trends: Strategic acquisitions to expand product portfolios, gain market share, and enter new geographical regions.
Renewable Energy Inverters Market Growth Trends & Insights
The renewable energy inverters market is poised for substantial growth, propelled by the global imperative to decarbonize energy systems and combat climate change. The market size evolution is a direct reflection of escalating investments in solar photovoltaic (PV), wind power, and battery energy storage systems (BESS). Adoption rates for renewable energy technologies are accelerating, driven by declining costs, technological advancements, and supportive government policies. Technological disruptions such as the advent of advanced inverter functionalities like grid-forming capabilities, hybrid inverters, and advanced power conversion techniques are reshaping the market landscape. Consumer behavior is shifting towards greater energy independence and sustainability, fostering demand for distributed renewable energy solutions, with inverters being a crucial component. The projected Compound Annual Growth Rate (CAGR) for the forecast period is estimated at 12.5%, with the market reaching an estimated valuation of USD 35,200 Million units by 2033. Market penetration of advanced inverter technologies is expected to witness a significant surge, particularly in regions with ambitious renewable energy targets.
Dominant Regions, Countries, or Segments in Renewable Energy Inverters Market
Asia Pacific currently dominates the renewable energy inverters market, driven by its expansive solar PV deployment and growing wind energy capacity. China, in particular, stands as a powerhouse, fueled by robust domestic demand, manufacturing capabilities, and supportive government policies for renewable energy integration. Within segments, the Three Phase inverter segment, particularly in the Above 80kW power rating category for utility-scale projects, represents the largest and fastest-growing market share. The Commercial & Industrial end-user segment is also exhibiting significant momentum, fueled by corporate sustainability initiatives and the drive for cost savings.
- Dominant Region: Asia Pacific, led by China and India, owing to massive solar PV and wind power installations.
- Dominant Country: China, as a global leader in renewable energy manufacturing and deployment.
- Dominant Phase: Three Phase inverters, crucial for higher power applications in commercial and utility-scale projects.
- Dominant Power Rating: Above 80kW, catering to the increasing size and complexity of utility-scale renewable energy farms.
- Dominant End-User: Commercial & Industrial (C&I) sector, driven by cost-effectiveness, energy independence, and corporate ESG goals.
- Key Drivers in Dominant Segments: Supportive government policies, substantial investments in renewable energy infrastructure, declining technology costs, and increasing demand for grid stability solutions.
- Growth Potential Analysis: The utility segment, especially with the integration of energy storage, presents substantial growth potential due to the need for grid modernization and reliable power supply.
Renewable Energy Inverters Market Product Landscape
The product landscape of the renewable energy inverters market is characterized by continuous innovation focused on enhanced efficiency, reliability, and intelligent functionalities. Advancements include the development of high-efficiency string inverters with improved MPPT algorithms, modular and scalable central inverters for large-scale projects, and sophisticated hybrid inverters that seamlessly integrate solar power with battery storage. Product innovations are also emphasizing enhanced grid support features, such as grid-forming capabilities, frequency regulation, and voltage support, crucial for grid stability with high renewable energy penetration. Unique selling propositions often lie in the inverter's software capabilities, remote monitoring, predictive maintenance, and cybersecurity features. The trend towards smaller, lighter, and more robust designs for easier installation and maintenance is also a significant advancement.
Key Drivers, Barriers & Challenges in Renewable Energy Inverters Market
Key Drivers: The primary forces propelling the renewable energy inverters market include government initiatives and mandates promoting renewable energy adoption, declining costs of solar panels and wind turbines, and increasing environmental consciousness among consumers and corporations. Technological advancements in inverter efficiency and functionality, along with the growing demand for energy independence and grid stability solutions, are also significant drivers.
Key Barriers & Challenges: Significant challenges include the supply chain disruptions for critical components, fluctuating raw material prices, and the need for standardization and interoperability across different renewable energy systems. Regulatory hurdles and complex permitting processes in certain regions can impede project development. Intense competitive pressures among manufacturers lead to price volatility. Furthermore, the integration of inverters into aging grid infrastructures presents technical challenges, and ensuring robust cybersecurity for connected devices remains a concern.
Emerging Opportunities in Renewable Energy Inverters Market
Emerging opportunities in the renewable energy inverters market lie in the rapidly expanding battery energy storage system (BESS) inverter segment, driven by the increasing need for grid-scale energy storage and residential backup power solutions. The development of advanced smart grid inverters with sophisticated control algorithms and communication capabilities presents a significant avenue for growth. Furthermore, untapped markets in developing economies with growing energy demands and supportive renewable energy policies offer substantial potential. Innovative applications such as microgrid integration and vehicle-to-grid (V2G) technology are also poised to drive future inverter demand.
Growth Accelerators in the Renewable Energy Inverters Market Industry
Key catalysts driving long-term growth in the renewable energy inverters market include breakthroughs in power electronics technology leading to higher conversion efficiencies and reduced costs. Strategic partnerships between inverter manufacturers, solar panel suppliers, and battery storage providers are accelerating integrated system development. Market expansion strategies focusing on emerging economies with vast renewable energy potential, coupled with continuous innovation in grid integration and energy management software, will further solidify the growth trajectory of the industry. The increasing adoption of distributed energy resources and the growing demand for reliable and resilient power systems are powerful growth accelerators.
Key Players Shaping the Renewable Energy Inverters Market Market
- ABB Ltd
- Delta Energy Systems GmbH
- Huawei Technologies Co Ltd
- Sungrow Power Supply Co Ltd
- Ningbo Ginlong Technologies Co Ltd
- Chint Power Systems Co Ltd
- Eaton Corporation Plc
- Fronius International GmbH
- KACO New Energy GmbH
- SMA Solar Technology AG
Notable Milestones in Renewable Energy Inverters Market Sector
- September 2022: Sineng Electric announced a partnership with Power n Sun for its string PV inverter portfolio in the South African Market, subsequently launching a new generation series of three-phase string inverters (50kW, 120kW, 250kW, and 275kW) targeted at the commercial and industrial segment in South Africa.
In-Depth Renewable Energy Inverters Market Market Outlook
The renewable energy inverters market is set for a period of robust expansion, driven by the global shift towards sustainable energy sources. Growth accelerators include ongoing technological advancements, particularly in grid-forming inverters and hybrid solutions, alongside strategic collaborations that are streamlining the integration of renewable energy systems. Emerging opportunities in developing nations and the increasing demand for energy storage integration will further bolster market potential. The market outlook remains highly positive, with continuous innovation and supportive policy environments paving the way for significant value creation and widespread adoption of inverter technologies across diverse applications.
Renewable Energy Inverters Market Segmentation
-
1. Phase
- 1.1. Single Phase
- 1.2. Three Phase
-
2. Power Rating
- 2.1. Up to 10kW
- 2.2. 11kW to 40kW
- 2.3. 41kW to 80kW
- 2.4. Above 80kW
-
3. End-User
- 3.1. Residential
- 3.2. Commercial & Industrial
- 3.3. Utility
Renewable Energy Inverters Market Segmentation By Geography
- 1. North America
- 2. Asia Pacific
- 3. Europe
- 4. South America
- 5. Middle East and Africa
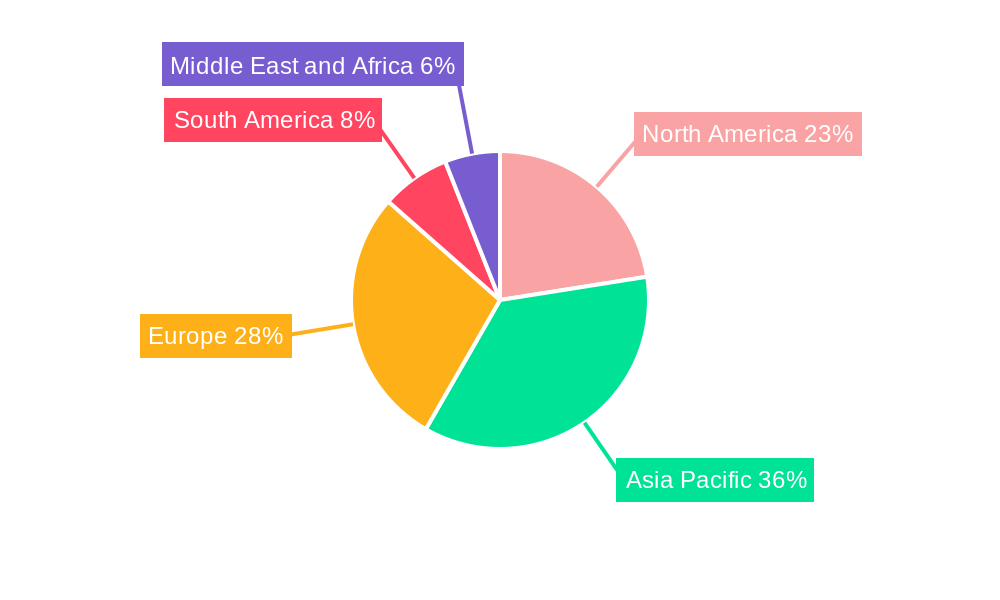
Renewable Energy Inverters Market Regional Market Share
Geographic Coverage of Renewable Energy Inverters Market
Renewable Energy Inverters Market REPORT HIGHLIGHTS
| Aspects | Details |
|---|---|
| Study Period | 2020-2034 |
| Base Year | 2025 |
| Estimated Year | 2026 |
| Forecast Period | 2026-2034 |
| Historical Period | 2020-2025 |
| Growth Rate | CAGR of 14.2% from 2020-2034 |
| Segmentation |
|
Table of Contents
- 1. Introduction
- 1.1. Research Scope
- 1.2. Market Segmentation
- 1.3. Research Objective
- 1.4. Definitions and Assumptions
- 2. Executive Summary
- 2.1. Market Snapshot
- 3. Market Dynamics
- 3.1. Market Drivers
- 3.2. Market Restrains
- 3.3. Market Trends
- 3.4. Market Opportunities
- 4. Market Factor Analysis
- 4.1. Porters Five Forces
- 4.1.1. Bargaining Power of Suppliers
- 4.1.2. Bargaining Power of Buyers
- 4.1.3. Threat of New Entrants
- 4.1.4. Threat of Substitutes
- 4.1.5. Competitive Rivalry
- 4.2. PESTEL analysis
- 4.3. BCG Analysis
- 4.3.1. Stars (High Growth, High Market Share)
- 4.3.2. Cash Cows (Low Growth, High Market Share)
- 4.3.3. Question Mark (High Growth, Low Market Share)
- 4.3.4. Dogs (Low Growth, Low Market Share)
- 4.4. Ansoff Matrix Analysis
- 4.5. Supply Chain Analysis
- 4.6. Regulatory Landscape
- 4.7. Current Market Potential and Opportunity Assessment (TAM–SAM–SOM Framework)
- 4.8. NRP Analyst Note
- 4.1. Porters Five Forces
- 5. Market Analysis, Insights and Forecast 2021-2033
- 5.1. Market Analysis, Insights and Forecast - by Phase
- 5.1.1. Single Phase
- 5.1.2. Three Phase
- 5.2. Market Analysis, Insights and Forecast - by Power Rating
- 5.2.1. Up to 10kW
- 5.2.2. 11kW to 40kW
- 5.2.3. 41kW to 80kW
- 5.2.4. Above 80kW
- 5.3. Market Analysis, Insights and Forecast - by End-User
- 5.3.1. Residential
- 5.3.2. Commercial & Industrial
- 5.3.3. Utility
- 5.4. Market Analysis, Insights and Forecast - by Region
- 5.4.1. North America
- 5.4.2. Asia Pacific
- 5.4.3. Europe
- 5.4.4. South America
- 5.4.5. Middle East and Africa
- 5.1. Market Analysis, Insights and Forecast - by Phase
- 6. Global Renewable Energy Inverters Market Analysis, Insights and Forecast, 2021-2033
- 6.1. Market Analysis, Insights and Forecast - by Phase
- 6.1.1. Single Phase
- 6.1.2. Three Phase
- 6.2. Market Analysis, Insights and Forecast - by Power Rating
- 6.2.1. Up to 10kW
- 6.2.2. 11kW to 40kW
- 6.2.3. 41kW to 80kW
- 6.2.4. Above 80kW
- 6.3. Market Analysis, Insights and Forecast - by End-User
- 6.3.1. Residential
- 6.3.2. Commercial & Industrial
- 6.3.3. Utility
- 6.1. Market Analysis, Insights and Forecast - by Phase
- 7. North America Renewable Energy Inverters Market Analysis, Insights and Forecast, 2020-2032
- 7.1. Market Analysis, Insights and Forecast - by Phase
- 7.1.1. Single Phase
- 7.1.2. Three Phase
- 7.2. Market Analysis, Insights and Forecast - by Power Rating
- 7.2.1. Up to 10kW
- 7.2.2. 11kW to 40kW
- 7.2.3. 41kW to 80kW
- 7.2.4. Above 80kW
- 7.3. Market Analysis, Insights and Forecast - by End-User
- 7.3.1. Residential
- 7.3.2. Commercial & Industrial
- 7.3.3. Utility
- 7.1. Market Analysis, Insights and Forecast - by Phase
- 8. Asia Pacific Renewable Energy Inverters Market Analysis, Insights and Forecast, 2020-2032
- 8.1. Market Analysis, Insights and Forecast - by Phase
- 8.1.1. Single Phase
- 8.1.2. Three Phase
- 8.2. Market Analysis, Insights and Forecast - by Power Rating
- 8.2.1. Up to 10kW
- 8.2.2. 11kW to 40kW
- 8.2.3. 41kW to 80kW
- 8.2.4. Above 80kW
- 8.3. Market Analysis, Insights and Forecast - by End-User
- 8.3.1. Residential
- 8.3.2. Commercial & Industrial
- 8.3.3. Utility
- 8.1. Market Analysis, Insights and Forecast - by Phase
- 9. Europe Renewable Energy Inverters Market Analysis, Insights and Forecast, 2020-2032
- 9.1. Market Analysis, Insights and Forecast - by Phase
- 9.1.1. Single Phase
- 9.1.2. Three Phase
- 9.2. Market Analysis, Insights and Forecast - by Power Rating
- 9.2.1. Up to 10kW
- 9.2.2. 11kW to 40kW
- 9.2.3. 41kW to 80kW
- 9.2.4. Above 80kW
- 9.3. Market Analysis, Insights and Forecast - by End-User
- 9.3.1. Residential
- 9.3.2. Commercial & Industrial
- 9.3.3. Utility
- 9.1. Market Analysis, Insights and Forecast - by Phase
- 10. South America Renewable Energy Inverters Market Analysis, Insights and Forecast, 2020-2032
- 10.1. Market Analysis, Insights and Forecast - by Phase
- 10.1.1. Single Phase
- 10.1.2. Three Phase
- 10.2. Market Analysis, Insights and Forecast - by Power Rating
- 10.2.1. Up to 10kW
- 10.2.2. 11kW to 40kW
- 10.2.3. 41kW to 80kW
- 10.2.4. Above 80kW
- 10.3. Market Analysis, Insights and Forecast - by End-User
- 10.3.1. Residential
- 10.3.2. Commercial & Industrial
- 10.3.3. Utility
- 10.1. Market Analysis, Insights and Forecast - by Phase
- 11. Middle East and Africa Renewable Energy Inverters Market Analysis, Insights and Forecast, 2020-2032
- 11.1. Market Analysis, Insights and Forecast - by Phase
- 11.1.1. Single Phase
- 11.1.2. Three Phase
- 11.2. Market Analysis, Insights and Forecast - by Power Rating
- 11.2.1. Up to 10kW
- 11.2.2. 11kW to 40kW
- 11.2.3. 41kW to 80kW
- 11.2.4. Above 80kW
- 11.3. Market Analysis, Insights and Forecast - by End-User
- 11.3.1. Residential
- 11.3.2. Commercial & Industrial
- 11.3.3. Utility
- 11.1. Market Analysis, Insights and Forecast - by Phase
- 12. Competitive Analysis
- 12.1. Company Profiles
- 12.1.1 ABB Ltd
- 12.1.1.1. Company Overview
- 12.1.1.2. Products
- 12.1.1.3. Company Financials
- 12.1.1.4. SWOT Analysis
- 12.1.2 Delta Energy Systems GmbH
- 12.1.2.1. Company Overview
- 12.1.2.2. Products
- 12.1.2.3. Company Financials
- 12.1.2.4. SWOT Analysis
- 12.1.3 Huawei Technologies Co Ltd
- 12.1.3.1. Company Overview
- 12.1.3.2. Products
- 12.1.3.3. Company Financials
- 12.1.3.4. SWOT Analysis
- 12.1.4 Sungrow Power Supply Co Ltd
- 12.1.4.1. Company Overview
- 12.1.4.2. Products
- 12.1.4.3. Company Financials
- 12.1.4.4. SWOT Analysis
- 12.1.5 Ningbo Ginlong Technologies Co Ltd
- 12.1.5.1. Company Overview
- 12.1.5.2. Products
- 12.1.5.3. Company Financials
- 12.1.5.4. SWOT Analysis
- 12.1.6 Chint Power Systems Co Ltd
- 12.1.6.1. Company Overview
- 12.1.6.2. Products
- 12.1.6.3. Company Financials
- 12.1.6.4. SWOT Analysis
- 12.1.7 Eaton Corporation Plc *List Not Exhaustive
- 12.1.7.1. Company Overview
- 12.1.7.2. Products
- 12.1.7.3. Company Financials
- 12.1.7.4. SWOT Analysis
- 12.1.8 Fronius International GmbH
- 12.1.8.1. Company Overview
- 12.1.8.2. Products
- 12.1.8.3. Company Financials
- 12.1.8.4. SWOT Analysis
- 12.1.9 KACO New Energy GmbH
- 12.1.9.1. Company Overview
- 12.1.9.2. Products
- 12.1.9.3. Company Financials
- 12.1.9.4. SWOT Analysis
- 12.1.10 SMA Solar Technology AG
- 12.1.10.1. Company Overview
- 12.1.10.2. Products
- 12.1.10.3. Company Financials
- 12.1.10.4. SWOT Analysis
- 12.1.1 ABB Ltd
- 12.2. Market Entropy
- 12.2.1 Company's Key Areas Served
- 12.2.2 Recent Developments
- 12.3. Company Market Share Analysis 2025
- 12.3.1 Top 5 Companies Market Share Analysis
- 12.3.2 Top 3 Companies Market Share Analysis
- 12.4. List of Potential Customers
- 13. Research Methodology
List of Figures
- Figure 1: Global Renewable Energy Inverters Market Revenue Breakdown (billion, %) by Region 2025 & 2033
- Figure 2: Global Renewable Energy Inverters Market Volume Breakdown (K Unit, %) by Region 2025 & 2033
- Figure 3: North America Renewable Energy Inverters Market Revenue (billion), by Phase 2025 & 2033
- Figure 4: North America Renewable Energy Inverters Market Volume (K Unit), by Phase 2025 & 2033
- Figure 5: North America Renewable Energy Inverters Market Revenue Share (%), by Phase 2025 & 2033
- Figure 6: North America Renewable Energy Inverters Market Volume Share (%), by Phase 2025 & 2033
- Figure 7: North America Renewable Energy Inverters Market Revenue (billion), by Power Rating 2025 & 2033
- Figure 8: North America Renewable Energy Inverters Market Volume (K Unit), by Power Rating 2025 & 2033
- Figure 9: North America Renewable Energy Inverters Market Revenue Share (%), by Power Rating 2025 & 2033
- Figure 10: North America Renewable Energy Inverters Market Volume Share (%), by Power Rating 2025 & 2033
- Figure 11: North America Renewable Energy Inverters Market Revenue (billion), by End-User 2025 & 2033
- Figure 12: North America Renewable Energy Inverters Market Volume (K Unit), by End-User 2025 & 2033
- Figure 13: North America Renewable Energy Inverters Market Revenue Share (%), by End-User 2025 & 2033
- Figure 14: North America Renewable Energy Inverters Market Volume Share (%), by End-User 2025 & 2033
- Figure 15: North America Renewable Energy Inverters Market Revenue (billion), by Country 2025 & 2033
- Figure 16: North America Renewable Energy Inverters Market Volume (K Unit), by Country 2025 & 2033
- Figure 17: North America Renewable Energy Inverters Market Revenue Share (%), by Country 2025 & 2033
- Figure 18: North America Renewable Energy Inverters Market Volume Share (%), by Country 2025 & 2033
- Figure 19: Asia Pacific Renewable Energy Inverters Market Revenue (billion), by Phase 2025 & 2033
- Figure 20: Asia Pacific Renewable Energy Inverters Market Volume (K Unit), by Phase 2025 & 2033
- Figure 21: Asia Pacific Renewable Energy Inverters Market Revenue Share (%), by Phase 2025 & 2033
- Figure 22: Asia Pacific Renewable Energy Inverters Market Volume Share (%), by Phase 2025 & 2033
- Figure 23: Asia Pacific Renewable Energy Inverters Market Revenue (billion), by Power Rating 2025 & 2033
- Figure 24: Asia Pacific Renewable Energy Inverters Market Volume (K Unit), by Power Rating 2025 & 2033
- Figure 25: Asia Pacific Renewable Energy Inverters Market Revenue Share (%), by Power Rating 2025 & 2033
- Figure 26: Asia Pacific Renewable Energy Inverters Market Volume Share (%), by Power Rating 2025 & 2033
- Figure 27: Asia Pacific Renewable Energy Inverters Market Revenue (billion), by End-User 2025 & 2033
- Figure 28: Asia Pacific Renewable Energy Inverters Market Volume (K Unit), by End-User 2025 & 2033
- Figure 29: Asia Pacific Renewable Energy Inverters Market Revenue Share (%), by End-User 2025 & 2033
- Figure 30: Asia Pacific Renewable Energy Inverters Market Volume Share (%), by End-User 2025 & 2033
- Figure 31: Asia Pacific Renewable Energy Inverters Market Revenue (billion), by Country 2025 & 2033
- Figure 32: Asia Pacific Renewable Energy Inverters Market Volume (K Unit), by Country 2025 & 2033
- Figure 33: Asia Pacific Renewable Energy Inverters Market Revenue Share (%), by Country 2025 & 2033
- Figure 34: Asia Pacific Renewable Energy Inverters Market Volume Share (%), by Country 2025 & 2033
- Figure 35: Europe Renewable Energy Inverters Market Revenue (billion), by Phase 2025 & 2033
- Figure 36: Europe Renewable Energy Inverters Market Volume (K Unit), by Phase 2025 & 2033
- Figure 37: Europe Renewable Energy Inverters Market Revenue Share (%), by Phase 2025 & 2033
- Figure 38: Europe Renewable Energy Inverters Market Volume Share (%), by Phase 2025 & 2033
- Figure 39: Europe Renewable Energy Inverters Market Revenue (billion), by Power Rating 2025 & 2033
- Figure 40: Europe Renewable Energy Inverters Market Volume (K Unit), by Power Rating 2025 & 2033
- Figure 41: Europe Renewable Energy Inverters Market Revenue Share (%), by Power Rating 2025 & 2033
- Figure 42: Europe Renewable Energy Inverters Market Volume Share (%), by Power Rating 2025 & 2033
- Figure 43: Europe Renewable Energy Inverters Market Revenue (billion), by End-User 2025 & 2033
- Figure 44: Europe Renewable Energy Inverters Market Volume (K Unit), by End-User 2025 & 2033
- Figure 45: Europe Renewable Energy Inverters Market Revenue Share (%), by End-User 2025 & 2033
- Figure 46: Europe Renewable Energy Inverters Market Volume Share (%), by End-User 2025 & 2033
- Figure 47: Europe Renewable Energy Inverters Market Revenue (billion), by Country 2025 & 2033
- Figure 48: Europe Renewable Energy Inverters Market Volume (K Unit), by Country 2025 & 2033
- Figure 49: Europe Renewable Energy Inverters Market Revenue Share (%), by Country 2025 & 2033
- Figure 50: Europe Renewable Energy Inverters Market Volume Share (%), by Country 2025 & 2033
- Figure 51: South America Renewable Energy Inverters Market Revenue (billion), by Phase 2025 & 2033
- Figure 52: South America Renewable Energy Inverters Market Volume (K Unit), by Phase 2025 & 2033
- Figure 53: South America Renewable Energy Inverters Market Revenue Share (%), by Phase 2025 & 2033
- Figure 54: South America Renewable Energy Inverters Market Volume Share (%), by Phase 2025 & 2033
- Figure 55: South America Renewable Energy Inverters Market Revenue (billion), by Power Rating 2025 & 2033
- Figure 56: South America Renewable Energy Inverters Market Volume (K Unit), by Power Rating 2025 & 2033
- Figure 57: South America Renewable Energy Inverters Market Revenue Share (%), by Power Rating 2025 & 2033
- Figure 58: South America Renewable Energy Inverters Market Volume Share (%), by Power Rating 2025 & 2033
- Figure 59: South America Renewable Energy Inverters Market Revenue (billion), by End-User 2025 & 2033
- Figure 60: South America Renewable Energy Inverters Market Volume (K Unit), by End-User 2025 & 2033
- Figure 61: South America Renewable Energy Inverters Market Revenue Share (%), by End-User 2025 & 2033
- Figure 62: South America Renewable Energy Inverters Market Volume Share (%), by End-User 2025 & 2033
- Figure 63: South America Renewable Energy Inverters Market Revenue (billion), by Country 2025 & 2033
- Figure 64: South America Renewable Energy Inverters Market Volume (K Unit), by Country 2025 & 2033
- Figure 65: South America Renewable Energy Inverters Market Revenue Share (%), by Country 2025 & 2033
- Figure 66: South America Renewable Energy Inverters Market Volume Share (%), by Country 2025 & 2033
- Figure 67: Middle East and Africa Renewable Energy Inverters Market Revenue (billion), by Phase 2025 & 2033
- Figure 68: Middle East and Africa Renewable Energy Inverters Market Volume (K Unit), by Phase 2025 & 2033
- Figure 69: Middle East and Africa Renewable Energy Inverters Market Revenue Share (%), by Phase 2025 & 2033
- Figure 70: Middle East and Africa Renewable Energy Inverters Market Volume Share (%), by Phase 2025 & 2033
- Figure 71: Middle East and Africa Renewable Energy Inverters Market Revenue (billion), by Power Rating 2025 & 2033
- Figure 72: Middle East and Africa Renewable Energy Inverters Market Volume (K Unit), by Power Rating 2025 & 2033
- Figure 73: Middle East and Africa Renewable Energy Inverters Market Revenue Share (%), by Power Rating 2025 & 2033
- Figure 74: Middle East and Africa Renewable Energy Inverters Market Volume Share (%), by Power Rating 2025 & 2033
- Figure 75: Middle East and Africa Renewable Energy Inverters Market Revenue (billion), by End-User 2025 & 2033
- Figure 76: Middle East and Africa Renewable Energy Inverters Market Volume (K Unit), by End-User 2025 & 2033
- Figure 77: Middle East and Africa Renewable Energy Inverters Market Revenue Share (%), by End-User 2025 & 2033
- Figure 78: Middle East and Africa Renewable Energy Inverters Market Volume Share (%), by End-User 2025 & 2033
- Figure 79: Middle East and Africa Renewable Energy Inverters Market Revenue (billion), by Country 2025 & 2033
- Figure 80: Middle East and Africa Renewable Energy Inverters Market Volume (K Unit), by Country 2025 & 2033
- Figure 81: Middle East and Africa Renewable Energy Inverters Market Revenue Share (%), by Country 2025 & 2033
- Figure 82: Middle East and Africa Renewable Energy Inverters Market Volume Share (%), by Country 2025 & 2033
List of Tables
- Table 1: Global Renewable Energy Inverters Market Revenue billion Forecast, by Phase 2020 & 2033
- Table 2: Global Renewable Energy Inverters Market Volume K Unit Forecast, by Phase 2020 & 2033
- Table 3: Global Renewable Energy Inverters Market Revenue billion Forecast, by Power Rating 2020 & 2033
- Table 4: Global Renewable Energy Inverters Market Volume K Unit Forecast, by Power Rating 2020 & 2033
- Table 5: Global Renewable Energy Inverters Market Revenue billion Forecast, by End-User 2020 & 2033
- Table 6: Global Renewable Energy Inverters Market Volume K Unit Forecast, by End-User 2020 & 2033
- Table 7: Global Renewable Energy Inverters Market Revenue billion Forecast, by Region 2020 & 2033
- Table 8: Global Renewable Energy Inverters Market Volume K Unit Forecast, by Region 2020 & 2033
- Table 9: Global Renewable Energy Inverters Market Revenue billion Forecast, by Phase 2020 & 2033
- Table 10: Global Renewable Energy Inverters Market Volume K Unit Forecast, by Phase 2020 & 2033
- Table 11: Global Renewable Energy Inverters Market Revenue billion Forecast, by Power Rating 2020 & 2033
- Table 12: Global Renewable Energy Inverters Market Volume K Unit Forecast, by Power Rating 2020 & 2033
- Table 13: Global Renewable Energy Inverters Market Revenue billion Forecast, by End-User 2020 & 2033
- Table 14: Global Renewable Energy Inverters Market Volume K Unit Forecast, by End-User 2020 & 2033
- Table 15: Global Renewable Energy Inverters Market Revenue billion Forecast, by Country 2020 & 2033
- Table 16: Global Renewable Energy Inverters Market Volume K Unit Forecast, by Country 2020 & 2033
- Table 17: Global Renewable Energy Inverters Market Revenue billion Forecast, by Phase 2020 & 2033
- Table 18: Global Renewable Energy Inverters Market Volume K Unit Forecast, by Phase 2020 & 2033
- Table 19: Global Renewable Energy Inverters Market Revenue billion Forecast, by Power Rating 2020 & 2033
- Table 20: Global Renewable Energy Inverters Market Volume K Unit Forecast, by Power Rating 2020 & 2033
- Table 21: Global Renewable Energy Inverters Market Revenue billion Forecast, by End-User 2020 & 2033
- Table 22: Global Renewable Energy Inverters Market Volume K Unit Forecast, by End-User 2020 & 2033
- Table 23: Global Renewable Energy Inverters Market Revenue billion Forecast, by Country 2020 & 2033
- Table 24: Global Renewable Energy Inverters Market Volume K Unit Forecast, by Country 2020 & 2033
- Table 25: Global Renewable Energy Inverters Market Revenue billion Forecast, by Phase 2020 & 2033
- Table 26: Global Renewable Energy Inverters Market Volume K Unit Forecast, by Phase 2020 & 2033
- Table 27: Global Renewable Energy Inverters Market Revenue billion Forecast, by Power Rating 2020 & 2033
- Table 28: Global Renewable Energy Inverters Market Volume K Unit Forecast, by Power Rating 2020 & 2033
- Table 29: Global Renewable Energy Inverters Market Revenue billion Forecast, by End-User 2020 & 2033
- Table 30: Global Renewable Energy Inverters Market Volume K Unit Forecast, by End-User 2020 & 2033
- Table 31: Global Renewable Energy Inverters Market Revenue billion Forecast, by Country 2020 & 2033
- Table 32: Global Renewable Energy Inverters Market Volume K Unit Forecast, by Country 2020 & 2033
- Table 33: Global Renewable Energy Inverters Market Revenue billion Forecast, by Phase 2020 & 2033
- Table 34: Global Renewable Energy Inverters Market Volume K Unit Forecast, by Phase 2020 & 2033
- Table 35: Global Renewable Energy Inverters Market Revenue billion Forecast, by Power Rating 2020 & 2033
- Table 36: Global Renewable Energy Inverters Market Volume K Unit Forecast, by Power Rating 2020 & 2033
- Table 37: Global Renewable Energy Inverters Market Revenue billion Forecast, by End-User 2020 & 2033
- Table 38: Global Renewable Energy Inverters Market Volume K Unit Forecast, by End-User 2020 & 2033
- Table 39: Global Renewable Energy Inverters Market Revenue billion Forecast, by Country 2020 & 2033
- Table 40: Global Renewable Energy Inverters Market Volume K Unit Forecast, by Country 2020 & 2033
- Table 41: Global Renewable Energy Inverters Market Revenue billion Forecast, by Phase 2020 & 2033
- Table 42: Global Renewable Energy Inverters Market Volume K Unit Forecast, by Phase 2020 & 2033
- Table 43: Global Renewable Energy Inverters Market Revenue billion Forecast, by Power Rating 2020 & 2033
- Table 44: Global Renewable Energy Inverters Market Volume K Unit Forecast, by Power Rating 2020 & 2033
- Table 45: Global Renewable Energy Inverters Market Revenue billion Forecast, by End-User 2020 & 2033
- Table 46: Global Renewable Energy Inverters Market Volume K Unit Forecast, by End-User 2020 & 2033
- Table 47: Global Renewable Energy Inverters Market Revenue billion Forecast, by Country 2020 & 2033
- Table 48: Global Renewable Energy Inverters Market Volume K Unit Forecast, by Country 2020 & 2033
Frequently Asked Questions
1. What is the projected Compound Annual Growth Rate (CAGR) of the Renewable Energy Inverters Market?
The projected CAGR is approximately 14.2%.
2. Which companies are prominent players in the Renewable Energy Inverters Market?
Key companies in the market include ABB Ltd, Delta Energy Systems GmbH, Huawei Technologies Co Ltd, Sungrow Power Supply Co Ltd, Ningbo Ginlong Technologies Co Ltd, Chint Power Systems Co Ltd, Eaton Corporation Plc *List Not Exhaustive, Fronius International GmbH, KACO New Energy GmbH, SMA Solar Technology AG.
3. What are the main segments of the Renewable Energy Inverters Market?
The market segments include Phase, Power Rating, End-User.
4. Can you provide details about the market size?
The market size is estimated to be USD 11.8 billion as of 2022.
5. What are some drivers contributing to market growth?
4.; Increasing Sales of Automobiles4.; Growing Adoption of Battery Energy Storage Systems (BESS).
6. What are the notable trends driving market growth?
Utility Segment Likely to Witness Significant Growth.
7. Are there any restraints impacting market growth?
4.; Rising Emphasis on Lithium-Ion Batteries.
8. Can you provide examples of recent developments in the market?
September 2022: Sineng Electric has announced that it is partnering with Power n Sun for its portfolio of string PV inverters in the South Africa Market. Sineng launched their new generation series of three-phase string inverters of varying focused on the commercial and industrial segment of the South Africa Market. The string inverters' capacities are 50kW, 120kW, 250kW, and 275kW, respectively.
9. What pricing options are available for accessing the report?
Pricing options include single-user, multi-user, and enterprise licenses priced at USD 4750, USD 5250, and USD 8750 respectively.
10. Is the market size provided in terms of value or volume?
The market size is provided in terms of value, measured in billion and volume, measured in K Unit.
11. Are there any specific market keywords associated with the report?
Yes, the market keyword associated with the report is "Renewable Energy Inverters Market," which aids in identifying and referencing the specific market segment covered.
12. How do I determine which pricing option suits my needs best?
The pricing options vary based on user requirements and access needs. Individual users may opt for single-user licenses, while businesses requiring broader access may choose multi-user or enterprise licenses for cost-effective access to the report.
13. Are there any additional resources or data provided in the Renewable Energy Inverters Market report?
While the report offers comprehensive insights, it's advisable to review the specific contents or supplementary materials provided to ascertain if additional resources or data are available.
14. How can I stay updated on further developments or reports in the Renewable Energy Inverters Market?
To stay informed about further developments, trends, and reports in the Renewable Energy Inverters Market, consider subscribing to industry newsletters, following relevant companies and organizations, or regularly checking reputable industry news sources and publications.
Methodology
Step 1 - Identification of Relevant Samples Size from Population Database


Step 2 - Approaches for Defining Global Market Size (Value, Volume* & Price*)

Note*: In applicable scenarios
Step 3 - Data Sources
Primary Research
- Web Analytics
- Survey Reports
- Research Institute
- Latest Research Reports
- Opinion Leaders
Secondary Research
- Annual Reports
- White Paper
- Latest Press Release
- Industry Association
- Paid Database
- Investor Presentations

Step 4 - Data Triangulation
Involves using different sources of information in order to increase the validity of a study
These sources are likely to be stakeholders in a program - participants, other researchers, program staff, other community members, and so on.
Then we put all data in single framework & apply various statistical tools to find out the dynamic on the market.
During the analysis stage, feedback from the stakeholder groups would be compared to determine areas of agreement as well as areas of divergence