

Key Insights
The global Residential PV Energy Storage Inverter market is poised for significant expansion, projected to reach a market size of $445 million by 2025, driven by a remarkable Compound Annual Growth Rate (CAGR) of 25.9% throughout the forecast period of 2025-2033. This robust growth is primarily fueled by the increasing adoption of solar photovoltaic (PV) systems in residential settings, coupled with a growing consumer demand for reliable and efficient energy storage solutions. As governments worldwide implement supportive policies and incentives for renewable energy integration, homeowners are increasingly investing in battery storage systems to enhance energy independence, reduce electricity bills, and provide backup power during grid outages. The market is also benefiting from advancements in inverter technology, leading to more efficient, cost-effective, and user-friendly products. Key market drivers include the rising cost of traditional electricity, growing environmental consciousness, and the desire for grid resilience.
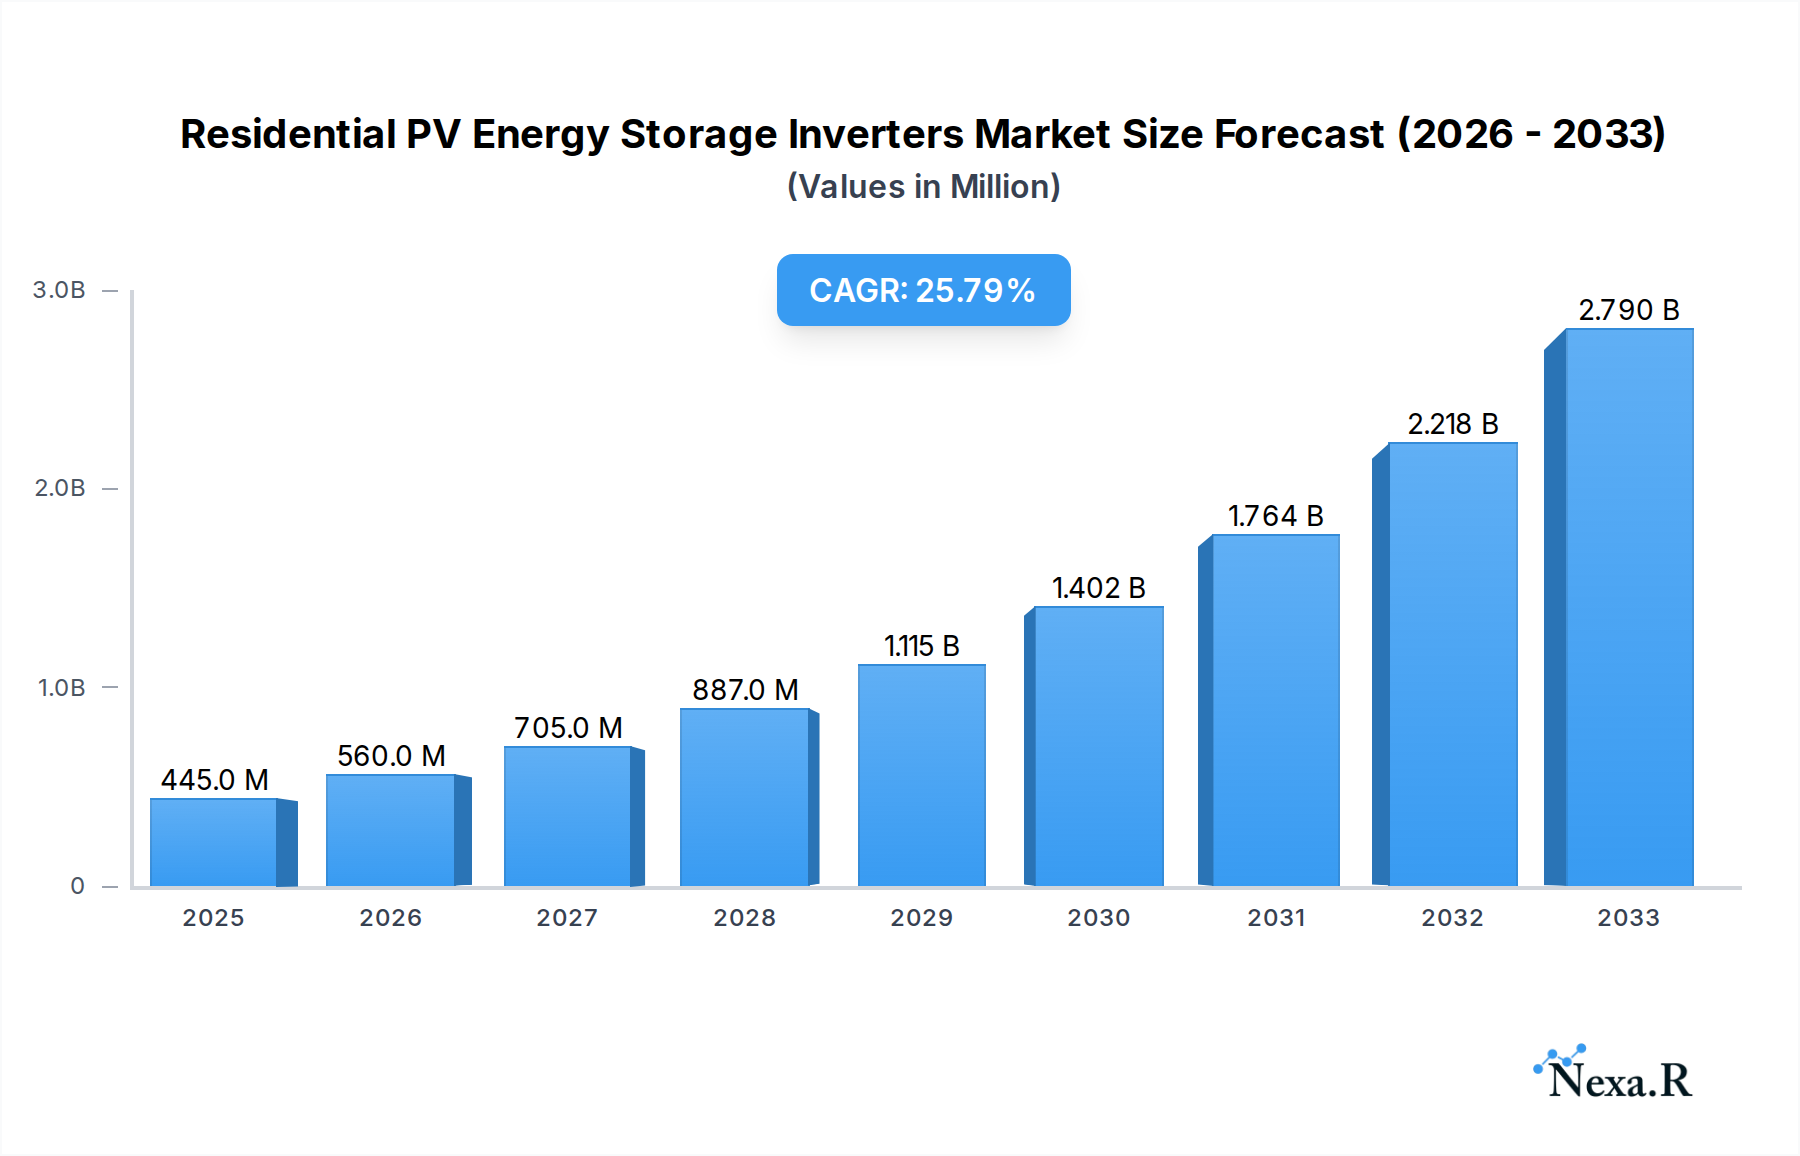
Residential PV Energy Storage Inverters Market Size (In Million)
The market's trajectory is further shaped by distinct trends and segments. The High Voltage Energy Storage segment is expected to witness substantial growth due to its suitability for larger solar installations and higher energy demands in residential properties. Conversely, the Low Voltage Energy Storage segment will continue to cater to smaller systems and specific consumer needs. In terms of product types, Outdoor Type inverters are gaining traction due to their space-saving benefits and ease of installation, while Indoor Type inverters offer a more discreet and protected solution. Despite the positive outlook, certain restraints, such as the initial high cost of battery storage systems and complexities in grid integration for some regions, may present challenges. However, ongoing technological innovations and decreasing component costs are steadily mitigating these barriers, paving the way for widespread adoption. Leading companies like Tesla, Sonnen, BYD, and LG Energy are at the forefront, continuously innovating to capture market share and meet the evolving demands of this dynamic sector.

Residential PV Energy Storage Inverters Company Market Share
Residential PV Energy Storage Inverters: Comprehensive Market Analysis & Future Outlook (2019-2033)
This in-depth report provides a definitive analysis of the global Residential PV Energy Storage Inverters market, encompassing historical performance, current dynamics, and future projections. Designed for industry professionals, investors, and policymakers, this report offers actionable insights into market segmentation, technological advancements, competitive landscapes, and growth catalysts. We cover parent and child markets, leveraging high-traffic keywords to ensure maximum search engine visibility. All quantitative data is presented in million units for clarity and ease of comparison.
Residential PV Energy Storage Inverters Market Dynamics & Structure
The Residential PV Energy Storage Inverters market is characterized by a moderately concentrated structure, with key players like Tesla, Sonnen, BYD, LG Energy, and Enphase Energy holding significant market shares. Technological innovation remains a primary driver, fueled by advancements in battery chemistry, inverter efficiency, and smart grid integration. Regulatory frameworks worldwide are increasingly supportive, incentivizing renewable energy adoption and energy storage solutions. Competitive product substitutes, while present in the form of standalone solar systems or grid-only solutions, are rapidly losing ground to integrated PV energy storage systems. End-user demographics are shifting towards environmentally conscious homeowners seeking energy independence, cost savings, and grid resilience. Mergers and acquisitions (M&A) are an active trend, as larger companies acquire innovative startups to expand their product portfolios and market reach.
- Market Concentration: Dominated by a few key players, with an increasing number of new entrants.
- Technological Innovation: Driven by lithium-ion battery improvements, enhanced power conversion efficiencies, and AI-powered energy management systems.
- Regulatory Frameworks: Government incentives, net metering policies, and renewable portfolio standards are significant drivers.
- Competitive Landscape: Growing demand for integrated solutions reduces the viability of standalone PV systems.
- End-User Demographics: Homeowners seeking energy cost reduction, backup power, and a reduced carbon footprint.
- M&A Trends: Consolidation and strategic partnerships to gain market share and technological edge. Estimated M&A deal volumes are projected to increase by 15% over the forecast period.
Residential PV Energy Storage Inverters Growth Trends & Insights
The global Residential PV Energy Storage Inverters market is poised for robust expansion, driven by increasing solar PV installations, declining battery costs, and growing awareness of energy security. The market size is estimated to reach approximately $35,000 million units by 2025 and is projected to grow at a Compound Annual Growth Rate (CAGR) of 12.5% from 2025 to 2033. Adoption rates are accelerating as homeowners recognize the economic and environmental benefits of self-consumption and peak-shaving capabilities. Technological disruptions, such as advancements in hybrid inverters and the integration of electric vehicle (EV) charging capabilities, are further enhancing the appeal of these systems. Consumer behavior is shifting towards greater demand for smart home integration and energy management solutions, with a willingness to invest in systems that offer long-term cost savings and environmental benefits. The increasing penetration of smart grids and the growing need for grid stabilization are also significant factors contributing to market growth.
- Market Size Evolution: From an estimated $30,000 million units in 2024, the market is projected to reach $75,000 million units by 2033.
- Adoption Rates: Experiencing a significant surge, particularly in regions with high electricity prices and favorable solar policies.
- Technological Disruptions: Hybrid inverters, bidirectional charging, and advanced battery management systems are reshaping the market.
- Consumer Behavior Shifts: Growing preference for energy independence, self-sufficiency, and a desire to contribute to a sustainable future.
- Market Penetration: Expected to increase from xx% in 2025 to an estimated 35% by 2033 in key developed markets.
- CAGR (2025-2033): Projected at 12.5%.
Dominant Regions, Countries, or Segments in Residential PV Energy Storage Inverters
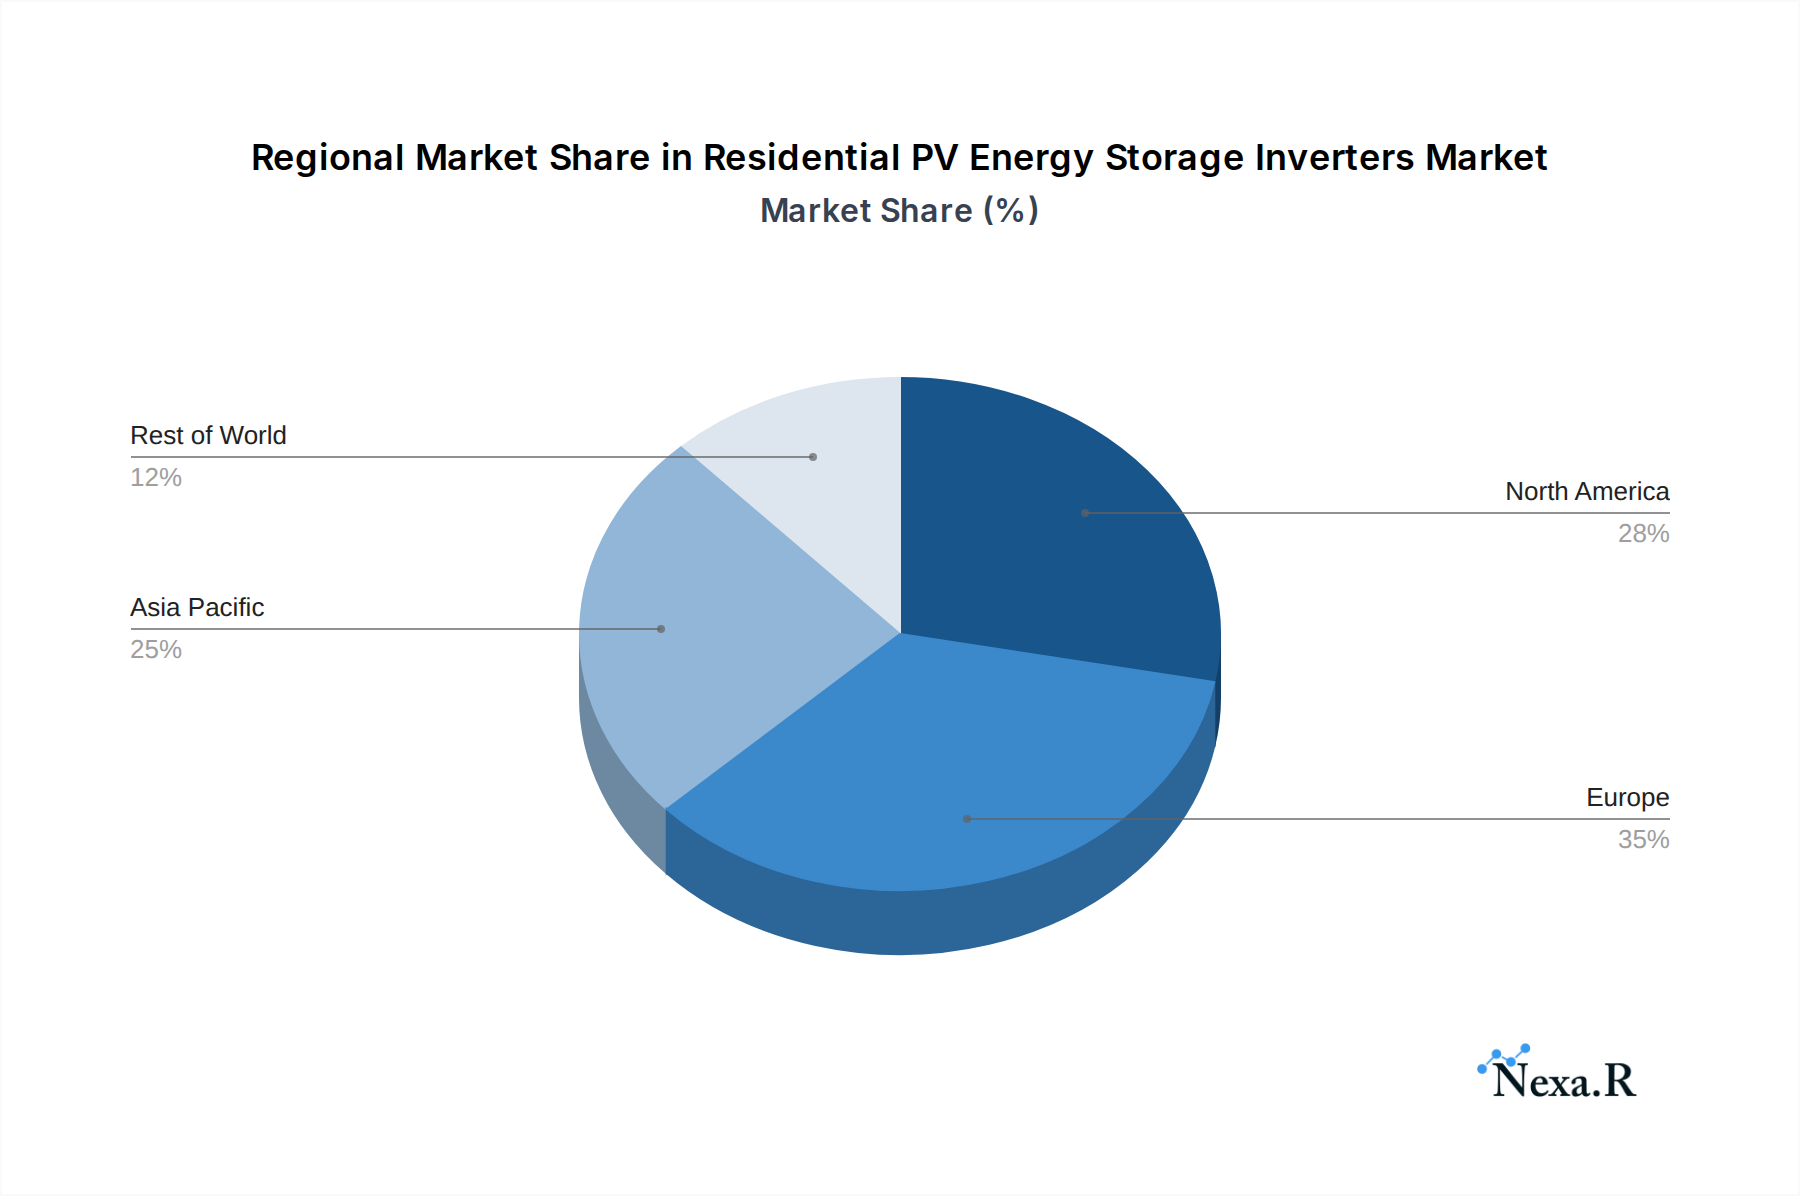
North America, particularly the United States, currently leads the Residential PV Energy Storage Inverters market, driven by strong government incentives, high electricity prices, and a mature solar PV installation base. Europe, with countries like Germany and Australia leading the charge, is another dominant region due to its ambitious renewable energy targets and supportive policies for energy storage. The Asia-Pacific region, especially China and Japan, is emerging as a significant growth engine, fueled by rapid urbanization, increasing disposable incomes, and a growing focus on energy independence.
Among the application segments, Low Voltage Energy Storage dominates the market, catering to the vast majority of residential installations due to its cost-effectiveness and ease of integration. However, High Voltage Energy Storage is witnessing accelerated growth, driven by larger homes, higher energy consumption patterns, and the increasing demand for longer backup durations.
In terms of types, Outdoor Type inverters are gaining traction due to their space-saving designs and enhanced thermal management capabilities, making them ideal for various climate conditions. Indoor Type inverters remain popular in regions with extreme weather conditions or where aesthetics are a primary concern.
- Leading Region: North America (USA)
- Key Drivers: Federal tax credits, state-level incentives, high retail electricity rates, and robust demand for energy resilience.
- Market Share: Estimated at 30% in 2025.
- Emerging Growth Region: Asia-Pacific (China, Japan)
- Key Drivers: Government mandates for renewable energy, decreasing manufacturing costs, and a growing middle class.
- Growth Potential: Projected CAGR of 15% from 2025-2033.
- Dominant Application Segment: Low Voltage Energy Storage
- Drivers: Lower upfront cost, broader compatibility with existing PV systems, and wider availability of battery solutions.
- Market Share: Estimated at 70% in 2025.
- High-Growth Application Segment: High Voltage Energy Storage
- Drivers: Increasing demand for extended backup power, integration with smart grids, and larger residential energy needs.
- Dominant Type: Outdoor Type
- Drivers: Space efficiency, improved heat dissipation, and suitability for diverse installation environments.
- Growing Type: Indoor Type
- Drivers: Aesthetic considerations, protection from extreme weather, and integration within smart home ecosystems.
Residential PV Energy Storage Inverters Product Landscape
The product landscape for Residential PV Energy Storage Inverters is characterized by rapid innovation focused on increasing efficiency, reliability, and intelligence. Manufacturers are developing hybrid inverters that seamlessly combine solar generation and battery storage into a single unit, simplifying installation and reducing costs. Advanced Maximum Power Point Tracking (MPPT) algorithms ensure optimal energy harvest from solar panels, even under varying weather conditions. The integration of smart grid communication protocols allows these inverters to participate in demand response programs and provide grid services. Key product innovations include enhanced cybersecurity features to protect against external threats and user-friendly mobile applications for real-time monitoring and control. Products from companies like Enphase Energy, Tesla, and Sonnen are at the forefront, offering integrated solutions with high energy densities and extended lifecycles.
Key Drivers, Barriers & Challenges in Residential PV Energy Storage Inverters
The Residential PV Energy Storage Inverters market is propelled by several key drivers:
- Technological Advancements: Continued improvements in battery technology, inverter efficiency, and smart grid integration.
- Falling Battery Costs: Decreasing prices of lithium-ion batteries make energy storage more economically viable for homeowners.
- Government Policies & Incentives: Subsidies, tax credits, and favorable net metering policies encourage adoption.
- Energy Security & Resilience: Growing demand for backup power due to grid instability and extreme weather events.
- Environmental Consciousness: Increasing consumer desire to reduce carbon footprints and embrace sustainable energy solutions.
However, significant barriers and challenges persist:
- High Upfront Costs: Despite falling prices, the initial investment for PV energy storage systems remains a hurdle for some consumers.
- Complex Regulatory Landscapes: Varying and sometimes inconsistent regulations across different regions can slow down market penetration.
- Grid Interconnection Challenges: Complicated and time-consuming processes for connecting systems to the local grid.
- Supply Chain Disruptions: Global shortages of key components, particularly semiconductors and battery materials, can impact production and pricing. Estimated impact on production capacity is a reduction of 5-10% in 2025.
- Consumer Education & Awareness: A need for greater public understanding of the benefits and complexities of energy storage systems.
Emerging Opportunities in Residential PV Energy Storage Inverters
Emerging opportunities in the Residential PV Energy Storage Inverters sector are abundant, driven by evolving consumer needs and technological advancements. The growing demand for Vehicle-to-Grid (V2G) and Vehicle-to-Home (V2H) capabilities presents a significant untapped market, allowing homeowners to leverage their electric vehicles as mobile energy storage units. Furthermore, the integration of AI and machine learning for predictive energy management, optimizing self-consumption and grid interaction, offers a substantial value proposition. The development of modular and scalable energy storage solutions that can be easily upgraded or expanded will cater to a broader range of household energy requirements. There is also a growing opportunity in providing Virtual Power Plant (VPP) services, aggregating residential storage systems to support grid stability and generate revenue streams for homeowners.
Growth Accelerators in the Residential PV Energy Storage Inverters Industry
Several catalysts are accelerating long-term growth in the Residential PV Energy Storage Inverters industry. Technological breakthroughs in solid-state batteries promise higher energy density, enhanced safety, and faster charging times, which will significantly boost performance and adoption. Strategic partnerships between inverter manufacturers, battery producers, and utility companies are crucial for developing integrated solutions and expanding market reach. The ongoing digitalization of the energy sector, leading to more sophisticated smart home energy management systems, will further drive demand for intelligent inverters. Market expansion into developing economies, coupled with supportive government initiatives and infrastructure development, will unlock new avenues for growth.
Key Players Shaping the Residential PV Energy Storage Inverters Market
- Tesla
- Sonnen
- BYD
- LG Energy
- Enphase Energy
- Panasonic
- GOODWE
- Growatt
- Huawei
- PYLONTECH
- Deye Technology
- SUNGROW
- SOFAR
- Ginlong Technologies
- SolaX Power
- Megarevo
Notable Milestones in Residential PV Energy Storage Inverters Sector
- 2019/03: Tesla launches Powerwall 2 with enhanced capacity and integration features.
- 2020/07: Enphase Energy introduces its IQ System, integrating microinverters and battery storage for seamless home energy management.
- 2021/01: Sonnen acquires its US distributor, expanding its direct market presence.
- 2021/09: BYD announces significant investments in battery manufacturing capacity to meet growing demand.
- 2022/04: Huawei launches its LUNA2000 residential battery system with modular design and advanced safety features.
- 2023/02: LG Energy Solution announces expansion of its residential ESS production facilities.
- 2023/11: GOODWE introduces a new generation of hybrid inverters with AI-driven optimization.
- 2024/05: PYLONTECH reveals plans for a new gigafactory focused on residential energy storage solutions.
In-Depth Residential PV Energy Storage Inverters Market Outlook
The future of the Residential PV Energy Storage Inverters market is exceptionally bright, fueled by ongoing technological advancements and a global push towards decarbonization. Growth accelerators will include the maturation of V2G and V2H technologies, leading to more integrated and versatile home energy solutions. Strategic partnerships will foster greater interoperability and streamline the customer experience, while digitalization will enable sophisticated grid services from residential assets. Expansion into emerging markets, supported by government mandates and infrastructure improvements, will create significant new demand. The market is poised for sustained growth, offering substantial opportunities for innovation and investment as homeowners increasingly seek energy independence, cost savings, and a sustainable future.
Residential PV Energy Storage Inverters Segmentation
-
1. Application
- 1.1. High Voltage Energy Storage
- 1.2. Low Voltage Energy Storage
-
2. Types
- 2.1. Outdoor Type
- 2.2. Indoor Type
Residential PV Energy Storage Inverters Segmentation By Geography
-
1. North America
- 1.1. United States
- 1.2. Canada
- 1.3. Mexico
-
2. South America
- 2.1. Brazil
- 2.2. Argentina
- 2.3. Rest of South America
-
3. Europe
- 3.1. United Kingdom
- 3.2. Germany
- 3.3. France
- 3.4. Italy
- 3.5. Spain
- 3.6. Russia
- 3.7. Benelux
- 3.8. Nordics
- 3.9. Rest of Europe
-
4. Middle East & Africa
- 4.1. Turkey
- 4.2. Israel
- 4.3. GCC
- 4.4. North Africa
- 4.5. South Africa
- 4.6. Rest of Middle East & Africa
-
5. Asia Pacific
- 5.1. China
- 5.2. India
- 5.3. Japan
- 5.4. South Korea
- 5.5. ASEAN
- 5.6. Oceania
- 5.7. Rest of Asia Pacific
Residential PV Energy Storage Inverters Regional Market Share
Geographic Coverage of Residential PV Energy Storage Inverters
Residential PV Energy Storage Inverters REPORT HIGHLIGHTS
| Aspects | Details |
|---|---|
| Study Period | 2020-2034 |
| Base Year | 2025 |
| Estimated Year | 2026 |
| Forecast Period | 2026-2034 |
| Historical Period | 2020-2025 |
| Growth Rate | CAGR of 25.9% from 2020-2034 |
| Segmentation |
|
Table of Contents
- 1. Introduction
- 1.1. Research Scope
- 1.2. Market Segmentation
- 1.3. Research Objective
- 1.4. Definitions and Assumptions
- 2. Executive Summary
- 2.1. Market Snapshot
- 3. Market Dynamics
- 3.1. Market Drivers
- 3.2. Market Restrains
- 3.3. Market Trends
- 3.4. Market Opportunities
- 4. Market Factor Analysis
- 4.1. Porters Five Forces
- 4.1.1. Bargaining Power of Suppliers
- 4.1.2. Bargaining Power of Buyers
- 4.1.3. Threat of New Entrants
- 4.1.4. Threat of Substitutes
- 4.1.5. Competitive Rivalry
- 4.2. PESTEL analysis
- 4.3. BCG Analysis
- 4.3.1. Stars (High Growth, High Market Share)
- 4.3.2. Cash Cows (Low Growth, High Market Share)
- 4.3.3. Question Mark (High Growth, Low Market Share)
- 4.3.4. Dogs (Low Growth, Low Market Share)
- 4.4. Ansoff Matrix Analysis
- 4.5. Supply Chain Analysis
- 4.6. Regulatory Landscape
- 4.7. Current Market Potential and Opportunity Assessment (TAM–SAM–SOM Framework)
- 4.8. NRP Analyst Note
- 4.1. Porters Five Forces
- 5. Market Analysis, Insights and Forecast 2021-2033
- 5.1. Market Analysis, Insights and Forecast - by Application
- 5.1.1. High Voltage Energy Storage
- 5.1.2. Low Voltage Energy Storage
- 5.2. Market Analysis, Insights and Forecast - by Types
- 5.2.1. Outdoor Type
- 5.2.2. Indoor Type
- 5.3. Market Analysis, Insights and Forecast - by Region
- 5.3.1. North America
- 5.3.2. South America
- 5.3.3. Europe
- 5.3.4. Middle East & Africa
- 5.3.5. Asia Pacific
- 5.1. Market Analysis, Insights and Forecast - by Application
- 6. Global Residential PV Energy Storage Inverters Analysis, Insights and Forecast, 2021-2033
- 6.1. Market Analysis, Insights and Forecast - by Application
- 6.1.1. High Voltage Energy Storage
- 6.1.2. Low Voltage Energy Storage
- 6.2. Market Analysis, Insights and Forecast - by Types
- 6.2.1. Outdoor Type
- 6.2.2. Indoor Type
- 6.1. Market Analysis, Insights and Forecast - by Application
- 7. North America Residential PV Energy Storage Inverters Analysis, Insights and Forecast, 2020-2032
- 7.1. Market Analysis, Insights and Forecast - by Application
- 7.1.1. High Voltage Energy Storage
- 7.1.2. Low Voltage Energy Storage
- 7.2. Market Analysis, Insights and Forecast - by Types
- 7.2.1. Outdoor Type
- 7.2.2. Indoor Type
- 7.1. Market Analysis, Insights and Forecast - by Application
- 8. South America Residential PV Energy Storage Inverters Analysis, Insights and Forecast, 2020-2032
- 8.1. Market Analysis, Insights and Forecast - by Application
- 8.1.1. High Voltage Energy Storage
- 8.1.2. Low Voltage Energy Storage
- 8.2. Market Analysis, Insights and Forecast - by Types
- 8.2.1. Outdoor Type
- 8.2.2. Indoor Type
- 8.1. Market Analysis, Insights and Forecast - by Application
- 9. Europe Residential PV Energy Storage Inverters Analysis, Insights and Forecast, 2020-2032
- 9.1. Market Analysis, Insights and Forecast - by Application
- 9.1.1. High Voltage Energy Storage
- 9.1.2. Low Voltage Energy Storage
- 9.2. Market Analysis, Insights and Forecast - by Types
- 9.2.1. Outdoor Type
- 9.2.2. Indoor Type
- 9.1. Market Analysis, Insights and Forecast - by Application
- 10. Middle East & Africa Residential PV Energy Storage Inverters Analysis, Insights and Forecast, 2020-2032
- 10.1. Market Analysis, Insights and Forecast - by Application
- 10.1.1. High Voltage Energy Storage
- 10.1.2. Low Voltage Energy Storage
- 10.2. Market Analysis, Insights and Forecast - by Types
- 10.2.1. Outdoor Type
- 10.2.2. Indoor Type
- 10.1. Market Analysis, Insights and Forecast - by Application
- 11. Asia Pacific Residential PV Energy Storage Inverters Analysis, Insights and Forecast, 2020-2032
- 11.1. Market Analysis, Insights and Forecast - by Application
- 11.1.1. High Voltage Energy Storage
- 11.1.2. Low Voltage Energy Storage
- 11.2. Market Analysis, Insights and Forecast - by Types
- 11.2.1. Outdoor Type
- 11.2.2. Indoor Type
- 11.1. Market Analysis, Insights and Forecast - by Application
- 12. Competitive Analysis
- 12.1. Company Profiles
- 12.1.1 Tesla
- 12.1.1.1. Company Overview
- 12.1.1.2. Products
- 12.1.1.3. Company Financials
- 12.1.1.4. SWOT Analysis
- 12.1.2 Sonnen
- 12.1.2.1. Company Overview
- 12.1.2.2. Products
- 12.1.2.3. Company Financials
- 12.1.2.4. SWOT Analysis
- 12.1.3 BYD
- 12.1.3.1. Company Overview
- 12.1.3.2. Products
- 12.1.3.3. Company Financials
- 12.1.3.4. SWOT Analysis
- 12.1.4 LG Energy
- 12.1.4.1. Company Overview
- 12.1.4.2. Products
- 12.1.4.3. Company Financials
- 12.1.4.4. SWOT Analysis
- 12.1.5 Enphase Energy
- 12.1.5.1. Company Overview
- 12.1.5.2. Products
- 12.1.5.3. Company Financials
- 12.1.5.4. SWOT Analysis
- 12.1.6 Panasonic
- 12.1.6.1. Company Overview
- 12.1.6.2. Products
- 12.1.6.3. Company Financials
- 12.1.6.4. SWOT Analysis
- 12.1.7 GOODWE
- 12.1.7.1. Company Overview
- 12.1.7.2. Products
- 12.1.7.3. Company Financials
- 12.1.7.4. SWOT Analysis
- 12.1.8 Growatt
- 12.1.8.1. Company Overview
- 12.1.8.2. Products
- 12.1.8.3. Company Financials
- 12.1.8.4. SWOT Analysis
- 12.1.9 Huawei
- 12.1.9.1. Company Overview
- 12.1.9.2. Products
- 12.1.9.3. Company Financials
- 12.1.9.4. SWOT Analysis
- 12.1.10 PYLONTECH
- 12.1.10.1. Company Overview
- 12.1.10.2. Products
- 12.1.10.3. Company Financials
- 12.1.10.4. SWOT Analysis
- 12.1.11 Deye Technology
- 12.1.11.1. Company Overview
- 12.1.11.2. Products
- 12.1.11.3. Company Financials
- 12.1.11.4. SWOT Analysis
- 12.1.12 SUNGROW
- 12.1.12.1. Company Overview
- 12.1.12.2. Products
- 12.1.12.3. Company Financials
- 12.1.12.4. SWOT Analysis
- 12.1.13 SOFAR
- 12.1.13.1. Company Overview
- 12.1.13.2. Products
- 12.1.13.3. Company Financials
- 12.1.13.4. SWOT Analysis
- 12.1.14 Ginlong Technologies
- 12.1.14.1. Company Overview
- 12.1.14.2. Products
- 12.1.14.3. Company Financials
- 12.1.14.4. SWOT Analysis
- 12.1.15 SolaX Power
- 12.1.15.1. Company Overview
- 12.1.15.2. Products
- 12.1.15.3. Company Financials
- 12.1.15.4. SWOT Analysis
- 12.1.16 Megarevo
- 12.1.16.1. Company Overview
- 12.1.16.2. Products
- 12.1.16.3. Company Financials
- 12.1.16.4. SWOT Analysis
- 12.1.1 Tesla
- 12.2. Market Entropy
- 12.2.1 Company's Key Areas Served
- 12.2.2 Recent Developments
- 12.3. Company Market Share Analysis 2025
- 12.3.1 Top 5 Companies Market Share Analysis
- 12.3.2 Top 3 Companies Market Share Analysis
- 12.4. List of Potential Customers
- 13. Research Methodology
List of Figures
- Figure 1: Global Residential PV Energy Storage Inverters Revenue Breakdown (million, %) by Region 2025 & 2033
- Figure 2: Global Residential PV Energy Storage Inverters Volume Breakdown (K, %) by Region 2025 & 2033
- Figure 3: North America Residential PV Energy Storage Inverters Revenue (million), by Application 2025 & 2033
- Figure 4: North America Residential PV Energy Storage Inverters Volume (K), by Application 2025 & 2033
- Figure 5: North America Residential PV Energy Storage Inverters Revenue Share (%), by Application 2025 & 2033
- Figure 6: North America Residential PV Energy Storage Inverters Volume Share (%), by Application 2025 & 2033
- Figure 7: North America Residential PV Energy Storage Inverters Revenue (million), by Types 2025 & 2033
- Figure 8: North America Residential PV Energy Storage Inverters Volume (K), by Types 2025 & 2033
- Figure 9: North America Residential PV Energy Storage Inverters Revenue Share (%), by Types 2025 & 2033
- Figure 10: North America Residential PV Energy Storage Inverters Volume Share (%), by Types 2025 & 2033
- Figure 11: North America Residential PV Energy Storage Inverters Revenue (million), by Country 2025 & 2033
- Figure 12: North America Residential PV Energy Storage Inverters Volume (K), by Country 2025 & 2033
- Figure 13: North America Residential PV Energy Storage Inverters Revenue Share (%), by Country 2025 & 2033
- Figure 14: North America Residential PV Energy Storage Inverters Volume Share (%), by Country 2025 & 2033
- Figure 15: South America Residential PV Energy Storage Inverters Revenue (million), by Application 2025 & 2033
- Figure 16: South America Residential PV Energy Storage Inverters Volume (K), by Application 2025 & 2033
- Figure 17: South America Residential PV Energy Storage Inverters Revenue Share (%), by Application 2025 & 2033
- Figure 18: South America Residential PV Energy Storage Inverters Volume Share (%), by Application 2025 & 2033
- Figure 19: South America Residential PV Energy Storage Inverters Revenue (million), by Types 2025 & 2033
- Figure 20: South America Residential PV Energy Storage Inverters Volume (K), by Types 2025 & 2033
- Figure 21: South America Residential PV Energy Storage Inverters Revenue Share (%), by Types 2025 & 2033
- Figure 22: South America Residential PV Energy Storage Inverters Volume Share (%), by Types 2025 & 2033
- Figure 23: South America Residential PV Energy Storage Inverters Revenue (million), by Country 2025 & 2033
- Figure 24: South America Residential PV Energy Storage Inverters Volume (K), by Country 2025 & 2033
- Figure 25: South America Residential PV Energy Storage Inverters Revenue Share (%), by Country 2025 & 2033
- Figure 26: South America Residential PV Energy Storage Inverters Volume Share (%), by Country 2025 & 2033
- Figure 27: Europe Residential PV Energy Storage Inverters Revenue (million), by Application 2025 & 2033
- Figure 28: Europe Residential PV Energy Storage Inverters Volume (K), by Application 2025 & 2033
- Figure 29: Europe Residential PV Energy Storage Inverters Revenue Share (%), by Application 2025 & 2033
- Figure 30: Europe Residential PV Energy Storage Inverters Volume Share (%), by Application 2025 & 2033
- Figure 31: Europe Residential PV Energy Storage Inverters Revenue (million), by Types 2025 & 2033
- Figure 32: Europe Residential PV Energy Storage Inverters Volume (K), by Types 2025 & 2033
- Figure 33: Europe Residential PV Energy Storage Inverters Revenue Share (%), by Types 2025 & 2033
- Figure 34: Europe Residential PV Energy Storage Inverters Volume Share (%), by Types 2025 & 2033
- Figure 35: Europe Residential PV Energy Storage Inverters Revenue (million), by Country 2025 & 2033
- Figure 36: Europe Residential PV Energy Storage Inverters Volume (K), by Country 2025 & 2033
- Figure 37: Europe Residential PV Energy Storage Inverters Revenue Share (%), by Country 2025 & 2033
- Figure 38: Europe Residential PV Energy Storage Inverters Volume Share (%), by Country 2025 & 2033
- Figure 39: Middle East & Africa Residential PV Energy Storage Inverters Revenue (million), by Application 2025 & 2033
- Figure 40: Middle East & Africa Residential PV Energy Storage Inverters Volume (K), by Application 2025 & 2033
- Figure 41: Middle East & Africa Residential PV Energy Storage Inverters Revenue Share (%), by Application 2025 & 2033
- Figure 42: Middle East & Africa Residential PV Energy Storage Inverters Volume Share (%), by Application 2025 & 2033
- Figure 43: Middle East & Africa Residential PV Energy Storage Inverters Revenue (million), by Types 2025 & 2033
- Figure 44: Middle East & Africa Residential PV Energy Storage Inverters Volume (K), by Types 2025 & 2033
- Figure 45: Middle East & Africa Residential PV Energy Storage Inverters Revenue Share (%), by Types 2025 & 2033
- Figure 46: Middle East & Africa Residential PV Energy Storage Inverters Volume Share (%), by Types 2025 & 2033
- Figure 47: Middle East & Africa Residential PV Energy Storage Inverters Revenue (million), by Country 2025 & 2033
- Figure 48: Middle East & Africa Residential PV Energy Storage Inverters Volume (K), by Country 2025 & 2033
- Figure 49: Middle East & Africa Residential PV Energy Storage Inverters Revenue Share (%), by Country 2025 & 2033
- Figure 50: Middle East & Africa Residential PV Energy Storage Inverters Volume Share (%), by Country 2025 & 2033
- Figure 51: Asia Pacific Residential PV Energy Storage Inverters Revenue (million), by Application 2025 & 2033
- Figure 52: Asia Pacific Residential PV Energy Storage Inverters Volume (K), by Application 2025 & 2033
- Figure 53: Asia Pacific Residential PV Energy Storage Inverters Revenue Share (%), by Application 2025 & 2033
- Figure 54: Asia Pacific Residential PV Energy Storage Inverters Volume Share (%), by Application 2025 & 2033
- Figure 55: Asia Pacific Residential PV Energy Storage Inverters Revenue (million), by Types 2025 & 2033
- Figure 56: Asia Pacific Residential PV Energy Storage Inverters Volume (K), by Types 2025 & 2033
- Figure 57: Asia Pacific Residential PV Energy Storage Inverters Revenue Share (%), by Types 2025 & 2033
- Figure 58: Asia Pacific Residential PV Energy Storage Inverters Volume Share (%), by Types 2025 & 2033
- Figure 59: Asia Pacific Residential PV Energy Storage Inverters Revenue (million), by Country 2025 & 2033
- Figure 60: Asia Pacific Residential PV Energy Storage Inverters Volume (K), by Country 2025 & 2033
- Figure 61: Asia Pacific Residential PV Energy Storage Inverters Revenue Share (%), by Country 2025 & 2033
- Figure 62: Asia Pacific Residential PV Energy Storage Inverters Volume Share (%), by Country 2025 & 2033
List of Tables
- Table 1: Global Residential PV Energy Storage Inverters Revenue million Forecast, by Application 2020 & 2033
- Table 2: Global Residential PV Energy Storage Inverters Volume K Forecast, by Application 2020 & 2033
- Table 3: Global Residential PV Energy Storage Inverters Revenue million Forecast, by Types 2020 & 2033
- Table 4: Global Residential PV Energy Storage Inverters Volume K Forecast, by Types 2020 & 2033
- Table 5: Global Residential PV Energy Storage Inverters Revenue million Forecast, by Region 2020 & 2033
- Table 6: Global Residential PV Energy Storage Inverters Volume K Forecast, by Region 2020 & 2033
- Table 7: Global Residential PV Energy Storage Inverters Revenue million Forecast, by Application 2020 & 2033
- Table 8: Global Residential PV Energy Storage Inverters Volume K Forecast, by Application 2020 & 2033
- Table 9: Global Residential PV Energy Storage Inverters Revenue million Forecast, by Types 2020 & 2033
- Table 10: Global Residential PV Energy Storage Inverters Volume K Forecast, by Types 2020 & 2033
- Table 11: Global Residential PV Energy Storage Inverters Revenue million Forecast, by Country 2020 & 2033
- Table 12: Global Residential PV Energy Storage Inverters Volume K Forecast, by Country 2020 & 2033
- Table 13: United States Residential PV Energy Storage Inverters Revenue (million) Forecast, by Application 2020 & 2033
- Table 14: United States Residential PV Energy Storage Inverters Volume (K) Forecast, by Application 2020 & 2033
- Table 15: Canada Residential PV Energy Storage Inverters Revenue (million) Forecast, by Application 2020 & 2033
- Table 16: Canada Residential PV Energy Storage Inverters Volume (K) Forecast, by Application 2020 & 2033
- Table 17: Mexico Residential PV Energy Storage Inverters Revenue (million) Forecast, by Application 2020 & 2033
- Table 18: Mexico Residential PV Energy Storage Inverters Volume (K) Forecast, by Application 2020 & 2033
- Table 19: Global Residential PV Energy Storage Inverters Revenue million Forecast, by Application 2020 & 2033
- Table 20: Global Residential PV Energy Storage Inverters Volume K Forecast, by Application 2020 & 2033
- Table 21: Global Residential PV Energy Storage Inverters Revenue million Forecast, by Types 2020 & 2033
- Table 22: Global Residential PV Energy Storage Inverters Volume K Forecast, by Types 2020 & 2033
- Table 23: Global Residential PV Energy Storage Inverters Revenue million Forecast, by Country 2020 & 2033
- Table 24: Global Residential PV Energy Storage Inverters Volume K Forecast, by Country 2020 & 2033
- Table 25: Brazil Residential PV Energy Storage Inverters Revenue (million) Forecast, by Application 2020 & 2033
- Table 26: Brazil Residential PV Energy Storage Inverters Volume (K) Forecast, by Application 2020 & 2033
- Table 27: Argentina Residential PV Energy Storage Inverters Revenue (million) Forecast, by Application 2020 & 2033
- Table 28: Argentina Residential PV Energy Storage Inverters Volume (K) Forecast, by Application 2020 & 2033
- Table 29: Rest of South America Residential PV Energy Storage Inverters Revenue (million) Forecast, by Application 2020 & 2033
- Table 30: Rest of South America Residential PV Energy Storage Inverters Volume (K) Forecast, by Application 2020 & 2033
- Table 31: Global Residential PV Energy Storage Inverters Revenue million Forecast, by Application 2020 & 2033
- Table 32: Global Residential PV Energy Storage Inverters Volume K Forecast, by Application 2020 & 2033
- Table 33: Global Residential PV Energy Storage Inverters Revenue million Forecast, by Types 2020 & 2033
- Table 34: Global Residential PV Energy Storage Inverters Volume K Forecast, by Types 2020 & 2033
- Table 35: Global Residential PV Energy Storage Inverters Revenue million Forecast, by Country 2020 & 2033
- Table 36: Global Residential PV Energy Storage Inverters Volume K Forecast, by Country 2020 & 2033
- Table 37: United Kingdom Residential PV Energy Storage Inverters Revenue (million) Forecast, by Application 2020 & 2033
- Table 38: United Kingdom Residential PV Energy Storage Inverters Volume (K) Forecast, by Application 2020 & 2033
- Table 39: Germany Residential PV Energy Storage Inverters Revenue (million) Forecast, by Application 2020 & 2033
- Table 40: Germany Residential PV Energy Storage Inverters Volume (K) Forecast, by Application 2020 & 2033
- Table 41: France Residential PV Energy Storage Inverters Revenue (million) Forecast, by Application 2020 & 2033
- Table 42: France Residential PV Energy Storage Inverters Volume (K) Forecast, by Application 2020 & 2033
- Table 43: Italy Residential PV Energy Storage Inverters Revenue (million) Forecast, by Application 2020 & 2033
- Table 44: Italy Residential PV Energy Storage Inverters Volume (K) Forecast, by Application 2020 & 2033
- Table 45: Spain Residential PV Energy Storage Inverters Revenue (million) Forecast, by Application 2020 & 2033
- Table 46: Spain Residential PV Energy Storage Inverters Volume (K) Forecast, by Application 2020 & 2033
- Table 47: Russia Residential PV Energy Storage Inverters Revenue (million) Forecast, by Application 2020 & 2033
- Table 48: Russia Residential PV Energy Storage Inverters Volume (K) Forecast, by Application 2020 & 2033
- Table 49: Benelux Residential PV Energy Storage Inverters Revenue (million) Forecast, by Application 2020 & 2033
- Table 50: Benelux Residential PV Energy Storage Inverters Volume (K) Forecast, by Application 2020 & 2033
- Table 51: Nordics Residential PV Energy Storage Inverters Revenue (million) Forecast, by Application 2020 & 2033
- Table 52: Nordics Residential PV Energy Storage Inverters Volume (K) Forecast, by Application 2020 & 2033
- Table 53: Rest of Europe Residential PV Energy Storage Inverters Revenue (million) Forecast, by Application 2020 & 2033
- Table 54: Rest of Europe Residential PV Energy Storage Inverters Volume (K) Forecast, by Application 2020 & 2033
- Table 55: Global Residential PV Energy Storage Inverters Revenue million Forecast, by Application 2020 & 2033
- Table 56: Global Residential PV Energy Storage Inverters Volume K Forecast, by Application 2020 & 2033
- Table 57: Global Residential PV Energy Storage Inverters Revenue million Forecast, by Types 2020 & 2033
- Table 58: Global Residential PV Energy Storage Inverters Volume K Forecast, by Types 2020 & 2033
- Table 59: Global Residential PV Energy Storage Inverters Revenue million Forecast, by Country 2020 & 2033
- Table 60: Global Residential PV Energy Storage Inverters Volume K Forecast, by Country 2020 & 2033
- Table 61: Turkey Residential PV Energy Storage Inverters Revenue (million) Forecast, by Application 2020 & 2033
- Table 62: Turkey Residential PV Energy Storage Inverters Volume (K) Forecast, by Application 2020 & 2033
- Table 63: Israel Residential PV Energy Storage Inverters Revenue (million) Forecast, by Application 2020 & 2033
- Table 64: Israel Residential PV Energy Storage Inverters Volume (K) Forecast, by Application 2020 & 2033
- Table 65: GCC Residential PV Energy Storage Inverters Revenue (million) Forecast, by Application 2020 & 2033
- Table 66: GCC Residential PV Energy Storage Inverters Volume (K) Forecast, by Application 2020 & 2033
- Table 67: North Africa Residential PV Energy Storage Inverters Revenue (million) Forecast, by Application 2020 & 2033
- Table 68: North Africa Residential PV Energy Storage Inverters Volume (K) Forecast, by Application 2020 & 2033
- Table 69: South Africa Residential PV Energy Storage Inverters Revenue (million) Forecast, by Application 2020 & 2033
- Table 70: South Africa Residential PV Energy Storage Inverters Volume (K) Forecast, by Application 2020 & 2033
- Table 71: Rest of Middle East & Africa Residential PV Energy Storage Inverters Revenue (million) Forecast, by Application 2020 & 2033
- Table 72: Rest of Middle East & Africa Residential PV Energy Storage Inverters Volume (K) Forecast, by Application 2020 & 2033
- Table 73: Global Residential PV Energy Storage Inverters Revenue million Forecast, by Application 2020 & 2033
- Table 74: Global Residential PV Energy Storage Inverters Volume K Forecast, by Application 2020 & 2033
- Table 75: Global Residential PV Energy Storage Inverters Revenue million Forecast, by Types 2020 & 2033
- Table 76: Global Residential PV Energy Storage Inverters Volume K Forecast, by Types 2020 & 2033
- Table 77: Global Residential PV Energy Storage Inverters Revenue million Forecast, by Country 2020 & 2033
- Table 78: Global Residential PV Energy Storage Inverters Volume K Forecast, by Country 2020 & 2033
- Table 79: China Residential PV Energy Storage Inverters Revenue (million) Forecast, by Application 2020 & 2033
- Table 80: China Residential PV Energy Storage Inverters Volume (K) Forecast, by Application 2020 & 2033
- Table 81: India Residential PV Energy Storage Inverters Revenue (million) Forecast, by Application 2020 & 2033
- Table 82: India Residential PV Energy Storage Inverters Volume (K) Forecast, by Application 2020 & 2033
- Table 83: Japan Residential PV Energy Storage Inverters Revenue (million) Forecast, by Application 2020 & 2033
- Table 84: Japan Residential PV Energy Storage Inverters Volume (K) Forecast, by Application 2020 & 2033
- Table 85: South Korea Residential PV Energy Storage Inverters Revenue (million) Forecast, by Application 2020 & 2033
- Table 86: South Korea Residential PV Energy Storage Inverters Volume (K) Forecast, by Application 2020 & 2033
- Table 87: ASEAN Residential PV Energy Storage Inverters Revenue (million) Forecast, by Application 2020 & 2033
- Table 88: ASEAN Residential PV Energy Storage Inverters Volume (K) Forecast, by Application 2020 & 2033
- Table 89: Oceania Residential PV Energy Storage Inverters Revenue (million) Forecast, by Application 2020 & 2033
- Table 90: Oceania Residential PV Energy Storage Inverters Volume (K) Forecast, by Application 2020 & 2033
- Table 91: Rest of Asia Pacific Residential PV Energy Storage Inverters Revenue (million) Forecast, by Application 2020 & 2033
- Table 92: Rest of Asia Pacific Residential PV Energy Storage Inverters Volume (K) Forecast, by Application 2020 & 2033
Frequently Asked Questions
1. What is the projected Compound Annual Growth Rate (CAGR) of the Residential PV Energy Storage Inverters?
The projected CAGR is approximately 25.9%.
2. Which companies are prominent players in the Residential PV Energy Storage Inverters?
Key companies in the market include Tesla, Sonnen, BYD, LG Energy, Enphase Energy, Panasonic, GOODWE, Growatt, Huawei, PYLONTECH, Deye Technology, SUNGROW, SOFAR, Ginlong Technologies, SolaX Power, Megarevo.
3. What are the main segments of the Residential PV Energy Storage Inverters?
The market segments include Application, Types.
4. Can you provide details about the market size?
The market size is estimated to be USD 445 million as of 2022.
5. What are some drivers contributing to market growth?
N/A
6. What are the notable trends driving market growth?
N/A
7. Are there any restraints impacting market growth?
N/A
8. Can you provide examples of recent developments in the market?
N/A
9. What pricing options are available for accessing the report?
Pricing options include single-user, multi-user, and enterprise licenses priced at USD 4350.00, USD 6525.00, and USD 8700.00 respectively.
10. Is the market size provided in terms of value or volume?
The market size is provided in terms of value, measured in million and volume, measured in K.
11. Are there any specific market keywords associated with the report?
Yes, the market keyword associated with the report is "Residential PV Energy Storage Inverters," which aids in identifying and referencing the specific market segment covered.
12. How do I determine which pricing option suits my needs best?
The pricing options vary based on user requirements and access needs. Individual users may opt for single-user licenses, while businesses requiring broader access may choose multi-user or enterprise licenses for cost-effective access to the report.
13. Are there any additional resources or data provided in the Residential PV Energy Storage Inverters report?
While the report offers comprehensive insights, it's advisable to review the specific contents or supplementary materials provided to ascertain if additional resources or data are available.
14. How can I stay updated on further developments or reports in the Residential PV Energy Storage Inverters?
To stay informed about further developments, trends, and reports in the Residential PV Energy Storage Inverters, consider subscribing to industry newsletters, following relevant companies and organizations, or regularly checking reputable industry news sources and publications.
Methodology
Step 1 - Identification of Relevant Samples Size from Population Database


Step 2 - Approaches for Defining Global Market Size (Value, Volume* & Price*)

Note*: In applicable scenarios
Step 3 - Data Sources
Primary Research
- Web Analytics
- Survey Reports
- Research Institute
- Latest Research Reports
- Opinion Leaders
Secondary Research
- Annual Reports
- White Paper
- Latest Press Release
- Industry Association
- Paid Database
- Investor Presentations

Step 4 - Data Triangulation
Involves using different sources of information in order to increase the validity of a study
These sources are likely to be stakeholders in a program - participants, other researchers, program staff, other community members, and so on.
Then we put all data in single framework & apply various statistical tools to find out the dynamic on the market.
During the analysis stage, feedback from the stakeholder groups would be compared to determine areas of agreement as well as areas of divergence