

Key Insights
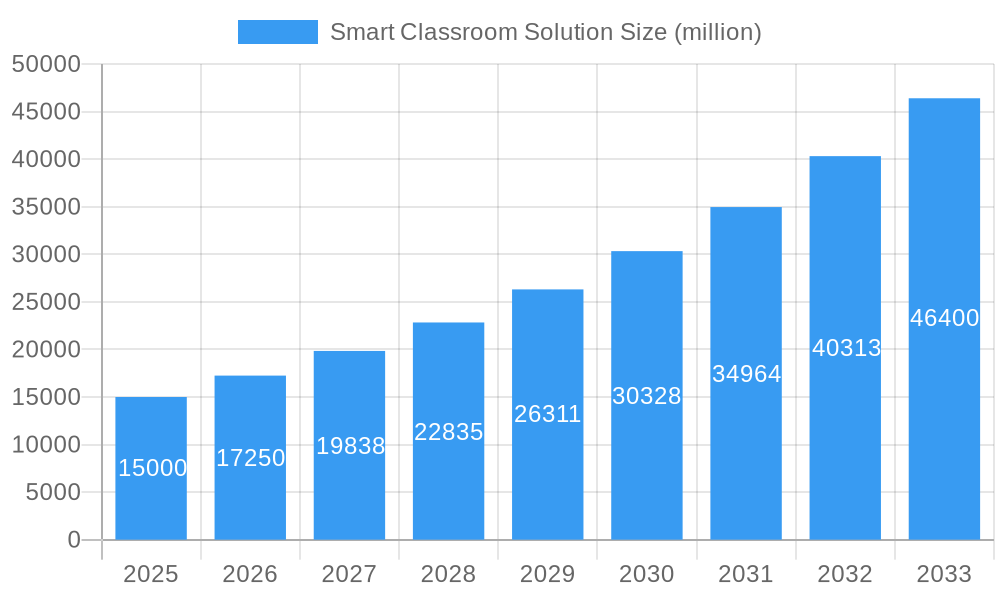
The global smart classroom solutions market is poised for significant expansion, propelled by supportive government digital education initiatives, widespread technology integration in academic settings, and the escalating demand for enriched learning experiences. This dynamic market, valued at $7.46 billion in the base year 2025, is projected to grow at a Compound Annual Growth Rate (CAGR) of 9.85% from 2025 to 2033, reaching an estimated $15 billion by the end of the forecast period. Key growth drivers include the adoption of interactive whiteboards, collaborative learning platforms, and AI-driven educational tools. The surge in remote learning solutions, amplified by recent global circumstances, is a substantial contributor to this market's upward trajectory. However, market growth may be constrained by substantial initial investment requirements for educational institutions and the persistent digital divide, especially in emerging economies. The market is segmented by solution type (hardware, software, services), deployment model (cloud-based, on-premise), and end-user (K-12, higher education). Leading companies such as Huawei, ATEN, and Samsung are actively investing in R&D to innovate and broaden their market influence.
Smart Classroom Solution Market Size (In Billion)
The competitive environment features both established technology giants and dedicated EdTech providers. Company success is contingent upon delivering innovative, educationally tailored solutions, providing exceptional customer support, and fostering strong relationships with educational institutions. Geographically, North America and Europe currently lead smart classroom solution adoption. The Asia-Pacific region presents considerable future growth potential, driven by increased government educational investment and rising technological proficiency. Sustained market advancement will depend on ongoing technological innovation, enhanced solution affordability and accessibility, and effective teacher training to ensure optimal integration and utilization of smart classroom technologies.
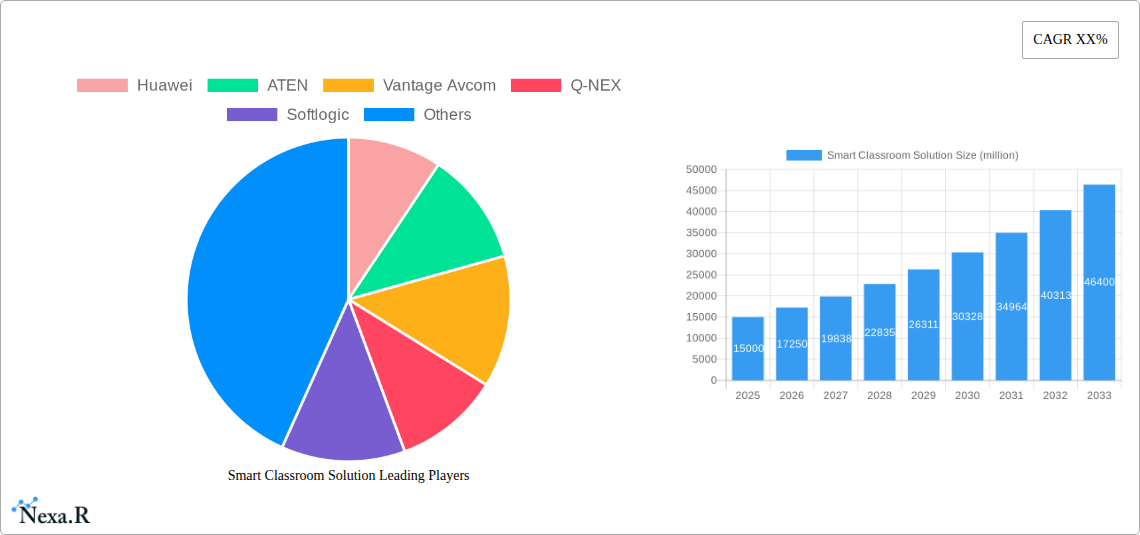
Smart Classroom Solution Company Market Share
Smart Classroom Solution Market Report: 2019-2033
This comprehensive report provides an in-depth analysis of the global Smart Classroom Solution market, encompassing historical data (2019-2024), current estimates (2025), and future forecasts (2025-2033). The report examines market dynamics, growth trends, regional dominance, product innovation, key players, and emerging opportunities within the K-12 and Higher Education sectors (parent and child markets). With a projected market size reaching xx million units by 2033, this report is an invaluable resource for industry professionals, investors, and educational institutions seeking to understand and capitalize on this rapidly evolving landscape.
Smart Classroom Solution Market Dynamics & Structure
The Smart Classroom Solution market exhibits a moderately concentrated structure, with key players like Huawei, Samsung, and Smart Technologies holding significant market share. Technological innovation, driven by advancements in AI, IoT, and cloud computing, is a primary growth driver. Regulatory frameworks, particularly those focused on digital learning initiatives and educational technology adoption, significantly influence market growth. The emergence of interactive whiteboards, collaborative learning platforms, and virtual reality solutions presents both opportunities and challenges for existing players. Market consolidation through mergers and acquisitions (M&A) is anticipated to continue, with an estimated xx M&A deals projected during the forecast period. End-user demographics, particularly the increasing adoption of technology in education across various age groups, fuels market expansion.
- Market Concentration: Moderately concentrated, with top 5 players holding approximately xx% market share in 2025.
- Technological Innovation: AI-powered learning platforms, IoT-enabled classroom management systems, and VR/AR applications are key drivers.
- Regulatory Landscape: Government initiatives promoting digital learning and technology integration in schools are fostering growth.
- Competitive Substitutes: Traditional teaching methods and basic classroom technology pose competitive pressure.
- M&A Activity: An estimated xx M&A deals are predicted between 2025 and 2033.
- End-User Demographics: Growing adoption of technology in education across K-12 and higher education segments.
Smart Classroom Solution Growth Trends & Insights
The global Smart Classroom Solution market is experiencing robust growth, driven by increasing government investments in education technology, rising demand for interactive learning experiences, and the growing adoption of blended learning models. The market size, estimated at xx million units in 2025, is projected to reach xx million units by 2033, exhibiting a Compound Annual Growth Rate (CAGR) of xx%. This growth is fueled by factors such as increasing internet penetration, the affordability of smart classroom solutions, and the growing recognition of the benefits of technology-enhanced learning. Technological disruptions, such as the integration of AI and machine learning in educational tools, are transforming the learning experience and further accelerating market growth. Consumer behavior shifts, particularly towards personalized learning and interactive engagement, are also contributing to the market's expansion. Market penetration is expected to increase significantly, from xx% in 2025 to xx% in 2033.
Dominant Regions, Countries, or Segments in Smart Classroom Solution
North America currently dominates the Smart Classroom Solution market, driven by strong government support for educational technology, high internet penetration rates, and a large number of educational institutions. However, Asia-Pacific is projected to experience the fastest growth rate during the forecast period, fueled by increasing government investments in education, rising disposable incomes, and a growing number of schools adopting smart classroom technologies. The K-12 segment currently holds the largest market share, while the higher education segment is expected to demonstrate significant growth potential due to increased adoption of technology for research and online learning.
- Key Drivers in North America: High adoption rates, strong government funding, well-developed infrastructure.
- Key Drivers in Asia-Pacific: Rapid economic growth, increasing government investments in education, growing digital literacy.
- Segment Dominance: The K-12 segment holds the largest market share, followed by the Higher Education segment.
Smart Classroom Solution Product Landscape
The Smart Classroom Solution market offers a diverse range of products, including interactive whiteboards, smart projectors, collaborative learning platforms, student response systems, and learning management systems (LMS). These solutions are characterized by features such as touch-screen interactivity, cloud-based accessibility, and integration with various educational software. Technological advancements, such as AI-powered personalized learning and augmented reality (AR) applications, are continually enhancing product functionality and user experience. Unique selling propositions often revolve around ease of use, integration capabilities, and cost-effectiveness.
Key Drivers, Barriers & Challenges in Smart Classroom Solution
Key Drivers:
- Increasing government initiatives promoting digital education.
- Rising demand for personalized and interactive learning experiences.
- Growing adoption of blended learning models.
- Technological advancements in AI, IoT, and cloud computing.
Challenges & Restraints:
- High initial investment costs for schools and educational institutions.
- Lack of digital literacy and teacher training in certain regions.
- Concerns regarding data privacy and security.
- Competition from traditional teaching methods and established players. This results in an estimated xx million units lost annually due to competitive pressures.
Emerging Opportunities in Smart Classroom Solution
- Expansion into underserved markets in developing countries.
- Integration of emerging technologies such as virtual reality (VR) and augmented reality (AR).
- Development of personalized learning platforms powered by artificial intelligence (AI).
- Increased focus on gamified learning and interactive simulations.
Growth Accelerators in the Smart Classroom Solution Industry
The Smart Classroom Solution market's sustained growth is fueled by strategic partnerships between technology providers and educational institutions, resulting in the development of integrated learning ecosystems. Technological breakthroughs, especially in AI-driven personalized learning and immersive learning technologies, will further accelerate market expansion. Government initiatives supporting digital education and infrastructure development will also play a significant role. Expansion into new geographical markets, particularly in developing economies, presents significant growth opportunities.
Notable Milestones in Smart Classroom Solution Sector
- 2020: Launch of several AI-powered learning platforms by key players.
- 2021: Significant increase in government funding for educational technology initiatives in several countries.
- 2022: Several mergers and acquisitions consolidate the market.
- 2023: Wide-scale adoption of interactive whiteboards and collaborative learning platforms.
- 2024: Introduction of several VR/AR based learning solutions.
In-Depth Smart Classroom Solution Market Outlook
The future of the Smart Classroom Solution market is bright, driven by continued technological advancements, increasing government support for digital education, and the growing recognition of the benefits of technology-enhanced learning. Strategic partnerships, product innovation, and market expansion into underserved regions will be crucial factors in determining future market success. The market is poised for significant growth, with substantial potential for both established players and new entrants. The projected CAGR, combined with the expanding adoption rates across diverse educational segments, indicates a robust and dynamic market primed for considerable expansion in the coming years.
Smart Classroom Solution Segmentation
-
1. Application
- 1.1. Educate
- 1.2. Training
- 1.3. Other
-
2. Types
- 2.1. Hardware
- 2.2. Software
- 2.3. Service
Smart Classroom Solution Segmentation By Geography
-
1. North America
- 1.1. United States
- 1.2. Canada
- 1.3. Mexico
-
2. South America
- 2.1. Brazil
- 2.2. Argentina
- 2.3. Rest of South America
-
3. Europe
- 3.1. United Kingdom
- 3.2. Germany
- 3.3. France
- 3.4. Italy
- 3.5. Spain
- 3.6. Russia
- 3.7. Benelux
- 3.8. Nordics
- 3.9. Rest of Europe
-
4. Middle East & Africa
- 4.1. Turkey
- 4.2. Israel
- 4.3. GCC
- 4.4. North Africa
- 4.5. South Africa
- 4.6. Rest of Middle East & Africa
-
5. Asia Pacific
- 5.1. China
- 5.2. India
- 5.3. Japan
- 5.4. South Korea
- 5.5. ASEAN
- 5.6. Oceania
- 5.7. Rest of Asia Pacific

Smart Classroom Solution Regional Market Share
Geographic Coverage of Smart Classroom Solution
Smart Classroom Solution REPORT HIGHLIGHTS
| Aspects | Details |
|---|---|
| Study Period | 2020-2034 |
| Base Year | 2025 |
| Estimated Year | 2026 |
| Forecast Period | 2026-2034 |
| Historical Period | 2020-2025 |
| Growth Rate | CAGR of 9.85% from 2020-2034 |
| Segmentation |
|
Table of Contents
- 1. Introduction
- 1.1. Research Scope
- 1.2. Market Segmentation
- 1.3. Research Methodology
- 1.4. Definitions and Assumptions
- 2. Executive Summary
- 2.1. Introduction
- 3. Market Dynamics
- 3.1. Introduction
- 3.2. Market Drivers
- 3.3. Market Restrains
- 3.4. Market Trends
- 4. Market Factor Analysis
- 4.1. Porters Five Forces
- 4.2. Supply/Value Chain
- 4.3. PESTEL analysis
- 4.4. Market Entropy
- 4.5. Patent/Trademark Analysis
- 5. Global Smart Classroom Solution Analysis, Insights and Forecast, 2020-2032
- 5.1. Market Analysis, Insights and Forecast - by Application
- 5.1.1. Educate
- 5.1.2. Training
- 5.1.3. Other
- 5.2. Market Analysis, Insights and Forecast - by Types
- 5.2.1. Hardware
- 5.2.2. Software
- 5.2.3. Service
- 5.3. Market Analysis, Insights and Forecast - by Region
- 5.3.1. North America
- 5.3.2. South America
- 5.3.3. Europe
- 5.3.4. Middle East & Africa
- 5.3.5. Asia Pacific
- 5.1. Market Analysis, Insights and Forecast - by Application
- 6. North America Smart Classroom Solution Analysis, Insights and Forecast, 2020-2032
- 6.1. Market Analysis, Insights and Forecast - by Application
- 6.1.1. Educate
- 6.1.2. Training
- 6.1.3. Other
- 6.2. Market Analysis, Insights and Forecast - by Types
- 6.2.1. Hardware
- 6.2.2. Software
- 6.2.3. Service
- 6.1. Market Analysis, Insights and Forecast - by Application
- 7. South America Smart Classroom Solution Analysis, Insights and Forecast, 2020-2032
- 7.1. Market Analysis, Insights and Forecast - by Application
- 7.1.1. Educate
- 7.1.2. Training
- 7.1.3. Other
- 7.2. Market Analysis, Insights and Forecast - by Types
- 7.2.1. Hardware
- 7.2.2. Software
- 7.2.3. Service
- 7.1. Market Analysis, Insights and Forecast - by Application
- 8. Europe Smart Classroom Solution Analysis, Insights and Forecast, 2020-2032
- 8.1. Market Analysis, Insights and Forecast - by Application
- 8.1.1. Educate
- 8.1.2. Training
- 8.1.3. Other
- 8.2. Market Analysis, Insights and Forecast - by Types
- 8.2.1. Hardware
- 8.2.2. Software
- 8.2.3. Service
- 8.1. Market Analysis, Insights and Forecast - by Application
- 9. Middle East & Africa Smart Classroom Solution Analysis, Insights and Forecast, 2020-2032
- 9.1. Market Analysis, Insights and Forecast - by Application
- 9.1.1. Educate
- 9.1.2. Training
- 9.1.3. Other
- 9.2. Market Analysis, Insights and Forecast - by Types
- 9.2.1. Hardware
- 9.2.2. Software
- 9.2.3. Service
- 9.1. Market Analysis, Insights and Forecast - by Application
- 10. Asia Pacific Smart Classroom Solution Analysis, Insights and Forecast, 2020-2032
- 10.1. Market Analysis, Insights and Forecast - by Application
- 10.1.1. Educate
- 10.1.2. Training
- 10.1.3. Other
- 10.2. Market Analysis, Insights and Forecast - by Types
- 10.2.1. Hardware
- 10.2.2. Software
- 10.2.3. Service
- 10.1. Market Analysis, Insights and Forecast - by Application
- 11. Competitive Analysis
- 11.1. Global Market Share Analysis 2025
- 11.2. Company Profiles
- 11.2.1 Huawei
- 11.2.1.1. Overview
- 11.2.1.2. Products
- 11.2.1.3. SWOT Analysis
- 11.2.1.4. Recent Developments
- 11.2.1.5. Financials (Based on Availability)
- 11.2.2 ATEN
- 11.2.2.1. Overview
- 11.2.2.2. Products
- 11.2.2.3. SWOT Analysis
- 11.2.2.4. Recent Developments
- 11.2.2.5. Financials (Based on Availability)
- 11.2.3 Vantage Avcom
- 11.2.3.1. Overview
- 11.2.3.2. Products
- 11.2.3.3. SWOT Analysis
- 11.2.3.4. Recent Developments
- 11.2.3.5. Financials (Based on Availability)
- 11.2.4 Q-NEX
- 11.2.4.1. Overview
- 11.2.4.2. Products
- 11.2.4.3. SWOT Analysis
- 11.2.4.4. Recent Developments
- 11.2.4.5. Financials (Based on Availability)
- 11.2.5 Softlogic
- 11.2.5.1. Overview
- 11.2.5.2. Products
- 11.2.5.3. SWOT Analysis
- 11.2.5.4. Recent Developments
- 11.2.5.5. Financials (Based on Availability)
- 11.2.6 Samsung
- 11.2.6.1. Overview
- 11.2.6.2. Products
- 11.2.6.3. SWOT Analysis
- 11.2.6.4. Recent Developments
- 11.2.6.5. Financials (Based on Availability)
- 11.2.7 Hitachi
- 11.2.7.1. Overview
- 11.2.7.2. Products
- 11.2.7.3. SWOT Analysis
- 11.2.7.4. Recent Developments
- 11.2.7.5. Financials (Based on Availability)
- 11.2.8 Panasonic
- 11.2.8.1. Overview
- 11.2.8.2. Products
- 11.2.8.3. SWOT Analysis
- 11.2.8.4. Recent Developments
- 11.2.8.5. Financials (Based on Availability)
- 11.2.9 Ebix SmartClass
- 11.2.9.1. Overview
- 11.2.9.2. Products
- 11.2.9.3. SWOT Analysis
- 11.2.9.4. Recent Developments
- 11.2.9.5. Financials (Based on Availability)
- 11.2.10 Next Education India
- 11.2.10.1. Overview
- 11.2.10.2. Products
- 11.2.10.3. SWOT Analysis
- 11.2.10.4. Recent Developments
- 11.2.10.5. Financials (Based on Availability)
- 11.2.11 Educomp Group
- 11.2.11.1. Overview
- 11.2.11.2. Products
- 11.2.11.3. SWOT Analysis
- 11.2.11.4. Recent Developments
- 11.2.11.5. Financials (Based on Availability)
- 11.2.12 Smart Technologies
- 11.2.12.1. Overview
- 11.2.12.2. Products
- 11.2.12.3. SWOT Analysis
- 11.2.12.4. Recent Developments
- 11.2.12.5. Financials (Based on Availability)
- 11.2.13 Cybernetyx Technik
- 11.2.13.1. Overview
- 11.2.13.2. Products
- 11.2.13.3. SWOT Analysis
- 11.2.13.4. Recent Developments
- 11.2.13.5. Financials (Based on Availability)
- 11.2.14 Extramarks
- 11.2.14.1. Overview
- 11.2.14.2. Products
- 11.2.14.3. SWOT Analysis
- 11.2.14.4. Recent Developments
- 11.2.14.5. Financials (Based on Availability)
- 11.2.15 Globus Infocom
- 11.2.15.1. Overview
- 11.2.15.2. Products
- 11.2.15.3. SWOT Analysis
- 11.2.15.4. Recent Developments
- 11.2.15.5. Financials (Based on Availability)
- 11.2.16 NIIT Technologies
- 11.2.16.1. Overview
- 11.2.16.2. Products
- 11.2.16.3. SWOT Analysis
- 11.2.16.4. Recent Developments
- 11.2.16.5. Financials (Based on Availability)
- 11.2.17 NetDragon Education
- 11.2.17.1. Overview
- 11.2.17.2. Products
- 11.2.17.3. SWOT Analysis
- 11.2.17.4. Recent Developments
- 11.2.17.5. Financials (Based on Availability)
- 11.2.1 Huawei
List of Figures
- Figure 1: Global Smart Classroom Solution Revenue Breakdown (billion, %) by Region 2025 & 2033
- Figure 2: North America Smart Classroom Solution Revenue (billion), by Application 2025 & 2033
- Figure 3: North America Smart Classroom Solution Revenue Share (%), by Application 2025 & 2033
- Figure 4: North America Smart Classroom Solution Revenue (billion), by Types 2025 & 2033
- Figure 5: North America Smart Classroom Solution Revenue Share (%), by Types 2025 & 2033
- Figure 6: North America Smart Classroom Solution Revenue (billion), by Country 2025 & 2033
- Figure 7: North America Smart Classroom Solution Revenue Share (%), by Country 2025 & 2033
- Figure 8: South America Smart Classroom Solution Revenue (billion), by Application 2025 & 2033
- Figure 9: South America Smart Classroom Solution Revenue Share (%), by Application 2025 & 2033
- Figure 10: South America Smart Classroom Solution Revenue (billion), by Types 2025 & 2033
- Figure 11: South America Smart Classroom Solution Revenue Share (%), by Types 2025 & 2033
- Figure 12: South America Smart Classroom Solution Revenue (billion), by Country 2025 & 2033
- Figure 13: South America Smart Classroom Solution Revenue Share (%), by Country 2025 & 2033
- Figure 14: Europe Smart Classroom Solution Revenue (billion), by Application 2025 & 2033
- Figure 15: Europe Smart Classroom Solution Revenue Share (%), by Application 2025 & 2033
- Figure 16: Europe Smart Classroom Solution Revenue (billion), by Types 2025 & 2033
- Figure 17: Europe Smart Classroom Solution Revenue Share (%), by Types 2025 & 2033
- Figure 18: Europe Smart Classroom Solution Revenue (billion), by Country 2025 & 2033
- Figure 19: Europe Smart Classroom Solution Revenue Share (%), by Country 2025 & 2033
- Figure 20: Middle East & Africa Smart Classroom Solution Revenue (billion), by Application 2025 & 2033
- Figure 21: Middle East & Africa Smart Classroom Solution Revenue Share (%), by Application 2025 & 2033
- Figure 22: Middle East & Africa Smart Classroom Solution Revenue (billion), by Types 2025 & 2033
- Figure 23: Middle East & Africa Smart Classroom Solution Revenue Share (%), by Types 2025 & 2033
- Figure 24: Middle East & Africa Smart Classroom Solution Revenue (billion), by Country 2025 & 2033
- Figure 25: Middle East & Africa Smart Classroom Solution Revenue Share (%), by Country 2025 & 2033
- Figure 26: Asia Pacific Smart Classroom Solution Revenue (billion), by Application 2025 & 2033
- Figure 27: Asia Pacific Smart Classroom Solution Revenue Share (%), by Application 2025 & 2033
- Figure 28: Asia Pacific Smart Classroom Solution Revenue (billion), by Types 2025 & 2033
- Figure 29: Asia Pacific Smart Classroom Solution Revenue Share (%), by Types 2025 & 2033
- Figure 30: Asia Pacific Smart Classroom Solution Revenue (billion), by Country 2025 & 2033
- Figure 31: Asia Pacific Smart Classroom Solution Revenue Share (%), by Country 2025 & 2033
List of Tables
- Table 1: Global Smart Classroom Solution Revenue billion Forecast, by Application 2020 & 2033
- Table 2: Global Smart Classroom Solution Revenue billion Forecast, by Types 2020 & 2033
- Table 3: Global Smart Classroom Solution Revenue billion Forecast, by Region 2020 & 2033
- Table 4: Global Smart Classroom Solution Revenue billion Forecast, by Application 2020 & 2033
- Table 5: Global Smart Classroom Solution Revenue billion Forecast, by Types 2020 & 2033
- Table 6: Global Smart Classroom Solution Revenue billion Forecast, by Country 2020 & 2033
- Table 7: United States Smart Classroom Solution Revenue (billion) Forecast, by Application 2020 & 2033
- Table 8: Canada Smart Classroom Solution Revenue (billion) Forecast, by Application 2020 & 2033
- Table 9: Mexico Smart Classroom Solution Revenue (billion) Forecast, by Application 2020 & 2033
- Table 10: Global Smart Classroom Solution Revenue billion Forecast, by Application 2020 & 2033
- Table 11: Global Smart Classroom Solution Revenue billion Forecast, by Types 2020 & 2033
- Table 12: Global Smart Classroom Solution Revenue billion Forecast, by Country 2020 & 2033
- Table 13: Brazil Smart Classroom Solution Revenue (billion) Forecast, by Application 2020 & 2033
- Table 14: Argentina Smart Classroom Solution Revenue (billion) Forecast, by Application 2020 & 2033
- Table 15: Rest of South America Smart Classroom Solution Revenue (billion) Forecast, by Application 2020 & 2033
- Table 16: Global Smart Classroom Solution Revenue billion Forecast, by Application 2020 & 2033
- Table 17: Global Smart Classroom Solution Revenue billion Forecast, by Types 2020 & 2033
- Table 18: Global Smart Classroom Solution Revenue billion Forecast, by Country 2020 & 2033
- Table 19: United Kingdom Smart Classroom Solution Revenue (billion) Forecast, by Application 2020 & 2033
- Table 20: Germany Smart Classroom Solution Revenue (billion) Forecast, by Application 2020 & 2033
- Table 21: France Smart Classroom Solution Revenue (billion) Forecast, by Application 2020 & 2033
- Table 22: Italy Smart Classroom Solution Revenue (billion) Forecast, by Application 2020 & 2033
- Table 23: Spain Smart Classroom Solution Revenue (billion) Forecast, by Application 2020 & 2033
- Table 24: Russia Smart Classroom Solution Revenue (billion) Forecast, by Application 2020 & 2033
- Table 25: Benelux Smart Classroom Solution Revenue (billion) Forecast, by Application 2020 & 2033
- Table 26: Nordics Smart Classroom Solution Revenue (billion) Forecast, by Application 2020 & 2033
- Table 27: Rest of Europe Smart Classroom Solution Revenue (billion) Forecast, by Application 2020 & 2033
- Table 28: Global Smart Classroom Solution Revenue billion Forecast, by Application 2020 & 2033
- Table 29: Global Smart Classroom Solution Revenue billion Forecast, by Types 2020 & 2033
- Table 30: Global Smart Classroom Solution Revenue billion Forecast, by Country 2020 & 2033
- Table 31: Turkey Smart Classroom Solution Revenue (billion) Forecast, by Application 2020 & 2033
- Table 32: Israel Smart Classroom Solution Revenue (billion) Forecast, by Application 2020 & 2033
- Table 33: GCC Smart Classroom Solution Revenue (billion) Forecast, by Application 2020 & 2033
- Table 34: North Africa Smart Classroom Solution Revenue (billion) Forecast, by Application 2020 & 2033
- Table 35: South Africa Smart Classroom Solution Revenue (billion) Forecast, by Application 2020 & 2033
- Table 36: Rest of Middle East & Africa Smart Classroom Solution Revenue (billion) Forecast, by Application 2020 & 2033
- Table 37: Global Smart Classroom Solution Revenue billion Forecast, by Application 2020 & 2033
- Table 38: Global Smart Classroom Solution Revenue billion Forecast, by Types 2020 & 2033
- Table 39: Global Smart Classroom Solution Revenue billion Forecast, by Country 2020 & 2033
- Table 40: China Smart Classroom Solution Revenue (billion) Forecast, by Application 2020 & 2033
- Table 41: India Smart Classroom Solution Revenue (billion) Forecast, by Application 2020 & 2033
- Table 42: Japan Smart Classroom Solution Revenue (billion) Forecast, by Application 2020 & 2033
- Table 43: South Korea Smart Classroom Solution Revenue (billion) Forecast, by Application 2020 & 2033
- Table 44: ASEAN Smart Classroom Solution Revenue (billion) Forecast, by Application 2020 & 2033
- Table 45: Oceania Smart Classroom Solution Revenue (billion) Forecast, by Application 2020 & 2033
- Table 46: Rest of Asia Pacific Smart Classroom Solution Revenue (billion) Forecast, by Application 2020 & 2033
Frequently Asked Questions
1. What is the projected Compound Annual Growth Rate (CAGR) of the Smart Classroom Solution?
The projected CAGR is approximately 9.85%.
2. Which companies are prominent players in the Smart Classroom Solution?
Key companies in the market include Huawei, ATEN, Vantage Avcom, Q-NEX, Softlogic, Samsung, Hitachi, Panasonic, Ebix SmartClass, Next Education India, Educomp Group, Smart Technologies, Cybernetyx Technik, Extramarks, Globus Infocom, NIIT Technologies, NetDragon Education.
3. What are the main segments of the Smart Classroom Solution?
The market segments include Application, Types.
4. Can you provide details about the market size?
The market size is estimated to be USD 7.46 billion as of 2022.
5. What are some drivers contributing to market growth?
N/A
6. What are the notable trends driving market growth?
N/A
7. Are there any restraints impacting market growth?
N/A
8. Can you provide examples of recent developments in the market?
N/A
9. What pricing options are available for accessing the report?
Pricing options include single-user, multi-user, and enterprise licenses priced at USD 4900.00, USD 7350.00, and USD 9800.00 respectively.
10. Is the market size provided in terms of value or volume?
The market size is provided in terms of value, measured in billion.
11. Are there any specific market keywords associated with the report?
Yes, the market keyword associated with the report is "Smart Classroom Solution," which aids in identifying and referencing the specific market segment covered.
12. How do I determine which pricing option suits my needs best?
The pricing options vary based on user requirements and access needs. Individual users may opt for single-user licenses, while businesses requiring broader access may choose multi-user or enterprise licenses for cost-effective access to the report.
13. Are there any additional resources or data provided in the Smart Classroom Solution report?
While the report offers comprehensive insights, it's advisable to review the specific contents or supplementary materials provided to ascertain if additional resources or data are available.
14. How can I stay updated on further developments or reports in the Smart Classroom Solution?
To stay informed about further developments, trends, and reports in the Smart Classroom Solution, consider subscribing to industry newsletters, following relevant companies and organizations, or regularly checking reputable industry news sources and publications.
Methodology
Step 1 - Identification of Relevant Samples Size from Population Database


Step 2 - Approaches for Defining Global Market Size (Value, Volume* & Price*)

Note*: In applicable scenarios
Step 3 - Data Sources
Primary Research
- Web Analytics
- Survey Reports
- Research Institute
- Latest Research Reports
- Opinion Leaders
Secondary Research
- Annual Reports
- White Paper
- Latest Press Release
- Industry Association
- Paid Database
- Investor Presentations

Step 4 - Data Triangulation
Involves using different sources of information in order to increase the validity of a study
These sources are likely to be stakeholders in a program - participants, other researchers, program staff, other community members, and so on.
Then we put all data in single framework & apply various statistical tools to find out the dynamic on the market.
During the analysis stage, feedback from the stakeholder groups would be compared to determine areas of agreement as well as areas of divergence