

Key Insights
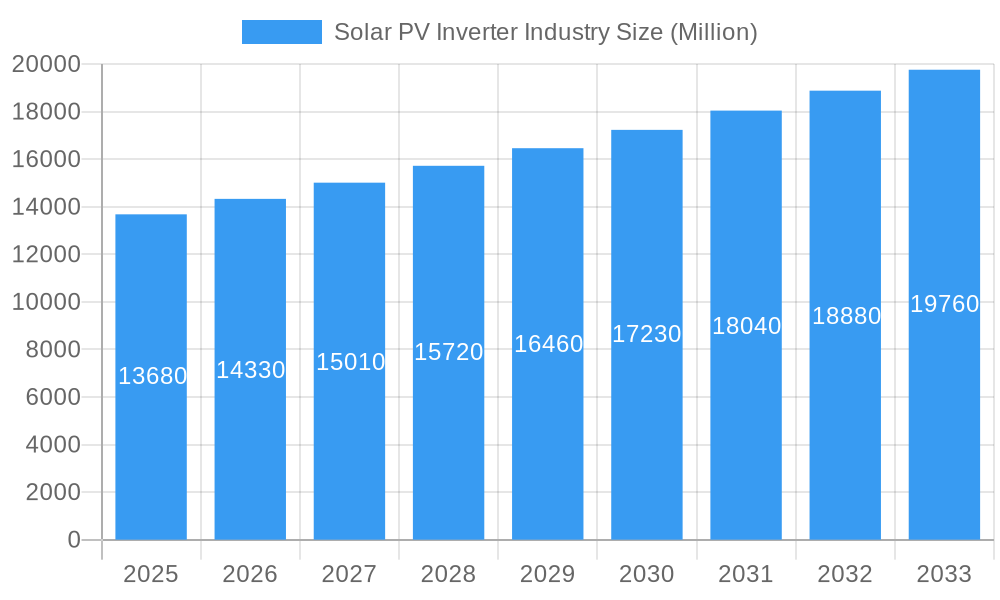
The global solar PV inverter market, valued at $13.68 billion in 2025, is projected to experience robust growth, driven by the increasing adoption of solar photovoltaic (PV) systems worldwide. A compound annual growth rate (CAGR) of 4.73% is anticipated from 2025 to 2033, indicating a significant expansion in market size. Key drivers include government initiatives promoting renewable energy, declining solar panel costs making solar power more affordable, and the rising demand for grid stability and efficient energy management solutions. Emerging trends such as the increasing adoption of smart inverters with enhanced monitoring and control capabilities, along with the growing integration of energy storage systems (ESS) into PV systems, are further fueling market growth. String inverters currently dominate the market due to their cost-effectiveness, but microinverters and central inverters are gaining traction due to improved performance and reliability, particularly in large-scale utility projects. The residential sector is a significant market segment, but rapid growth is anticipated in the commercial and industrial sectors as businesses seek cost-efficient and environmentally sustainable power solutions. Geographic expansion is also driving growth, with significant potential in developing economies in Asia-Pacific and South America, alongside continued strong growth in established markets like North America and Europe. However, factors such as the intermittent nature of solar power, requiring grid infrastructure improvements, and potential supply chain disruptions could act as restraints on market growth.
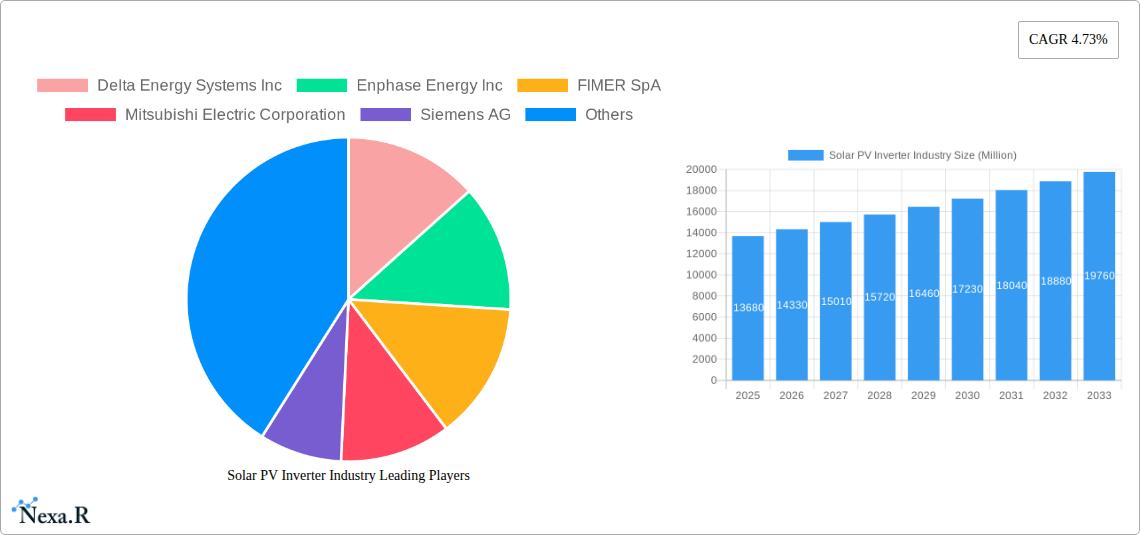
Solar PV Inverter Industry Market Size (In Billion)
Despite these restraints, the long-term outlook for the solar PV inverter market remains positive. Technological advancements, such as increased efficiency and power density in inverters, will continue to drive innovation and attract investments. The integration of artificial intelligence and machine learning for improved performance and predictive maintenance will also play a crucial role. Major players like Delta Energy Systems, Enphase Energy, SMA Solar Technology, and SolarEdge Technologies are leading the innovation, with strategic partnerships and mergers and acquisitions shaping the competitive landscape. As the global focus shifts towards sustainable energy solutions, the solar PV inverter market is well-positioned to benefit from this sustained increase in demand. The market segmentation by inverter type (central, string, micro) and application (residential, commercial & industrial, utility-scale) allows for targeted investment and technological innovation to best meet specific energy demands across different sectors and geographic locations.
Solar PV Inverter Industry Company Market Share
This comprehensive report provides a detailed analysis of the Solar PV Inverter industry, encompassing market dynamics, growth trends, regional segmentation, product landscape, and key player analysis. The study covers the period from 2019 to 2033, with a focus on the forecast period 2025-2033 and a base year of 2025. The report caters to industry professionals, investors, and researchers seeking in-depth insights into this rapidly evolving market. Parent market: Renewable Energy; Child market: Solar Energy Equipment.
Solar PV Inverter Industry Market Dynamics & Structure
The global solar PV inverter market is characterized by a moderately concentrated landscape, with several major players holding significant market share. Technological innovation, driven by increasing demand for higher efficiency and improved grid integration, is a key driver. Stringent regulatory frameworks concerning grid stability and safety standards influence market dynamics. Competitive pressures stem from both established players and emerging companies offering innovative solutions. End-user demographics are shifting towards a greater emphasis on large-scale utility applications, alongside continued growth in residential and commercial & industrial sectors. Mergers and acquisitions (M&A) activity has been relatively active, reflecting consolidation efforts and strategic expansion moves within the industry.
- Market Concentration: The top 5 players account for approximately xx% of the market share (2024).
- Technological Innovation: Focus on higher power density, improved efficiency, and smart grid integration.
- Regulatory Frameworks: Stringent grid codes and safety standards impact product design and deployment.
- Competitive Substitutes: Limited direct substitutes, but competition from other energy technologies exists.
- M&A Trends: xx M&A deals recorded in the period 2019-2024, with a value of approximately xx Million USD.
- Innovation Barriers: High R&D costs, stringent certification processes, and intellectual property protection.
Solar PV Inverter Industry Growth Trends & Insights
The global solar PV inverter market exhibited strong growth during the historical period (2019-2024), driven by the increasing adoption of solar photovoltaic (PV) systems globally. The market size is projected to reach xx Million units by 2025, growing at a CAGR of xx% during the forecast period (2025-2033). This growth is attributable to several factors: decreasing solar PV system costs, supportive government policies and incentives promoting renewable energy adoption, and increasing awareness of the environmental benefits of solar energy. Technological advancements, such as the development of more efficient inverters with improved functionalities, are further stimulating market expansion. Consumer behavior shifts towards environmentally conscious energy solutions and energy independence also contribute significantly. The increasing integration of energy storage systems alongside solar PV systems also fuels demand for advanced inverters.
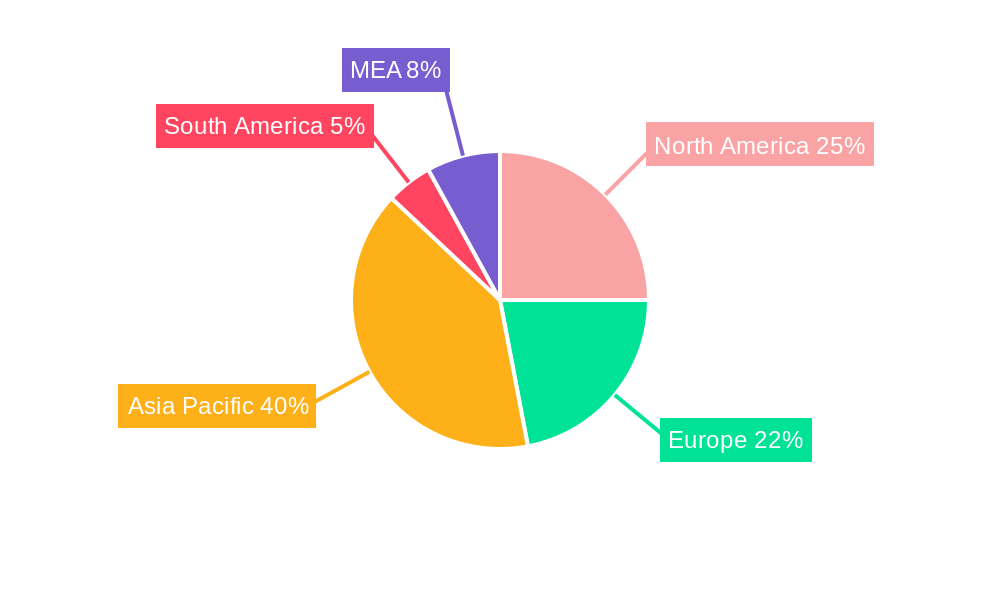
Dominant Regions, Countries, or Segments in Solar PV Inverter Industry
The Asia-Pacific region is currently the dominant market for solar PV inverters, driven by substantial solar energy projects, particularly in China and India. Europe and North America also represent significant markets, characterized by high adoption rates of residential and commercial solar PV systems. Within the segments, string inverters maintain the largest market share due to their cost-effectiveness and suitability for a wide range of applications. However, microinverters are witnessing rapid growth, fueled by their superior energy yield and simplified installation advantages. The utility-scale segment dominates in terms of total installed capacity, reflecting the large-scale solar power projects undertaken globally.
- Key Drivers (Asia-Pacific): Large-scale solar installations, supportive government policies, and decreasing manufacturing costs.
- Key Drivers (Europe & North America): High renewable energy targets, rising energy costs, and increasing environmental awareness.
- Segment Dominance: String inverters (xx Million units in 2025), followed by central inverters (xx Million units in 2025) and microinverters (xx Million units in 2025).
- Application Dominance: Utility-scale (xx Million units in 2025), followed by commercial and industrial (xx Million units in 2025), and residential (xx Million units in 2025).
Solar PV Inverter Industry Product Landscape
The solar PV inverter market offers a diverse range of products, categorized primarily by inverter type (central, string, micro) and application (residential, commercial & industrial, utility-scale). Recent innovations focus on enhancing efficiency, power density, and grid integration capabilities. Many manufacturers offer inverters with advanced monitoring and communication features, enabling remote monitoring and optimization of PV systems. Key selling propositions include high efficiency, simplified installation, and robust grid compliance. Technological advancements are focused on maximizing energy yield, reducing operational costs, and improving system reliability.
Key Drivers, Barriers & Challenges in Solar PV Inverter Industry
Key Drivers:
- Increasing adoption of renewable energy globally.
- Favorable government policies and incentives.
- Decreasing costs of solar PV systems.
- Technological advancements enhancing inverter efficiency and functionality.
Challenges:
- Supply chain disruptions affecting component availability.
- Stringent regulatory standards and certification requirements.
- Intense competition from established and emerging players.
- Potential for grid instability issues with increased solar PV penetration. (Estimated impact: xx% reduction in market growth in 2024)
Emerging Opportunities in Solar PV Inverter Industry
- Growing demand for energy storage systems integrated with solar PV systems.
- Expansion into emerging markets with high solar irradiation potential.
- Development of smart inverters with advanced grid management capabilities.
- Increasing focus on improving the recyclability and sustainability of inverters.
Growth Accelerators in the Solar PV Inverter Industry
Technological advancements in power electronics, strategic partnerships between inverter manufacturers and solar PV developers, and expansion into new geographical markets are accelerating growth. The rising adoption of Artificial Intelligence (AI) and Machine Learning (ML) for predictive maintenance and performance optimization will further enhance the value proposition of solar PV inverters.
Key Players Shaping the Solar PV Inverter Industry Market
- Delta Energy Systems Inc
- Enphase Energy Inc
- FIMER SpA
- Mitsubishi Electric Corporation
- Siemens AG
- Schneider Electric SE
- Omron Corporation
- Huawei Technologies Co Ltd
- SolarEdge Technologies Inc
- General Electric Company
- SMA Solar Technology AG
Notable Milestones in Solar PV Inverter Industry Sector
- April 2022: SMA Solar Technology AG launched a new line of four inverters (12kW, 15kW, 20kW, 25kW) for rooftop PV systems up to 135kW.
- May 2022: Fimer SpA supplied 1 MVA inverters to an 18MWh battery energy storage project in Gujarat, India.
In-Depth Solar PV Inverter Industry Market Outlook
The solar PV inverter market is poised for continued strong growth over the forecast period, driven by the global transition towards renewable energy and the increasing affordability of solar PV systems. Strategic partnerships, technological innovations focusing on efficiency and smart grid integration, and expansion into emerging markets will be key factors shaping the industry's future. The potential for significant market expansion exists, particularly in developing economies with high solar irradiation and expanding energy demands.
Solar PV Inverter Industry Segmentation
-
1. Inverter Type
- 1.1. Central Inverters
- 1.2. String Inverters
- 1.3. Micro Inverters
-
2. Application
- 2.1. Residential
- 2.2. Commercial and Industrial
- 2.3. Utility-scale
Solar PV Inverter Industry Segmentation By Geography
- 1. North America
- 2. Europe
- 3. Asia Pacific
- 4. South America
- 5. Middle East and Africa
Solar PV Inverter Industry Regional Market Share
Geographic Coverage of Solar PV Inverter Industry
Solar PV Inverter Industry REPORT HIGHLIGHTS
| Aspects | Details |
|---|---|
| Study Period | 2020-2034 |
| Base Year | 2025 |
| Estimated Year | 2026 |
| Forecast Period | 2026-2034 |
| Historical Period | 2020-2025 |
| Growth Rate | CAGR of 4.73% from 2020-2034 |
| Segmentation |
|
Table of Contents
- 1. Introduction
- 1.1. Research Scope
- 1.2. Market Segmentation
- 1.3. Research Objective
- 1.4. Definitions and Assumptions
- 2. Executive Summary
- 2.1. Market Snapshot
- 3. Market Dynamics
- 3.1. Market Drivers
- 3.2. Market Restrains
- 3.3. Market Trends
- 3.4. Market Opportunities
- 4. Market Factor Analysis
- 4.1. Porters Five Forces
- 4.1.1. Bargaining Power of Suppliers
- 4.1.2. Bargaining Power of Buyers
- 4.1.3. Threat of New Entrants
- 4.1.4. Threat of Substitutes
- 4.1.5. Competitive Rivalry
- 4.2. PESTEL analysis
- 4.3. BCG Analysis
- 4.3.1. Stars (High Growth, High Market Share)
- 4.3.2. Cash Cows (Low Growth, High Market Share)
- 4.3.3. Question Mark (High Growth, Low Market Share)
- 4.3.4. Dogs (Low Growth, Low Market Share)
- 4.4. Ansoff Matrix Analysis
- 4.5. Supply Chain Analysis
- 4.6. Regulatory Landscape
- 4.7. Current Market Potential and Opportunity Assessment (TAM–SAM–SOM Framework)
- 4.8. NRP Analyst Note
- 4.1. Porters Five Forces
- 5. Market Analysis, Insights and Forecast 2021-2033
- 5.1. Market Analysis, Insights and Forecast - by Inverter Type
- 5.1.1. Central Inverters
- 5.1.2. String Inverters
- 5.1.3. Micro Inverters
- 5.2. Market Analysis, Insights and Forecast - by Application
- 5.2.1. Residential
- 5.2.2. Commercial and Industrial
- 5.2.3. Utility-scale
- 5.3. Market Analysis, Insights and Forecast - by Region
- 5.3.1. North America
- 5.3.2. Europe
- 5.3.3. Asia Pacific
- 5.3.4. South America
- 5.3.5. Middle East and Africa
- 5.1. Market Analysis, Insights and Forecast - by Inverter Type
- 6. Global Solar PV Inverter Industry Analysis, Insights and Forecast, 2021-2033
- 6.1. Market Analysis, Insights and Forecast - by Inverter Type
- 6.1.1. Central Inverters
- 6.1.2. String Inverters
- 6.1.3. Micro Inverters
- 6.2. Market Analysis, Insights and Forecast - by Application
- 6.2.1. Residential
- 6.2.2. Commercial and Industrial
- 6.2.3. Utility-scale
- 6.1. Market Analysis, Insights and Forecast - by Inverter Type
- 7. North America Solar PV Inverter Industry Analysis, Insights and Forecast, 2020-2032
- 7.1. Market Analysis, Insights and Forecast - by Inverter Type
- 7.1.1. Central Inverters
- 7.1.2. String Inverters
- 7.1.3. Micro Inverters
- 7.2. Market Analysis, Insights and Forecast - by Application
- 7.2.1. Residential
- 7.2.2. Commercial and Industrial
- 7.2.3. Utility-scale
- 7.1. Market Analysis, Insights and Forecast - by Inverter Type
- 8. Europe Solar PV Inverter Industry Analysis, Insights and Forecast, 2020-2032
- 8.1. Market Analysis, Insights and Forecast - by Inverter Type
- 8.1.1. Central Inverters
- 8.1.2. String Inverters
- 8.1.3. Micro Inverters
- 8.2. Market Analysis, Insights and Forecast - by Application
- 8.2.1. Residential
- 8.2.2. Commercial and Industrial
- 8.2.3. Utility-scale
- 8.1. Market Analysis, Insights and Forecast - by Inverter Type
- 9. Asia Pacific Solar PV Inverter Industry Analysis, Insights and Forecast, 2020-2032
- 9.1. Market Analysis, Insights and Forecast - by Inverter Type
- 9.1.1. Central Inverters
- 9.1.2. String Inverters
- 9.1.3. Micro Inverters
- 9.2. Market Analysis, Insights and Forecast - by Application
- 9.2.1. Residential
- 9.2.2. Commercial and Industrial
- 9.2.3. Utility-scale
- 9.1. Market Analysis, Insights and Forecast - by Inverter Type
- 10. South America Solar PV Inverter Industry Analysis, Insights and Forecast, 2020-2032
- 10.1. Market Analysis, Insights and Forecast - by Inverter Type
- 10.1.1. Central Inverters
- 10.1.2. String Inverters
- 10.1.3. Micro Inverters
- 10.2. Market Analysis, Insights and Forecast - by Application
- 10.2.1. Residential
- 10.2.2. Commercial and Industrial
- 10.2.3. Utility-scale
- 10.1. Market Analysis, Insights and Forecast - by Inverter Type
- 11. Middle East and Africa Solar PV Inverter Industry Analysis, Insights and Forecast, 2020-2032
- 11.1. Market Analysis, Insights and Forecast - by Inverter Type
- 11.1.1. Central Inverters
- 11.1.2. String Inverters
- 11.1.3. Micro Inverters
- 11.2. Market Analysis, Insights and Forecast - by Application
- 11.2.1. Residential
- 11.2.2. Commercial and Industrial
- 11.2.3. Utility-scale
- 11.1. Market Analysis, Insights and Forecast - by Inverter Type
- 12. Competitive Analysis
- 12.1. Company Profiles
- 12.1.1 Delta Energy Systems Inc
- 12.1.1.1. Company Overview
- 12.1.1.2. Products
- 12.1.1.3. Company Financials
- 12.1.1.4. SWOT Analysis
- 12.1.2 Enphase Energy Inc
- 12.1.2.1. Company Overview
- 12.1.2.2. Products
- 12.1.2.3. Company Financials
- 12.1.2.4. SWOT Analysis
- 12.1.3 FIMER SpA
- 12.1.3.1. Company Overview
- 12.1.3.2. Products
- 12.1.3.3. Company Financials
- 12.1.3.4. SWOT Analysis
- 12.1.4 Mitsubishi Electric Corporation
- 12.1.4.1. Company Overview
- 12.1.4.2. Products
- 12.1.4.3. Company Financials
- 12.1.4.4. SWOT Analysis
- 12.1.5 Siemens AG
- 12.1.5.1. Company Overview
- 12.1.5.2. Products
- 12.1.5.3. Company Financials
- 12.1.5.4. SWOT Analysis
- 12.1.6 Schneider Electric SE
- 12.1.6.1. Company Overview
- 12.1.6.2. Products
- 12.1.6.3. Company Financials
- 12.1.6.4. SWOT Analysis
- 12.1.7 Omron Corporation
- 12.1.7.1. Company Overview
- 12.1.7.2. Products
- 12.1.7.3. Company Financials
- 12.1.7.4. SWOT Analysis
- 12.1.8 Huawei Technologies Co Ltd*List Not Exhaustive
- 12.1.8.1. Company Overview
- 12.1.8.2. Products
- 12.1.8.3. Company Financials
- 12.1.8.4. SWOT Analysis
- 12.1.9 SolarEdge Technologies Inc
- 12.1.9.1. Company Overview
- 12.1.9.2. Products
- 12.1.9.3. Company Financials
- 12.1.9.4. SWOT Analysis
- 12.1.10 General Electric Company
- 12.1.10.1. Company Overview
- 12.1.10.2. Products
- 12.1.10.3. Company Financials
- 12.1.10.4. SWOT Analysis
- 12.1.11 SMA Solar Technology AG
- 12.1.11.1. Company Overview
- 12.1.11.2. Products
- 12.1.11.3. Company Financials
- 12.1.11.4. SWOT Analysis
- 12.1.1 Delta Energy Systems Inc
- 12.2. Market Entropy
- 12.2.1 Company's Key Areas Served
- 12.2.2 Recent Developments
- 12.3. Company Market Share Analysis 2025
- 12.3.1 Top 5 Companies Market Share Analysis
- 12.3.2 Top 3 Companies Market Share Analysis
- 12.4. List of Potential Customers
- 13. Research Methodology
List of Figures
- Figure 1: Global Solar PV Inverter Industry Revenue Breakdown (Million, %) by Region 2025 & 2033
- Figure 2: Global Solar PV Inverter Industry Volume Breakdown (K Unit, %) by Region 2025 & 2033
- Figure 3: North America Solar PV Inverter Industry Revenue (Million), by Inverter Type 2025 & 2033
- Figure 4: North America Solar PV Inverter Industry Volume (K Unit), by Inverter Type 2025 & 2033
- Figure 5: North America Solar PV Inverter Industry Revenue Share (%), by Inverter Type 2025 & 2033
- Figure 6: North America Solar PV Inverter Industry Volume Share (%), by Inverter Type 2025 & 2033
- Figure 7: North America Solar PV Inverter Industry Revenue (Million), by Application 2025 & 2033
- Figure 8: North America Solar PV Inverter Industry Volume (K Unit), by Application 2025 & 2033
- Figure 9: North America Solar PV Inverter Industry Revenue Share (%), by Application 2025 & 2033
- Figure 10: North America Solar PV Inverter Industry Volume Share (%), by Application 2025 & 2033
- Figure 11: North America Solar PV Inverter Industry Revenue (Million), by Country 2025 & 2033
- Figure 12: North America Solar PV Inverter Industry Volume (K Unit), by Country 2025 & 2033
- Figure 13: North America Solar PV Inverter Industry Revenue Share (%), by Country 2025 & 2033
- Figure 14: North America Solar PV Inverter Industry Volume Share (%), by Country 2025 & 2033
- Figure 15: Europe Solar PV Inverter Industry Revenue (Million), by Inverter Type 2025 & 2033
- Figure 16: Europe Solar PV Inverter Industry Volume (K Unit), by Inverter Type 2025 & 2033
- Figure 17: Europe Solar PV Inverter Industry Revenue Share (%), by Inverter Type 2025 & 2033
- Figure 18: Europe Solar PV Inverter Industry Volume Share (%), by Inverter Type 2025 & 2033
- Figure 19: Europe Solar PV Inverter Industry Revenue (Million), by Application 2025 & 2033
- Figure 20: Europe Solar PV Inverter Industry Volume (K Unit), by Application 2025 & 2033
- Figure 21: Europe Solar PV Inverter Industry Revenue Share (%), by Application 2025 & 2033
- Figure 22: Europe Solar PV Inverter Industry Volume Share (%), by Application 2025 & 2033
- Figure 23: Europe Solar PV Inverter Industry Revenue (Million), by Country 2025 & 2033
- Figure 24: Europe Solar PV Inverter Industry Volume (K Unit), by Country 2025 & 2033
- Figure 25: Europe Solar PV Inverter Industry Revenue Share (%), by Country 2025 & 2033
- Figure 26: Europe Solar PV Inverter Industry Volume Share (%), by Country 2025 & 2033
- Figure 27: Asia Pacific Solar PV Inverter Industry Revenue (Million), by Inverter Type 2025 & 2033
- Figure 28: Asia Pacific Solar PV Inverter Industry Volume (K Unit), by Inverter Type 2025 & 2033
- Figure 29: Asia Pacific Solar PV Inverter Industry Revenue Share (%), by Inverter Type 2025 & 2033
- Figure 30: Asia Pacific Solar PV Inverter Industry Volume Share (%), by Inverter Type 2025 & 2033
- Figure 31: Asia Pacific Solar PV Inverter Industry Revenue (Million), by Application 2025 & 2033
- Figure 32: Asia Pacific Solar PV Inverter Industry Volume (K Unit), by Application 2025 & 2033
- Figure 33: Asia Pacific Solar PV Inverter Industry Revenue Share (%), by Application 2025 & 2033
- Figure 34: Asia Pacific Solar PV Inverter Industry Volume Share (%), by Application 2025 & 2033
- Figure 35: Asia Pacific Solar PV Inverter Industry Revenue (Million), by Country 2025 & 2033
- Figure 36: Asia Pacific Solar PV Inverter Industry Volume (K Unit), by Country 2025 & 2033
- Figure 37: Asia Pacific Solar PV Inverter Industry Revenue Share (%), by Country 2025 & 2033
- Figure 38: Asia Pacific Solar PV Inverter Industry Volume Share (%), by Country 2025 & 2033
- Figure 39: South America Solar PV Inverter Industry Revenue (Million), by Inverter Type 2025 & 2033
- Figure 40: South America Solar PV Inverter Industry Volume (K Unit), by Inverter Type 2025 & 2033
- Figure 41: South America Solar PV Inverter Industry Revenue Share (%), by Inverter Type 2025 & 2033
- Figure 42: South America Solar PV Inverter Industry Volume Share (%), by Inverter Type 2025 & 2033
- Figure 43: South America Solar PV Inverter Industry Revenue (Million), by Application 2025 & 2033
- Figure 44: South America Solar PV Inverter Industry Volume (K Unit), by Application 2025 & 2033
- Figure 45: South America Solar PV Inverter Industry Revenue Share (%), by Application 2025 & 2033
- Figure 46: South America Solar PV Inverter Industry Volume Share (%), by Application 2025 & 2033
- Figure 47: South America Solar PV Inverter Industry Revenue (Million), by Country 2025 & 2033
- Figure 48: South America Solar PV Inverter Industry Volume (K Unit), by Country 2025 & 2033
- Figure 49: South America Solar PV Inverter Industry Revenue Share (%), by Country 2025 & 2033
- Figure 50: South America Solar PV Inverter Industry Volume Share (%), by Country 2025 & 2033
- Figure 51: Middle East and Africa Solar PV Inverter Industry Revenue (Million), by Inverter Type 2025 & 2033
- Figure 52: Middle East and Africa Solar PV Inverter Industry Volume (K Unit), by Inverter Type 2025 & 2033
- Figure 53: Middle East and Africa Solar PV Inverter Industry Revenue Share (%), by Inverter Type 2025 & 2033
- Figure 54: Middle East and Africa Solar PV Inverter Industry Volume Share (%), by Inverter Type 2025 & 2033
- Figure 55: Middle East and Africa Solar PV Inverter Industry Revenue (Million), by Application 2025 & 2033
- Figure 56: Middle East and Africa Solar PV Inverter Industry Volume (K Unit), by Application 2025 & 2033
- Figure 57: Middle East and Africa Solar PV Inverter Industry Revenue Share (%), by Application 2025 & 2033
- Figure 58: Middle East and Africa Solar PV Inverter Industry Volume Share (%), by Application 2025 & 2033
- Figure 59: Middle East and Africa Solar PV Inverter Industry Revenue (Million), by Country 2025 & 2033
- Figure 60: Middle East and Africa Solar PV Inverter Industry Volume (K Unit), by Country 2025 & 2033
- Figure 61: Middle East and Africa Solar PV Inverter Industry Revenue Share (%), by Country 2025 & 2033
- Figure 62: Middle East and Africa Solar PV Inverter Industry Volume Share (%), by Country 2025 & 2033
List of Tables
- Table 1: Global Solar PV Inverter Industry Revenue Million Forecast, by Inverter Type 2020 & 2033
- Table 2: Global Solar PV Inverter Industry Volume K Unit Forecast, by Inverter Type 2020 & 2033
- Table 3: Global Solar PV Inverter Industry Revenue Million Forecast, by Application 2020 & 2033
- Table 4: Global Solar PV Inverter Industry Volume K Unit Forecast, by Application 2020 & 2033
- Table 5: Global Solar PV Inverter Industry Revenue Million Forecast, by Region 2020 & 2033
- Table 6: Global Solar PV Inverter Industry Volume K Unit Forecast, by Region 2020 & 2033
- Table 7: Global Solar PV Inverter Industry Revenue Million Forecast, by Inverter Type 2020 & 2033
- Table 8: Global Solar PV Inverter Industry Volume K Unit Forecast, by Inverter Type 2020 & 2033
- Table 9: Global Solar PV Inverter Industry Revenue Million Forecast, by Application 2020 & 2033
- Table 10: Global Solar PV Inverter Industry Volume K Unit Forecast, by Application 2020 & 2033
- Table 11: Global Solar PV Inverter Industry Revenue Million Forecast, by Country 2020 & 2033
- Table 12: Global Solar PV Inverter Industry Volume K Unit Forecast, by Country 2020 & 2033
- Table 13: Global Solar PV Inverter Industry Revenue Million Forecast, by Inverter Type 2020 & 2033
- Table 14: Global Solar PV Inverter Industry Volume K Unit Forecast, by Inverter Type 2020 & 2033
- Table 15: Global Solar PV Inverter Industry Revenue Million Forecast, by Application 2020 & 2033
- Table 16: Global Solar PV Inverter Industry Volume K Unit Forecast, by Application 2020 & 2033
- Table 17: Global Solar PV Inverter Industry Revenue Million Forecast, by Country 2020 & 2033
- Table 18: Global Solar PV Inverter Industry Volume K Unit Forecast, by Country 2020 & 2033
- Table 19: Global Solar PV Inverter Industry Revenue Million Forecast, by Inverter Type 2020 & 2033
- Table 20: Global Solar PV Inverter Industry Volume K Unit Forecast, by Inverter Type 2020 & 2033
- Table 21: Global Solar PV Inverter Industry Revenue Million Forecast, by Application 2020 & 2033
- Table 22: Global Solar PV Inverter Industry Volume K Unit Forecast, by Application 2020 & 2033
- Table 23: Global Solar PV Inverter Industry Revenue Million Forecast, by Country 2020 & 2033
- Table 24: Global Solar PV Inverter Industry Volume K Unit Forecast, by Country 2020 & 2033
- Table 25: Global Solar PV Inverter Industry Revenue Million Forecast, by Inverter Type 2020 & 2033
- Table 26: Global Solar PV Inverter Industry Volume K Unit Forecast, by Inverter Type 2020 & 2033
- Table 27: Global Solar PV Inverter Industry Revenue Million Forecast, by Application 2020 & 2033
- Table 28: Global Solar PV Inverter Industry Volume K Unit Forecast, by Application 2020 & 2033
- Table 29: Global Solar PV Inverter Industry Revenue Million Forecast, by Country 2020 & 2033
- Table 30: Global Solar PV Inverter Industry Volume K Unit Forecast, by Country 2020 & 2033
- Table 31: Global Solar PV Inverter Industry Revenue Million Forecast, by Inverter Type 2020 & 2033
- Table 32: Global Solar PV Inverter Industry Volume K Unit Forecast, by Inverter Type 2020 & 2033
- Table 33: Global Solar PV Inverter Industry Revenue Million Forecast, by Application 2020 & 2033
- Table 34: Global Solar PV Inverter Industry Volume K Unit Forecast, by Application 2020 & 2033
- Table 35: Global Solar PV Inverter Industry Revenue Million Forecast, by Country 2020 & 2033
- Table 36: Global Solar PV Inverter Industry Volume K Unit Forecast, by Country 2020 & 2033
Frequently Asked Questions
1. What is the projected Compound Annual Growth Rate (CAGR) of the Solar PV Inverter Industry?
The projected CAGR is approximately 4.73%.
2. Which companies are prominent players in the Solar PV Inverter Industry?
Key companies in the market include Delta Energy Systems Inc, Enphase Energy Inc, FIMER SpA, Mitsubishi Electric Corporation, Siemens AG, Schneider Electric SE, Omron Corporation, Huawei Technologies Co Ltd*List Not Exhaustive, SolarEdge Technologies Inc, General Electric Company, SMA Solar Technology AG.
3. What are the main segments of the Solar PV Inverter Industry?
The market segments include Inverter Type, Application.
4. Can you provide details about the market size?
The market size is estimated to be USD 13.68 Million as of 2022.
5. What are some drivers contributing to market growth?
4.; Supportive Government Initiatives4.; Investment in Electrification Using Solar Energy.
6. What are the notable trends driving market growth?
Central Inverters Segment Expected to Dominate the Market.
7. Are there any restraints impacting market growth?
4.; Lack of General Awareness. Infrastructure Development Costs. and Recent Subsidy Cuts on Solar Panels.
8. Can you provide examples of recent developments in the market?
In April 2022, SMA Solar Technology AG, a German inverter manufacturer, launched a new line of four inverters with power ratings of 12kW, 15kW, 20kW, and 25kW for use in rooftop PV systems up to 135kW in size.
9. What pricing options are available for accessing the report?
Pricing options include single-user, multi-user, and enterprise licenses priced at USD 4750, USD 5250, and USD 8750 respectively.
10. Is the market size provided in terms of value or volume?
The market size is provided in terms of value, measured in Million and volume, measured in K Unit.
11. Are there any specific market keywords associated with the report?
Yes, the market keyword associated with the report is "Solar PV Inverter Industry," which aids in identifying and referencing the specific market segment covered.
12. How do I determine which pricing option suits my needs best?
The pricing options vary based on user requirements and access needs. Individual users may opt for single-user licenses, while businesses requiring broader access may choose multi-user or enterprise licenses for cost-effective access to the report.
13. Are there any additional resources or data provided in the Solar PV Inverter Industry report?
While the report offers comprehensive insights, it's advisable to review the specific contents or supplementary materials provided to ascertain if additional resources or data are available.
14. How can I stay updated on further developments or reports in the Solar PV Inverter Industry?
To stay informed about further developments, trends, and reports in the Solar PV Inverter Industry, consider subscribing to industry newsletters, following relevant companies and organizations, or regularly checking reputable industry news sources and publications.
Methodology
Step 1 - Identification of Relevant Samples Size from Population Database


Step 2 - Approaches for Defining Global Market Size (Value, Volume* & Price*)

Note*: In applicable scenarios
Step 3 - Data Sources
Primary Research
- Web Analytics
- Survey Reports
- Research Institute
- Latest Research Reports
- Opinion Leaders
Secondary Research
- Annual Reports
- White Paper
- Latest Press Release
- Industry Association
- Paid Database
- Investor Presentations

Step 4 - Data Triangulation
Involves using different sources of information in order to increase the validity of a study
These sources are likely to be stakeholders in a program - participants, other researchers, program staff, other community members, and so on.
Then we put all data in single framework & apply various statistical tools to find out the dynamic on the market.
During the analysis stage, feedback from the stakeholder groups would be compared to determine areas of agreement as well as areas of divergence