

Key Insights
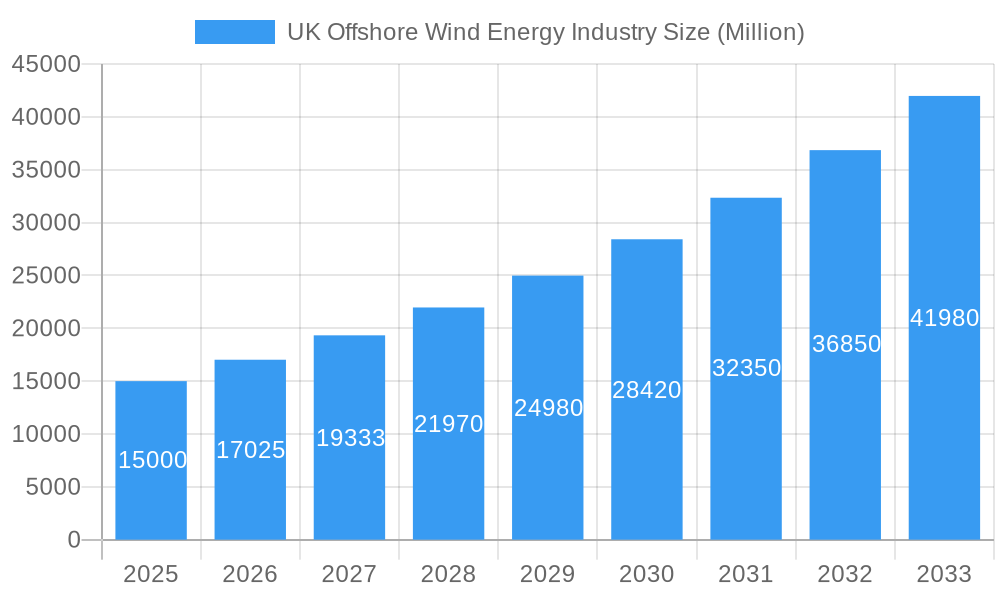
The UK offshore wind energy market is experiencing substantial expansion, propelled by government mandates for renewable energy and declining offshore wind technology costs. The market, valued at £55.9 billion in 2024, is projected for significant growth throughout the forecast period (2024-2033), with a Compound Annual Growth Rate (CAGR) of 14.6%. Key growth drivers include favorable government initiatives such as Contracts for Difference (CfD) auctions, enhanced investor confidence due to reduced Levelized Cost of Energy (LCOE), and advancements in turbine technology leading to greater capacity and efficiency. The market is segmented by foundation type (fixed and floating) and capacity (under 5 MW and 5 MW or more), with larger capacity segments showing accelerated growth due to economies of scale. Floating foundation technology is a critical emerging trend, unlocking deeper water resource potential and broadening the geographical scope of offshore wind farms. Despite this positive outlook, challenges persist, including intricate permitting procedures, substantial investment requirements for grid infrastructure upgrades, and potential environmental impacts necessitating careful ecological management.
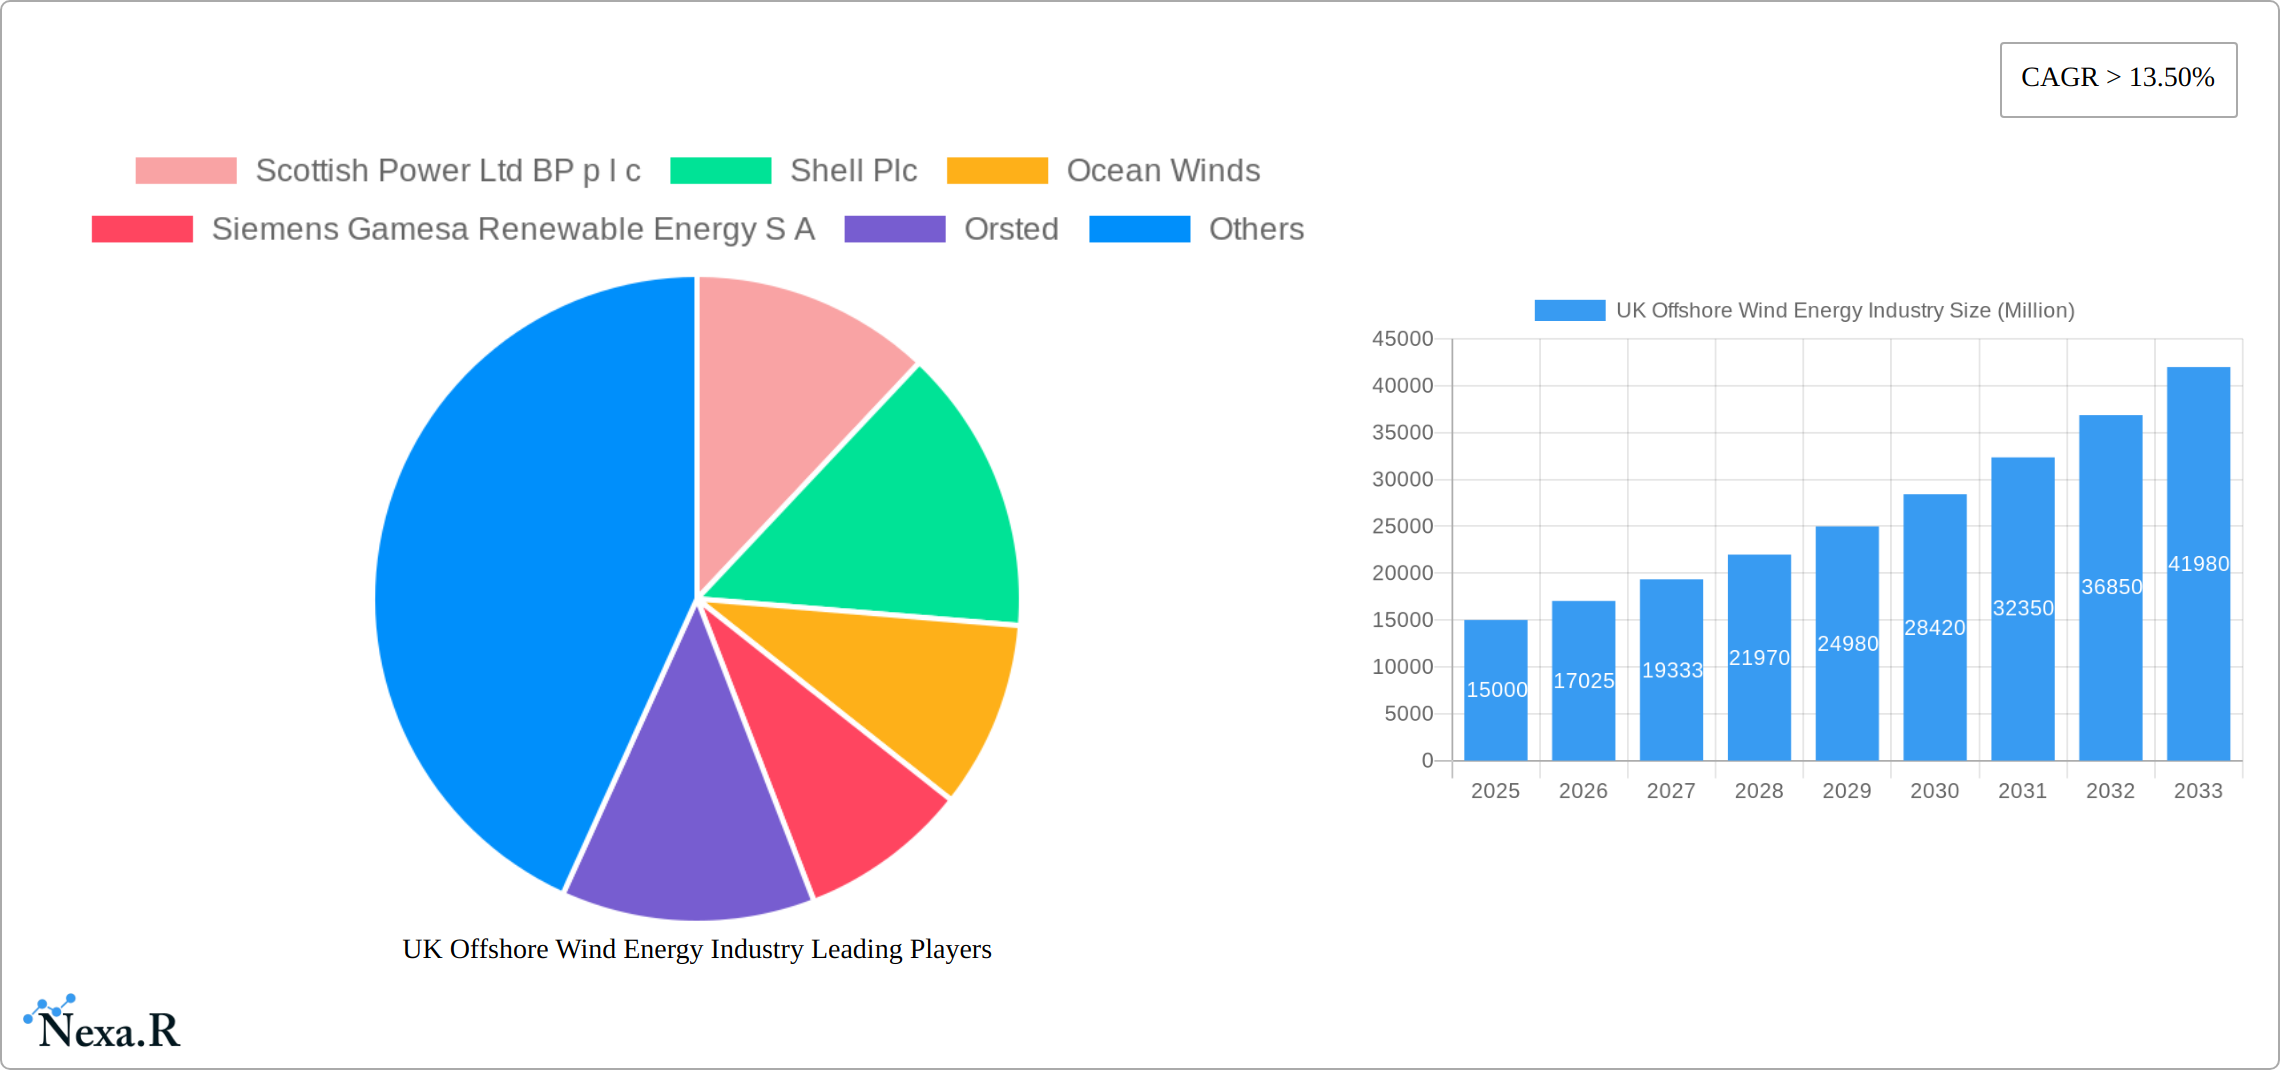
UK Offshore Wind Energy Industry Market Size (In Billion)
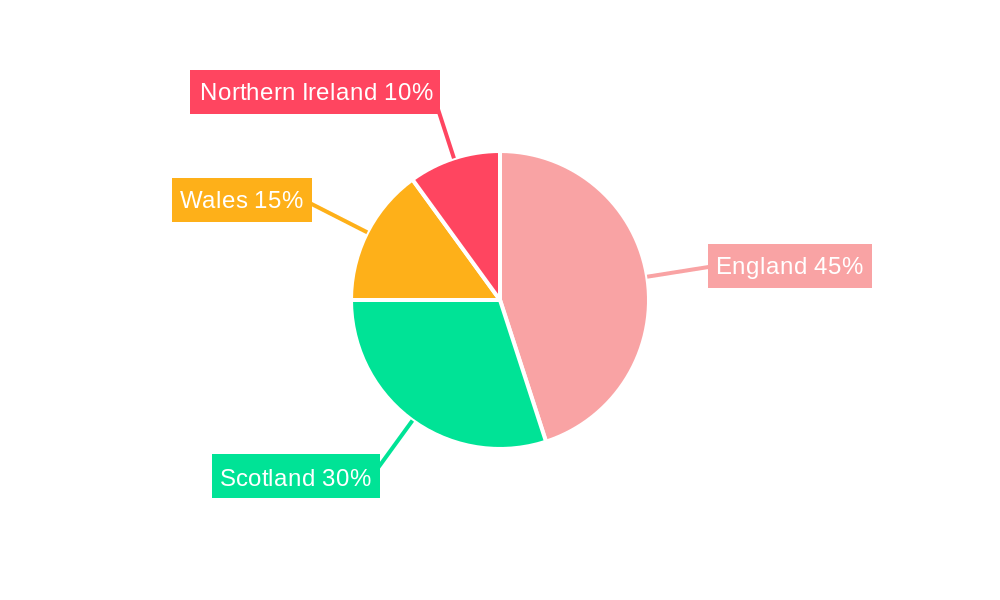
Leading companies such as Scottish Power, BP, Shell, and Ørsted are instrumental in shaping the market through project development, investment, and technological innovation. Regional development is concentrated across England, Wales, Scotland, and Northern Ireland, with varying potential based on geography and resource availability. The market's future success depends on sustained government backing, continuous technological advancements, and effective management of environmental and logistical hurdles. The forecast period (2024-2033) presents considerable opportunities for both established and emerging players in this dynamic sector. Overcoming these challenges will be vital to fully realize the UK's offshore wind energy potential and contribute to national decarbonization objectives.
UK Offshore Wind Energy Industry Company Market Share
UK Offshore Wind Energy Industry Market Report: 2019-2033
This comprehensive report provides a detailed analysis of the UK offshore wind energy industry, encompassing market dynamics, growth trends, dominant segments, and key players. The study period spans 2019-2033, with 2025 serving as both the base and estimated year. This report is essential for industry professionals, investors, and policymakers seeking a thorough understanding of this rapidly evolving sector.
Keywords: UK Offshore Wind Energy, Offshore Wind Farms, Fixed Foundation, Floating Foundation, Wind Turbine Capacity, Renewable Energy, Scottish Power, BP, Shell, Orsted, Siemens Gamesa, Ocean Winds, EDF Renewables, Vattenfall, Vestas, GE Renewable Energy, Renewable Energy Investment, UK Energy Market, Green Energy, Energy Transition.
UK Offshore Wind Energy Industry Market Dynamics & Structure
The UK offshore wind energy market is experiencing dynamic growth, fueled by ambitious government net-zero targets, continuous technological advancements, and escalating environmental concerns. While market concentration remains moderate, with several key players competing for market share, the landscape is characterized by significant mergers and acquisitions (M&A) activity, indicative of industry consolidation and substantial investment. Technological innovation is paramount, particularly in the development of floating foundation technology for deeper water deployment and the deployment of increasingly larger turbine capacities. The regulatory framework, though generally supportive, presents complexities in permitting and policy changes that impact project timelines. While onshore wind and solar power offer competitive alternatives, offshore wind maintains a significant advantage due to its higher capacity factors and consistent energy generation. The end-user base encompasses a diverse range of stakeholders, including major energy providers, independent power producers, and large industrial energy consumers.
- Market Concentration: Moderate, with the top 5 players holding approximately [Insert Percentage]% market share in 2025. This is expected to [Increase/Decrease/Remain Stable] over the forecast period.
- Technological Innovation: Significant focus on increasing turbine capacity (≥15MW) and the maturation of floating foundation technology for deeper water deployment, significantly expanding exploitable resources.
- Regulatory Framework: While supportive of growth, the regulatory landscape remains subject to ongoing policy revisions and permitting process refinements, creating uncertainty and potentially impacting project development schedules.
- Competitive Substitutes: Onshore wind and solar power present competitive alternatives; however, offshore wind's superior capacity factors and consistent energy output offer a compelling advantage, particularly in meeting baseload energy demands.
- M&A Activity: High volume of mergers and acquisitions, totaling [Insert Amount] billion GBP in the period 2019-2024, indicating strong investor confidence and industry consolidation.
- Innovation Barriers: High capital expenditure, complex permitting processes, and the inherent technological challenges associated with deep-water installations remain significant hurdles to overcome.
UK Offshore Wind Energy Industry Growth Trends & Insights
The UK offshore wind energy market demonstrates robust and sustained growth, driven by government policies aligned with net-zero targets and substantial private investment. The market has expanded significantly between 2019 and 2024, and this positive trajectory is projected to continue. The adoption rate of offshore wind technology is accelerating, fueled by consistent cost reductions and ongoing technological enhancements. Technological advancements, particularly in turbine design and foundation solutions, are continuously improving efficiency and driving down the levelized cost of energy (LCOE). A notable shift in consumer behaviour toward renewable energy sources is further bolstering market demand. The industry is also witnessing increasing focus on the development of supply chain infrastructure to support future project delivery.
- Market Size (GW): [Insert 2019 Value] in 2019, [Insert 2024 Value] in 2024, [Insert 2025 Value] in 2025, [Insert 2033 Value] in 2033.
- CAGR (2025-2033): [Insert CAGR]%
- Market Penetration: [Insert Percentage]% of total electricity generation by 2033, contributing significantly to the UK's renewable energy targets.
Dominant Regions, Countries, or Segments in UK Offshore Wind Energy Industry
Scotland and the North Sea are currently the leading regions, primarily due to favourable wind conditions and substantial government support. Fixed foundation technology dominates the market due to its maturity and lower costs, but Floating Foundation capacity is expected to grow significantly, driven by access to deeper waters. Larger capacity turbines (≥5MW) are becoming increasingly prevalent.
- Dominant Region: Scotland and the North Sea
- Key Drivers (Scotland): Favorable wind resources, government incentives, and established supply chains.
- Key Drivers (Floating Foundation): Ability to harness resources in deeper waters, expanding potential capacity.
- Market Share (Fixed Foundation): xx% in 2025
- Market Share (Floating Foundation): xx% in 2025
- Growth Potential (Floating Foundation): High due to untapped deep-water resources.
UK Offshore Wind Energy Industry Product Landscape
The product landscape is dominated by high-capacity wind turbines, employing advanced technologies such as improved blade designs, efficient generators, and smart control systems. These advancements lead to increased energy output and greater reliability. Key innovations focus on improving turbine lifespan, reducing operational costs, and enhancing grid integration capabilities. Floating foundation technologies represent a significant innovation, enabling access to previously inaccessible offshore wind resources.
Key Drivers, Barriers & Challenges in UK Offshore Wind Energy Industry
Key Drivers:
- Stringent government policies and ambitious targets for renewable energy integration.
- Continuous decline in the cost of wind turbine technology, making it increasingly competitive.
- Rising demand for renewable energy from consumers and businesses alike.
- Growing public awareness and concern regarding climate change, driving support for sustainable energy solutions.
- Technological innovation leading to greater efficiencies and reduced LCOE.
Challenges & Restraints:
- Supply chain bottlenecks and potential material shortages, which may delay project timelines.
- High initial capital expenditure requirements, necessitating significant investment.
- Regulatory hurdles and permitting delays, which can hinder project development speed.
- Limitations in grid infrastructure and integration challenges, requiring substantial grid upgrades.
- Competition for offshore space and resources amongst various marine users.
- Potential for increased community opposition and environmental concerns.
Emerging Opportunities in UK Offshore Wind Energy Industry
- Floating Offshore Wind: Unlocking significant growth potential in deeper waters, expanding the geographically available resource.
- Hybrid Projects: Combining offshore wind with other renewable energy sources (e.g., wave, tidal, solar) to create more diversified and resilient energy systems.
- Green Hydrogen Production: Leveraging offshore wind power for green hydrogen electrolysis, offering a pathway to decarbonize heavy industries and transportation.
- Offshore Wind Farm Optimization: Implementation of advanced data analytics and AI to improve operational efficiency, reduce downtime, and maximize energy output.
- Digitalization and Automation: Utilizing technology to enhance operational efficiency, predictive maintenance, and grid integration.
Growth Accelerators in the UK Offshore Wind Energy Industry
Technological advancements, such as improved turbine design and larger capacity, will continue to drive cost reductions and enhance efficiency. Strategic partnerships between energy companies, technology providers, and government bodies will facilitate faster deployment and improved grid integration. Expansion into new areas, especially deeper water sites, will unlock significant growth potential.
Key Players Shaping the UK Offshore Wind Energy Industry Market
Notable Milestones in UK Offshore Wind Energy Sector
- August 2021: UK government invests USD 350 million in offshore wind manufacturing in the Humber region.
- January 17, 2022: Shell plc and Scottish Power Ltd win bids for 5 GW of floating wind power.
- March 28, 2022: Shell plc announces EUR 30 billion investment in UK energy, with 75% allocated to renewables.
In-Depth UK Offshore Wind Energy Industry Market Outlook
The UK offshore wind energy market is poised for substantial and sustained growth throughout the forecast period (2025-2033). Continued technological progress, unwavering government support, and robust private sector investment will drive market expansion. Strategic partnerships and innovative business models will be essential to fully realize the sector's potential, contributing significantly to the UK's renewable energy targets. The emphasis on floating offshore wind technology and the development of large-scale projects will be crucial in achieving ambitious capacity goals and accelerating the UK's transition to a cleaner energy future. Further development of the supply chain and workforce capabilities will be essential to manage this sustained growth.
UK Offshore Wind Energy Industry Segmentation
-
1. Foundation Type
- 1.1. Fixed Foundation
- 1.2. Floating Foundation
-
2. Capacity
- 2.1. Less Than 5 MW
- 2.2. Greater Than or Equal to 5 MW
UK Offshore Wind Energy Industry Segmentation By Geography
-
1. North America
- 1.1. United States
- 1.2. Canada
- 1.3. Mexico
-
2. South America
- 2.1. Brazil
- 2.2. Argentina
- 2.3. Rest of South America
-
3. Europe
- 3.1. United Kingdom
- 3.2. Germany
- 3.3. France
- 3.4. Italy
- 3.5. Spain
- 3.6. Russia
- 3.7. Benelux
- 3.8. Nordics
- 3.9. Rest of Europe
-
4. Middle East & Africa
- 4.1. Turkey
- 4.2. Israel
- 4.3. GCC
- 4.4. North Africa
- 4.5. South Africa
- 4.6. Rest of Middle East & Africa
-
5. Asia Pacific
- 5.1. China
- 5.2. India
- 5.3. Japan
- 5.4. South Korea
- 5.5. ASEAN
- 5.6. Oceania
- 5.7. Rest of Asia Pacific
UK Offshore Wind Energy Industry Regional Market Share
Geographic Coverage of UK Offshore Wind Energy Industry
UK Offshore Wind Energy Industry REPORT HIGHLIGHTS
| Aspects | Details |
|---|---|
| Study Period | 2020-2034 |
| Base Year | 2025 |
| Estimated Year | 2026 |
| Forecast Period | 2026-2034 |
| Historical Period | 2020-2025 |
| Growth Rate | CAGR of 14.6% from 2020-2034 |
| Segmentation |
|
Table of Contents
- 1. Introduction
- 1.1. Research Scope
- 1.2. Market Segmentation
- 1.3. Research Objective
- 1.4. Definitions and Assumptions
- 2. Executive Summary
- 2.1. Market Snapshot
- 3. Market Dynamics
- 3.1. Market Drivers
- 3.2. Market Restrains
- 3.3. Market Trends
- 3.4. Market Opportunities
- 4. Market Factor Analysis
- 4.1. Porters Five Forces
- 4.1.1. Bargaining Power of Suppliers
- 4.1.2. Bargaining Power of Buyers
- 4.1.3. Threat of New Entrants
- 4.1.4. Threat of Substitutes
- 4.1.5. Competitive Rivalry
- 4.2. PESTEL analysis
- 4.3. BCG Analysis
- 4.3.1. Stars (High Growth, High Market Share)
- 4.3.2. Cash Cows (Low Growth, High Market Share)
- 4.3.3. Question Mark (High Growth, Low Market Share)
- 4.3.4. Dogs (Low Growth, Low Market Share)
- 4.4. Ansoff Matrix Analysis
- 4.5. Supply Chain Analysis
- 4.6. Regulatory Landscape
- 4.7. Current Market Potential and Opportunity Assessment (TAM–SAM–SOM Framework)
- 4.8. NRP Analyst Note
- 4.1. Porters Five Forces
- 5. Market Analysis, Insights and Forecast 2021-2033
- 5.1. Market Analysis, Insights and Forecast - by Foundation Type
- 5.1.1. Fixed Foundation
- 5.1.2. Floating Foundation
- 5.2. Market Analysis, Insights and Forecast - by Capacity
- 5.2.1. Less Than 5 MW
- 5.2.2. Greater Than or Equal to 5 MW
- 5.3. Market Analysis, Insights and Forecast - by Region
- 5.3.1. North America
- 5.3.2. South America
- 5.3.3. Europe
- 5.3.4. Middle East & Africa
- 5.3.5. Asia Pacific
- 5.1. Market Analysis, Insights and Forecast - by Foundation Type
- 6. Global UK Offshore Wind Energy Industry Analysis, Insights and Forecast, 2021-2033
- 6.1. Market Analysis, Insights and Forecast - by Foundation Type
- 6.1.1. Fixed Foundation
- 6.1.2. Floating Foundation
- 6.2. Market Analysis, Insights and Forecast - by Capacity
- 6.2.1. Less Than 5 MW
- 6.2.2. Greater Than or Equal to 5 MW
- 6.1. Market Analysis, Insights and Forecast - by Foundation Type
- 7. North America UK Offshore Wind Energy Industry Analysis, Insights and Forecast, 2020-2032
- 7.1. Market Analysis, Insights and Forecast - by Foundation Type
- 7.1.1. Fixed Foundation
- 7.1.2. Floating Foundation
- 7.2. Market Analysis, Insights and Forecast - by Capacity
- 7.2.1. Less Than 5 MW
- 7.2.2. Greater Than or Equal to 5 MW
- 7.1. Market Analysis, Insights and Forecast - by Foundation Type
- 8. South America UK Offshore Wind Energy Industry Analysis, Insights and Forecast, 2020-2032
- 8.1. Market Analysis, Insights and Forecast - by Foundation Type
- 8.1.1. Fixed Foundation
- 8.1.2. Floating Foundation
- 8.2. Market Analysis, Insights and Forecast - by Capacity
- 8.2.1. Less Than 5 MW
- 8.2.2. Greater Than or Equal to 5 MW
- 8.1. Market Analysis, Insights and Forecast - by Foundation Type
- 9. Europe UK Offshore Wind Energy Industry Analysis, Insights and Forecast, 2020-2032
- 9.1. Market Analysis, Insights and Forecast - by Foundation Type
- 9.1.1. Fixed Foundation
- 9.1.2. Floating Foundation
- 9.2. Market Analysis, Insights and Forecast - by Capacity
- 9.2.1. Less Than 5 MW
- 9.2.2. Greater Than or Equal to 5 MW
- 9.1. Market Analysis, Insights and Forecast - by Foundation Type
- 10. Middle East & Africa UK Offshore Wind Energy Industry Analysis, Insights and Forecast, 2020-2032
- 10.1. Market Analysis, Insights and Forecast - by Foundation Type
- 10.1.1. Fixed Foundation
- 10.1.2. Floating Foundation
- 10.2. Market Analysis, Insights and Forecast - by Capacity
- 10.2.1. Less Than 5 MW
- 10.2.2. Greater Than or Equal to 5 MW
- 10.1. Market Analysis, Insights and Forecast - by Foundation Type
- 11. Asia Pacific UK Offshore Wind Energy Industry Analysis, Insights and Forecast, 2020-2032
- 11.1. Market Analysis, Insights and Forecast - by Foundation Type
- 11.1.1. Fixed Foundation
- 11.1.2. Floating Foundation
- 11.2. Market Analysis, Insights and Forecast - by Capacity
- 11.2.1. Less Than 5 MW
- 11.2.2. Greater Than or Equal to 5 MW
- 11.1. Market Analysis, Insights and Forecast - by Foundation Type
- 12. Competitive Analysis
- 12.1. Company Profiles
- 12.1.1 Scottish Power Ltd BP p l c
- 12.1.1.1. Company Overview
- 12.1.1.2. Products
- 12.1.1.3. Company Financials
- 12.1.1.4. SWOT Analysis
- 12.1.2 Shell Plc
- 12.1.2.1. Company Overview
- 12.1.2.2. Products
- 12.1.2.3. Company Financials
- 12.1.2.4. SWOT Analysis
- 12.1.3 Ocean Winds
- 12.1.3.1. Company Overview
- 12.1.3.2. Products
- 12.1.3.3. Company Financials
- 12.1.3.4. SWOT Analysis
- 12.1.4 Siemens Gamesa Renewable Energy S A
- 12.1.4.1. Company Overview
- 12.1.4.2. Products
- 12.1.4.3. Company Financials
- 12.1.4.4. SWOT Analysis
- 12.1.5 Orsted
- 12.1.5.1. Company Overview
- 12.1.5.2. Products
- 12.1.5.3. Company Financials
- 12.1.5.4. SWOT Analysis
- 12.1.6 EDF Renewables
- 12.1.6.1. Company Overview
- 12.1.6.2. Products
- 12.1.6.3. Company Financials
- 12.1.6.4. SWOT Analysis
- 12.1.7 Vattenfall AB
- 12.1.7.1. Company Overview
- 12.1.7.2. Products
- 12.1.7.3. Company Financials
- 12.1.7.4. SWOT Analysis
- 12.1.8 Vestas
- 12.1.8.1. Company Overview
- 12.1.8.2. Products
- 12.1.8.3. Company Financials
- 12.1.8.4. SWOT Analysis
- 12.1.9 GE RENEWABLE ENERGY
- 12.1.9.1. Company Overview
- 12.1.9.2. Products
- 12.1.9.3. Company Financials
- 12.1.9.4. SWOT Analysis
- 12.1.1 Scottish Power Ltd BP p l c
- 12.2. Market Entropy
- 12.2.1 Company's Key Areas Served
- 12.2.2 Recent Developments
- 12.3. Company Market Share Analysis 2025
- 12.3.1 Top 5 Companies Market Share Analysis
- 12.3.2 Top 3 Companies Market Share Analysis
- 12.4. List of Potential Customers
- 13. Research Methodology
List of Figures
- Figure 1: Global UK Offshore Wind Energy Industry Revenue Breakdown (billion, %) by Region 2025 & 2033
- Figure 2: Global UK Offshore Wind Energy Industry Volume Breakdown (Gigawatt, %) by Region 2025 & 2033
- Figure 3: North America UK Offshore Wind Energy Industry Revenue (billion), by Foundation Type 2025 & 2033
- Figure 4: North America UK Offshore Wind Energy Industry Volume (Gigawatt), by Foundation Type 2025 & 2033
- Figure 5: North America UK Offshore Wind Energy Industry Revenue Share (%), by Foundation Type 2025 & 2033
- Figure 6: North America UK Offshore Wind Energy Industry Volume Share (%), by Foundation Type 2025 & 2033
- Figure 7: North America UK Offshore Wind Energy Industry Revenue (billion), by Capacity 2025 & 2033
- Figure 8: North America UK Offshore Wind Energy Industry Volume (Gigawatt), by Capacity 2025 & 2033
- Figure 9: North America UK Offshore Wind Energy Industry Revenue Share (%), by Capacity 2025 & 2033
- Figure 10: North America UK Offshore Wind Energy Industry Volume Share (%), by Capacity 2025 & 2033
- Figure 11: North America UK Offshore Wind Energy Industry Revenue (billion), by Country 2025 & 2033
- Figure 12: North America UK Offshore Wind Energy Industry Volume (Gigawatt), by Country 2025 & 2033
- Figure 13: North America UK Offshore Wind Energy Industry Revenue Share (%), by Country 2025 & 2033
- Figure 14: North America UK Offshore Wind Energy Industry Volume Share (%), by Country 2025 & 2033
- Figure 15: South America UK Offshore Wind Energy Industry Revenue (billion), by Foundation Type 2025 & 2033
- Figure 16: South America UK Offshore Wind Energy Industry Volume (Gigawatt), by Foundation Type 2025 & 2033
- Figure 17: South America UK Offshore Wind Energy Industry Revenue Share (%), by Foundation Type 2025 & 2033
- Figure 18: South America UK Offshore Wind Energy Industry Volume Share (%), by Foundation Type 2025 & 2033
- Figure 19: South America UK Offshore Wind Energy Industry Revenue (billion), by Capacity 2025 & 2033
- Figure 20: South America UK Offshore Wind Energy Industry Volume (Gigawatt), by Capacity 2025 & 2033
- Figure 21: South America UK Offshore Wind Energy Industry Revenue Share (%), by Capacity 2025 & 2033
- Figure 22: South America UK Offshore Wind Energy Industry Volume Share (%), by Capacity 2025 & 2033
- Figure 23: South America UK Offshore Wind Energy Industry Revenue (billion), by Country 2025 & 2033
- Figure 24: South America UK Offshore Wind Energy Industry Volume (Gigawatt), by Country 2025 & 2033
- Figure 25: South America UK Offshore Wind Energy Industry Revenue Share (%), by Country 2025 & 2033
- Figure 26: South America UK Offshore Wind Energy Industry Volume Share (%), by Country 2025 & 2033
- Figure 27: Europe UK Offshore Wind Energy Industry Revenue (billion), by Foundation Type 2025 & 2033
- Figure 28: Europe UK Offshore Wind Energy Industry Volume (Gigawatt), by Foundation Type 2025 & 2033
- Figure 29: Europe UK Offshore Wind Energy Industry Revenue Share (%), by Foundation Type 2025 & 2033
- Figure 30: Europe UK Offshore Wind Energy Industry Volume Share (%), by Foundation Type 2025 & 2033
- Figure 31: Europe UK Offshore Wind Energy Industry Revenue (billion), by Capacity 2025 & 2033
- Figure 32: Europe UK Offshore Wind Energy Industry Volume (Gigawatt), by Capacity 2025 & 2033
- Figure 33: Europe UK Offshore Wind Energy Industry Revenue Share (%), by Capacity 2025 & 2033
- Figure 34: Europe UK Offshore Wind Energy Industry Volume Share (%), by Capacity 2025 & 2033
- Figure 35: Europe UK Offshore Wind Energy Industry Revenue (billion), by Country 2025 & 2033
- Figure 36: Europe UK Offshore Wind Energy Industry Volume (Gigawatt), by Country 2025 & 2033
- Figure 37: Europe UK Offshore Wind Energy Industry Revenue Share (%), by Country 2025 & 2033
- Figure 38: Europe UK Offshore Wind Energy Industry Volume Share (%), by Country 2025 & 2033
- Figure 39: Middle East & Africa UK Offshore Wind Energy Industry Revenue (billion), by Foundation Type 2025 & 2033
- Figure 40: Middle East & Africa UK Offshore Wind Energy Industry Volume (Gigawatt), by Foundation Type 2025 & 2033
- Figure 41: Middle East & Africa UK Offshore Wind Energy Industry Revenue Share (%), by Foundation Type 2025 & 2033
- Figure 42: Middle East & Africa UK Offshore Wind Energy Industry Volume Share (%), by Foundation Type 2025 & 2033
- Figure 43: Middle East & Africa UK Offshore Wind Energy Industry Revenue (billion), by Capacity 2025 & 2033
- Figure 44: Middle East & Africa UK Offshore Wind Energy Industry Volume (Gigawatt), by Capacity 2025 & 2033
- Figure 45: Middle East & Africa UK Offshore Wind Energy Industry Revenue Share (%), by Capacity 2025 & 2033
- Figure 46: Middle East & Africa UK Offshore Wind Energy Industry Volume Share (%), by Capacity 2025 & 2033
- Figure 47: Middle East & Africa UK Offshore Wind Energy Industry Revenue (billion), by Country 2025 & 2033
- Figure 48: Middle East & Africa UK Offshore Wind Energy Industry Volume (Gigawatt), by Country 2025 & 2033
- Figure 49: Middle East & Africa UK Offshore Wind Energy Industry Revenue Share (%), by Country 2025 & 2033
- Figure 50: Middle East & Africa UK Offshore Wind Energy Industry Volume Share (%), by Country 2025 & 2033
- Figure 51: Asia Pacific UK Offshore Wind Energy Industry Revenue (billion), by Foundation Type 2025 & 2033
- Figure 52: Asia Pacific UK Offshore Wind Energy Industry Volume (Gigawatt), by Foundation Type 2025 & 2033
- Figure 53: Asia Pacific UK Offshore Wind Energy Industry Revenue Share (%), by Foundation Type 2025 & 2033
- Figure 54: Asia Pacific UK Offshore Wind Energy Industry Volume Share (%), by Foundation Type 2025 & 2033
- Figure 55: Asia Pacific UK Offshore Wind Energy Industry Revenue (billion), by Capacity 2025 & 2033
- Figure 56: Asia Pacific UK Offshore Wind Energy Industry Volume (Gigawatt), by Capacity 2025 & 2033
- Figure 57: Asia Pacific UK Offshore Wind Energy Industry Revenue Share (%), by Capacity 2025 & 2033
- Figure 58: Asia Pacific UK Offshore Wind Energy Industry Volume Share (%), by Capacity 2025 & 2033
- Figure 59: Asia Pacific UK Offshore Wind Energy Industry Revenue (billion), by Country 2025 & 2033
- Figure 60: Asia Pacific UK Offshore Wind Energy Industry Volume (Gigawatt), by Country 2025 & 2033
- Figure 61: Asia Pacific UK Offshore Wind Energy Industry Revenue Share (%), by Country 2025 & 2033
- Figure 62: Asia Pacific UK Offshore Wind Energy Industry Volume Share (%), by Country 2025 & 2033
List of Tables
- Table 1: Global UK Offshore Wind Energy Industry Revenue billion Forecast, by Foundation Type 2020 & 2033
- Table 2: Global UK Offshore Wind Energy Industry Volume Gigawatt Forecast, by Foundation Type 2020 & 2033
- Table 3: Global UK Offshore Wind Energy Industry Revenue billion Forecast, by Capacity 2020 & 2033
- Table 4: Global UK Offshore Wind Energy Industry Volume Gigawatt Forecast, by Capacity 2020 & 2033
- Table 5: Global UK Offshore Wind Energy Industry Revenue billion Forecast, by Region 2020 & 2033
- Table 6: Global UK Offshore Wind Energy Industry Volume Gigawatt Forecast, by Region 2020 & 2033
- Table 7: Global UK Offshore Wind Energy Industry Revenue billion Forecast, by Foundation Type 2020 & 2033
- Table 8: Global UK Offshore Wind Energy Industry Volume Gigawatt Forecast, by Foundation Type 2020 & 2033
- Table 9: Global UK Offshore Wind Energy Industry Revenue billion Forecast, by Capacity 2020 & 2033
- Table 10: Global UK Offshore Wind Energy Industry Volume Gigawatt Forecast, by Capacity 2020 & 2033
- Table 11: Global UK Offshore Wind Energy Industry Revenue billion Forecast, by Country 2020 & 2033
- Table 12: Global UK Offshore Wind Energy Industry Volume Gigawatt Forecast, by Country 2020 & 2033
- Table 13: United States UK Offshore Wind Energy Industry Revenue (billion) Forecast, by Application 2020 & 2033
- Table 14: United States UK Offshore Wind Energy Industry Volume (Gigawatt) Forecast, by Application 2020 & 2033
- Table 15: Canada UK Offshore Wind Energy Industry Revenue (billion) Forecast, by Application 2020 & 2033
- Table 16: Canada UK Offshore Wind Energy Industry Volume (Gigawatt) Forecast, by Application 2020 & 2033
- Table 17: Mexico UK Offshore Wind Energy Industry Revenue (billion) Forecast, by Application 2020 & 2033
- Table 18: Mexico UK Offshore Wind Energy Industry Volume (Gigawatt) Forecast, by Application 2020 & 2033
- Table 19: Global UK Offshore Wind Energy Industry Revenue billion Forecast, by Foundation Type 2020 & 2033
- Table 20: Global UK Offshore Wind Energy Industry Volume Gigawatt Forecast, by Foundation Type 2020 & 2033
- Table 21: Global UK Offshore Wind Energy Industry Revenue billion Forecast, by Capacity 2020 & 2033
- Table 22: Global UK Offshore Wind Energy Industry Volume Gigawatt Forecast, by Capacity 2020 & 2033
- Table 23: Global UK Offshore Wind Energy Industry Revenue billion Forecast, by Country 2020 & 2033
- Table 24: Global UK Offshore Wind Energy Industry Volume Gigawatt Forecast, by Country 2020 & 2033
- Table 25: Brazil UK Offshore Wind Energy Industry Revenue (billion) Forecast, by Application 2020 & 2033
- Table 26: Brazil UK Offshore Wind Energy Industry Volume (Gigawatt) Forecast, by Application 2020 & 2033
- Table 27: Argentina UK Offshore Wind Energy Industry Revenue (billion) Forecast, by Application 2020 & 2033
- Table 28: Argentina UK Offshore Wind Energy Industry Volume (Gigawatt) Forecast, by Application 2020 & 2033
- Table 29: Rest of South America UK Offshore Wind Energy Industry Revenue (billion) Forecast, by Application 2020 & 2033
- Table 30: Rest of South America UK Offshore Wind Energy Industry Volume (Gigawatt) Forecast, by Application 2020 & 2033
- Table 31: Global UK Offshore Wind Energy Industry Revenue billion Forecast, by Foundation Type 2020 & 2033
- Table 32: Global UK Offshore Wind Energy Industry Volume Gigawatt Forecast, by Foundation Type 2020 & 2033
- Table 33: Global UK Offshore Wind Energy Industry Revenue billion Forecast, by Capacity 2020 & 2033
- Table 34: Global UK Offshore Wind Energy Industry Volume Gigawatt Forecast, by Capacity 2020 & 2033
- Table 35: Global UK Offshore Wind Energy Industry Revenue billion Forecast, by Country 2020 & 2033
- Table 36: Global UK Offshore Wind Energy Industry Volume Gigawatt Forecast, by Country 2020 & 2033
- Table 37: United Kingdom UK Offshore Wind Energy Industry Revenue (billion) Forecast, by Application 2020 & 2033
- Table 38: United Kingdom UK Offshore Wind Energy Industry Volume (Gigawatt) Forecast, by Application 2020 & 2033
- Table 39: Germany UK Offshore Wind Energy Industry Revenue (billion) Forecast, by Application 2020 & 2033
- Table 40: Germany UK Offshore Wind Energy Industry Volume (Gigawatt) Forecast, by Application 2020 & 2033
- Table 41: France UK Offshore Wind Energy Industry Revenue (billion) Forecast, by Application 2020 & 2033
- Table 42: France UK Offshore Wind Energy Industry Volume (Gigawatt) Forecast, by Application 2020 & 2033
- Table 43: Italy UK Offshore Wind Energy Industry Revenue (billion) Forecast, by Application 2020 & 2033
- Table 44: Italy UK Offshore Wind Energy Industry Volume (Gigawatt) Forecast, by Application 2020 & 2033
- Table 45: Spain UK Offshore Wind Energy Industry Revenue (billion) Forecast, by Application 2020 & 2033
- Table 46: Spain UK Offshore Wind Energy Industry Volume (Gigawatt) Forecast, by Application 2020 & 2033
- Table 47: Russia UK Offshore Wind Energy Industry Revenue (billion) Forecast, by Application 2020 & 2033
- Table 48: Russia UK Offshore Wind Energy Industry Volume (Gigawatt) Forecast, by Application 2020 & 2033
- Table 49: Benelux UK Offshore Wind Energy Industry Revenue (billion) Forecast, by Application 2020 & 2033
- Table 50: Benelux UK Offshore Wind Energy Industry Volume (Gigawatt) Forecast, by Application 2020 & 2033
- Table 51: Nordics UK Offshore Wind Energy Industry Revenue (billion) Forecast, by Application 2020 & 2033
- Table 52: Nordics UK Offshore Wind Energy Industry Volume (Gigawatt) Forecast, by Application 2020 & 2033
- Table 53: Rest of Europe UK Offshore Wind Energy Industry Revenue (billion) Forecast, by Application 2020 & 2033
- Table 54: Rest of Europe UK Offshore Wind Energy Industry Volume (Gigawatt) Forecast, by Application 2020 & 2033
- Table 55: Global UK Offshore Wind Energy Industry Revenue billion Forecast, by Foundation Type 2020 & 2033
- Table 56: Global UK Offshore Wind Energy Industry Volume Gigawatt Forecast, by Foundation Type 2020 & 2033
- Table 57: Global UK Offshore Wind Energy Industry Revenue billion Forecast, by Capacity 2020 & 2033
- Table 58: Global UK Offshore Wind Energy Industry Volume Gigawatt Forecast, by Capacity 2020 & 2033
- Table 59: Global UK Offshore Wind Energy Industry Revenue billion Forecast, by Country 2020 & 2033
- Table 60: Global UK Offshore Wind Energy Industry Volume Gigawatt Forecast, by Country 2020 & 2033
- Table 61: Turkey UK Offshore Wind Energy Industry Revenue (billion) Forecast, by Application 2020 & 2033
- Table 62: Turkey UK Offshore Wind Energy Industry Volume (Gigawatt) Forecast, by Application 2020 & 2033
- Table 63: Israel UK Offshore Wind Energy Industry Revenue (billion) Forecast, by Application 2020 & 2033
- Table 64: Israel UK Offshore Wind Energy Industry Volume (Gigawatt) Forecast, by Application 2020 & 2033
- Table 65: GCC UK Offshore Wind Energy Industry Revenue (billion) Forecast, by Application 2020 & 2033
- Table 66: GCC UK Offshore Wind Energy Industry Volume (Gigawatt) Forecast, by Application 2020 & 2033
- Table 67: North Africa UK Offshore Wind Energy Industry Revenue (billion) Forecast, by Application 2020 & 2033
- Table 68: North Africa UK Offshore Wind Energy Industry Volume (Gigawatt) Forecast, by Application 2020 & 2033
- Table 69: South Africa UK Offshore Wind Energy Industry Revenue (billion) Forecast, by Application 2020 & 2033
- Table 70: South Africa UK Offshore Wind Energy Industry Volume (Gigawatt) Forecast, by Application 2020 & 2033
- Table 71: Rest of Middle East & Africa UK Offshore Wind Energy Industry Revenue (billion) Forecast, by Application 2020 & 2033
- Table 72: Rest of Middle East & Africa UK Offshore Wind Energy Industry Volume (Gigawatt) Forecast, by Application 2020 & 2033
- Table 73: Global UK Offshore Wind Energy Industry Revenue billion Forecast, by Foundation Type 2020 & 2033
- Table 74: Global UK Offshore Wind Energy Industry Volume Gigawatt Forecast, by Foundation Type 2020 & 2033
- Table 75: Global UK Offshore Wind Energy Industry Revenue billion Forecast, by Capacity 2020 & 2033
- Table 76: Global UK Offshore Wind Energy Industry Volume Gigawatt Forecast, by Capacity 2020 & 2033
- Table 77: Global UK Offshore Wind Energy Industry Revenue billion Forecast, by Country 2020 & 2033
- Table 78: Global UK Offshore Wind Energy Industry Volume Gigawatt Forecast, by Country 2020 & 2033
- Table 79: China UK Offshore Wind Energy Industry Revenue (billion) Forecast, by Application 2020 & 2033
- Table 80: China UK Offshore Wind Energy Industry Volume (Gigawatt) Forecast, by Application 2020 & 2033
- Table 81: India UK Offshore Wind Energy Industry Revenue (billion) Forecast, by Application 2020 & 2033
- Table 82: India UK Offshore Wind Energy Industry Volume (Gigawatt) Forecast, by Application 2020 & 2033
- Table 83: Japan UK Offshore Wind Energy Industry Revenue (billion) Forecast, by Application 2020 & 2033
- Table 84: Japan UK Offshore Wind Energy Industry Volume (Gigawatt) Forecast, by Application 2020 & 2033
- Table 85: South Korea UK Offshore Wind Energy Industry Revenue (billion) Forecast, by Application 2020 & 2033
- Table 86: South Korea UK Offshore Wind Energy Industry Volume (Gigawatt) Forecast, by Application 2020 & 2033
- Table 87: ASEAN UK Offshore Wind Energy Industry Revenue (billion) Forecast, by Application 2020 & 2033
- Table 88: ASEAN UK Offshore Wind Energy Industry Volume (Gigawatt) Forecast, by Application 2020 & 2033
- Table 89: Oceania UK Offshore Wind Energy Industry Revenue (billion) Forecast, by Application 2020 & 2033
- Table 90: Oceania UK Offshore Wind Energy Industry Volume (Gigawatt) Forecast, by Application 2020 & 2033
- Table 91: Rest of Asia Pacific UK Offshore Wind Energy Industry Revenue (billion) Forecast, by Application 2020 & 2033
- Table 92: Rest of Asia Pacific UK Offshore Wind Energy Industry Volume (Gigawatt) Forecast, by Application 2020 & 2033
Frequently Asked Questions
1. What is the projected Compound Annual Growth Rate (CAGR) of the UK Offshore Wind Energy Industry?
The projected CAGR is approximately 14.6%.
2. Which companies are prominent players in the UK Offshore Wind Energy Industry?
Key companies in the market include Scottish Power Ltd BP p l c, Shell Plc, Ocean Winds, Siemens Gamesa Renewable Energy S A, Orsted, EDF Renewables, Vattenfall AB, Vestas, GE RENEWABLE ENERGY.
3. What are the main segments of the UK Offshore Wind Energy Industry?
The market segments include Foundation Type, Capacity.
4. Can you provide details about the market size?
The market size is estimated to be USD 55.9 billion as of 2022.
5. What are some drivers contributing to market growth?
4.; Reduction in Energy Bills Due to Self-Power Consumption4.; Increasing Installation of Solar PV Modules in Residential Segment.
6. What are the notable trends driving market growth?
Floating Foundation Segment to Dominate the Market.
7. Are there any restraints impacting market growth?
4.; High Installation Cost as Compared to Rooftop PV Systems.
8. Can you provide examples of recent developments in the market?
On 17th January 2022, Shell plc and Scottish Power Ltd. Joint ventures won bids to develop 5 GW of floating wind power in the United Kingdom. Both the companies plan to build and operate two of the world's first large-scale floating offshore wind farms in the United Kingdom with a power generation capacity of 3 GW and 2 GW.
9. What pricing options are available for accessing the report?
Pricing options include single-user, multi-user, and enterprise licenses priced at USD 3800, USD 4500, and USD 5800 respectively.
10. Is the market size provided in terms of value or volume?
The market size is provided in terms of value, measured in billion and volume, measured in Gigawatt.
11. Are there any specific market keywords associated with the report?
Yes, the market keyword associated with the report is "UK Offshore Wind Energy Industry," which aids in identifying and referencing the specific market segment covered.
12. How do I determine which pricing option suits my needs best?
The pricing options vary based on user requirements and access needs. Individual users may opt for single-user licenses, while businesses requiring broader access may choose multi-user or enterprise licenses for cost-effective access to the report.
13. Are there any additional resources or data provided in the UK Offshore Wind Energy Industry report?
While the report offers comprehensive insights, it's advisable to review the specific contents or supplementary materials provided to ascertain if additional resources or data are available.
14. How can I stay updated on further developments or reports in the UK Offshore Wind Energy Industry?
To stay informed about further developments, trends, and reports in the UK Offshore Wind Energy Industry, consider subscribing to industry newsletters, following relevant companies and organizations, or regularly checking reputable industry news sources and publications.
Methodology
Step 1 - Identification of Relevant Samples Size from Population Database


Step 2 - Approaches for Defining Global Market Size (Value, Volume* & Price*)

Note*: In applicable scenarios
Step 3 - Data Sources
Primary Research
- Web Analytics
- Survey Reports
- Research Institute
- Latest Research Reports
- Opinion Leaders
Secondary Research
- Annual Reports
- White Paper
- Latest Press Release
- Industry Association
- Paid Database
- Investor Presentations

Step 4 - Data Triangulation
Involves using different sources of information in order to increase the validity of a study
These sources are likely to be stakeholders in a program - participants, other researchers, program staff, other community members, and so on.
Then we put all data in single framework & apply various statistical tools to find out the dynamic on the market.
During the analysis stage, feedback from the stakeholder groups would be compared to determine areas of agreement as well as areas of divergence