

Key Insights
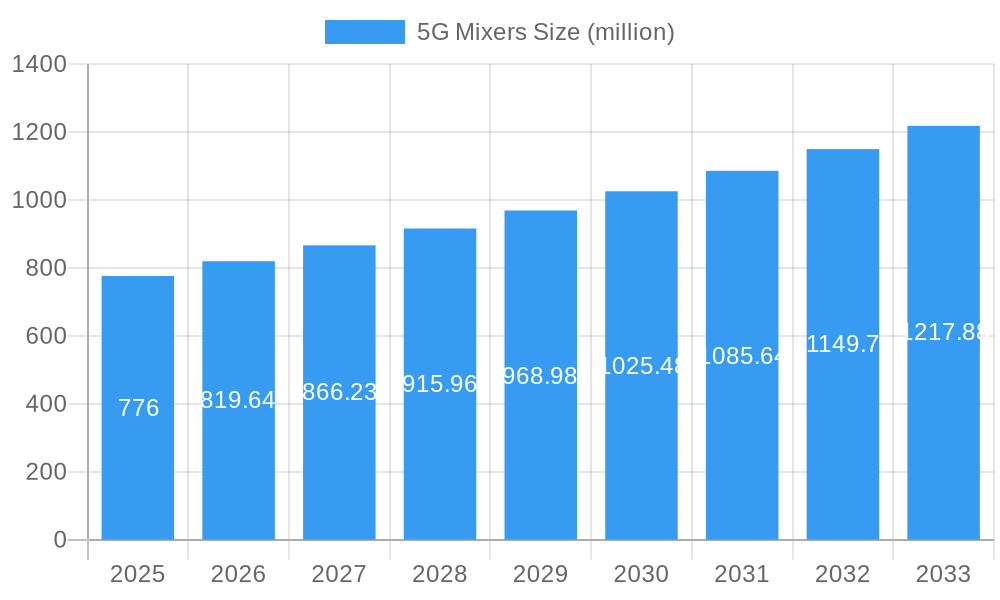
The 5G Mixer market, currently valued at $776 million in 2025, is projected to experience robust growth, driven by the escalating deployment of 5G infrastructure globally. The increasing demand for high-speed data, low latency communication, and enhanced network capacity are key factors fueling this expansion. The market's Compound Annual Growth Rate (CAGR) of 5.5% from 2025 to 2033 indicates a steady trajectory of growth, with significant opportunities for established players like Analog Devices, Marki Microwave, and Mini-Circuits, as well as emerging companies. Technological advancements in mixer designs, leading to improved performance characteristics such as higher linearity, lower noise figures, and wider bandwidths, further contribute to market expansion. The integration of 5G mixers into various applications, including mobile devices, base stations, and other wireless communication systems, is also a major driver. Competition within the market is expected to remain intense, with companies focusing on product differentiation, technological innovation, and strategic partnerships to gain market share.
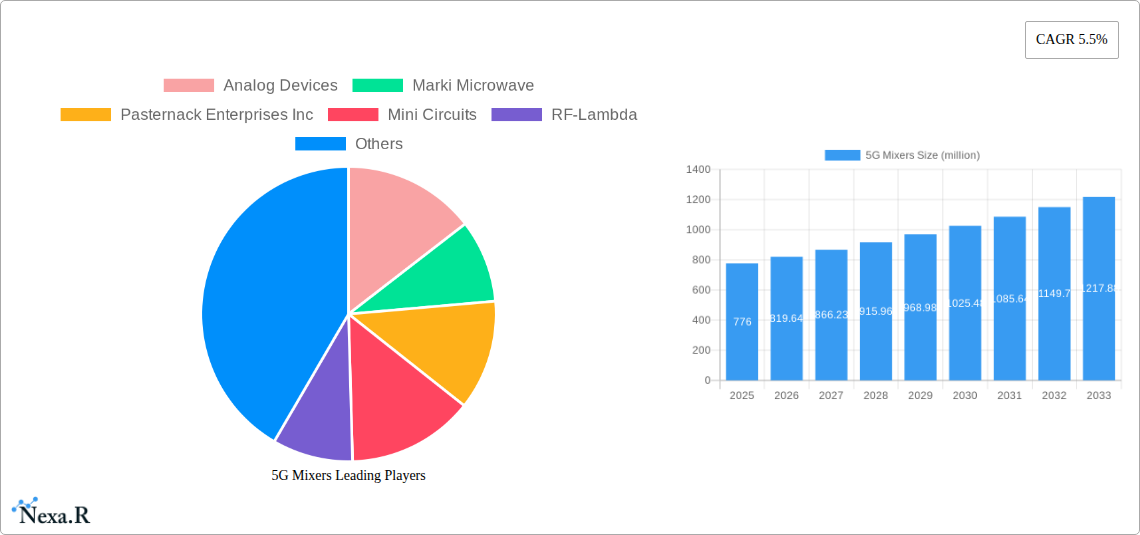
5G Mixers Market Size (In Million)
Growth is expected to be driven by increased demand from the telecommunications sector, alongside expansion into emerging applications like IoT and autonomous vehicles. While potential restraints such as supply chain complexities and the cost of advanced components exist, the overall market outlook remains positive. Market segmentation, while not provided, likely includes distinctions based on frequency range, technology type (e.g., active vs. passive), and application. Regional growth will likely mirror 5G infrastructure deployment, with North America, Asia-Pacific, and Europe emerging as key markets. The forecast period of 2025-2033 presents substantial opportunities for both established and new entrants, contingent upon strategic investments in R&D and effective market penetration strategies.
5G Mixers Company Market Share
5G Mixers Market: A Comprehensive Report (2019-2033)
This in-depth report provides a comprehensive analysis of the 5G Mixers market, encompassing market dynamics, growth trends, regional segmentation, product landscape, key players, and future outlook. The study covers the historical period (2019-2024), base year (2025), and forecast period (2025-2033), offering valuable insights for industry professionals, investors, and stakeholders. The parent market is the broader RF & Microwave components market, and the child market is specifically 5G infrastructure components. The report projects the market to reach xx million units by 2033.
5G Mixers Market Dynamics & Structure
This section analyzes the competitive landscape, technological advancements, regulatory influences, and market trends within the 5G Mixers market. The report examines market concentration, revealing the market share held by key players such as Analog Devices, Marki Microwave, Pasternack Enterprises Inc, Mini-Circuits, RF-Lambda, DS Instruments, ED2 Corp, HXI, MACOM, MILLIBEAM, and United Monolithic Semiconductors. It also delves into the impact of mergers and acquisitions (M&A) activities, estimating xx M&A deals in the forecast period.
- Market Concentration: Highly fragmented with top 5 players holding an estimated xx% market share in 2025.
- Technological Innovation: Driven by advancements in GaN and SiC technology, leading to improved power efficiency and higher frequencies. Barriers to innovation include high R&D costs and complex design processes.
- Regulatory Framework: Government regulations concerning spectrum allocation and 5G infrastructure deployment significantly impact market growth.
- Competitive Substitutes: Limited direct substitutes exist; however, alternative technologies might emerge, posing long-term challenges.
- End-User Demographics: Primarily driven by telecommunication companies, infrastructure providers, and equipment manufacturers.
- M&A Trends: Consolidation expected to increase as larger players seek to expand their market share and product portfolios.
5G Mixers Growth Trends & Insights
This section provides a detailed analysis of the 5G Mixers market's historical and projected growth, leveraging extensive market research data. The report details the market size evolution, analyzing the Compound Annual Growth Rate (CAGR) for the period 2019-2024 and projecting the CAGR for 2025-2033. It also examines factors influencing market penetration rates, technological disruptions such as the adoption of new materials and designs, and shifts in consumer behavior, resulting in a projected market size of xx million units by 2033. Specific adoption rates for different 5G applications will be detailed, highlighting the growth potential within specific industry verticals.
Dominant Regions, Countries, or Segments in 5G Mixers
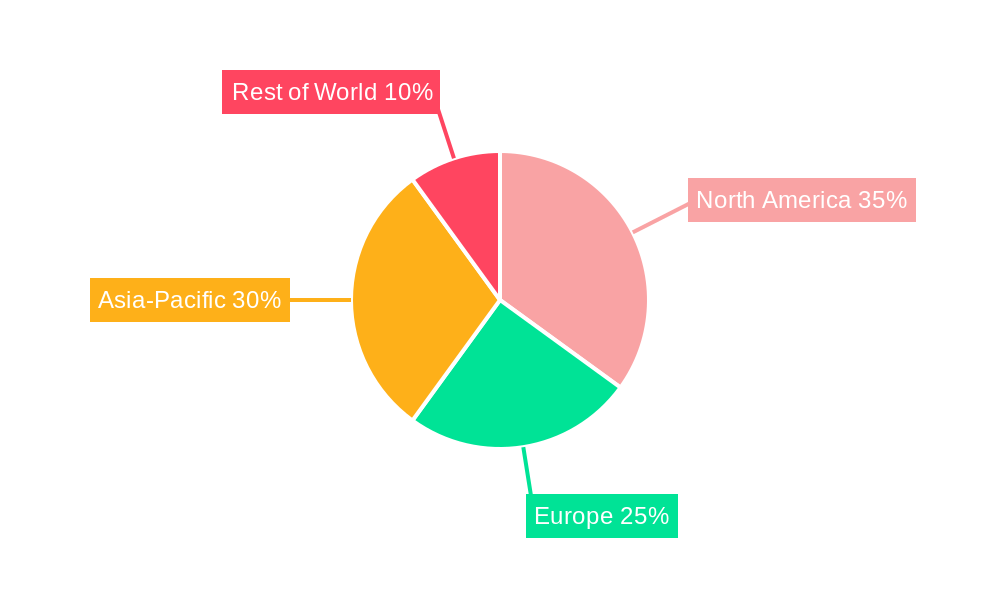
This section identifies the leading geographical regions and segments driving market growth. North America is expected to maintain a leading position due to early 5G adoption and robust infrastructure development. However, Asia-Pacific is projected to experience the fastest growth rate due to burgeoning demand and supportive government policies. The report will analyze regional dominance factors including market share, growth potential, and regulatory landscapes.
- North America: High 5G infrastructure investment and early adoption drive market growth.
- Europe: Growing demand for high-speed connectivity and supportive government initiatives fuel market expansion.
- Asia-Pacific: Rapid 5G network rollouts and rising smartphone penetration contribute to significant market growth.
- Rest of World: Emerging economies show increasing demand for 5G technology.
5G Mixers Product Landscape
The report details various 5G mixer products, including their functionalities, applications (e.g., base stations, small cells, user equipment), performance metrics (e.g., frequency range, conversion loss, isolation), and unique selling propositions. Technological advancements, like the integration of advanced materials and miniaturization techniques, are highlighted. The report also explores future product innovations based on emerging technological trends.
Key Drivers, Barriers & Challenges in 5G Mixers
Key Drivers: The primary drivers are increasing 5G network deployments globally, demand for high-speed data transmission, and the growing adoption of IoT devices. Technological advancements, such as the development of higher-frequency components, also contribute to growth.
Key Challenges: Supply chain disruptions, particularly regarding the availability of crucial raw materials and components, pose significant challenges. Stringent regulatory standards and increasing competition further complicate market dynamics. The report quantifies the impact of these challenges on market growth, for example, estimating a xx% reduction in growth due to supply chain issues in 2026.
Emerging Opportunities in 5G Mixers
Emerging opportunities include the expansion into untapped markets, such as developing countries with nascent 5G infrastructure. The growth of private 5G networks in industrial settings and the development of advanced applications like autonomous driving and remote surgery present significant growth opportunities. The integration of AI and machine learning in 5G mixer design and optimization also offers substantial potential.
Growth Accelerators in the 5G Mixers Industry
Long-term growth will be driven by technological breakthroughs, such as the development of more efficient and compact 5G mixers. Strategic partnerships between manufacturers and telecommunication companies will further accelerate market expansion. Governments' initiatives to promote 5G infrastructure development will be crucial in boosting market growth in the long term.
Key Players Shaping the 5G Mixers Market
- Analog Devices
- Marki Microwave
- Pasternack Enterprises Inc
- Mini-Circuits
- RF-Lambda
- DS Instruments
- ED2 Corp
- HXI
- MACOM
- MILLIBEAM
- United Monolithic Semiconductors
Notable Milestones in 5G Mixers Sector
- 2020-Q4: Mini-Circuits launches a new series of high-frequency 5G mixers.
- 2021-Q2: Analog Devices acquires a smaller 5G mixer manufacturer, expanding its product portfolio.
- 2022-Q3: Significant investments in R&D by major players leading to improved performance metrics.
- 2023-Q1: New regulatory standards impacting 5G mixer design and testing. (Further milestones to be added based on available data)
In-Depth 5G Mixers Market Outlook
The future of the 5G Mixers market is positive, with sustained growth driven by technological advancements and the expanding 5G ecosystem. The report highlights strategic opportunities for market players, including investments in R&D to develop innovative products, strategic partnerships to expand market reach, and focusing on niche applications within specific industry verticals. The market is poised for significant expansion throughout the forecast period, creating a favorable environment for both established players and new entrants.
5G Mixers Segmentation
-
1. Application
- 1.1. Wireless Infrastructure
- 1.2. Wired Broadband
- 1.3. Military & Defense & Aerospace
- 1.4. Others
-
2. Types
- 2.1. Double Balanced Mixer
- 2.2. Single Balanced Mixer
- 2.3. Triple Balanced Mixer
- 2.4. Others
5G Mixers Segmentation By Geography
-
1. North America
- 1.1. United States
- 1.2. Canada
- 1.3. Mexico
-
2. South America
- 2.1. Brazil
- 2.2. Argentina
- 2.3. Rest of South America
-
3. Europe
- 3.1. United Kingdom
- 3.2. Germany
- 3.3. France
- 3.4. Italy
- 3.5. Spain
- 3.6. Russia
- 3.7. Benelux
- 3.8. Nordics
- 3.9. Rest of Europe
-
4. Middle East & Africa
- 4.1. Turkey
- 4.2. Israel
- 4.3. GCC
- 4.4. North Africa
- 4.5. South Africa
- 4.6. Rest of Middle East & Africa
-
5. Asia Pacific
- 5.1. China
- 5.2. India
- 5.3. Japan
- 5.4. South Korea
- 5.5. ASEAN
- 5.6. Oceania
- 5.7. Rest of Asia Pacific
5G Mixers Regional Market Share
Geographic Coverage of 5G Mixers
5G Mixers REPORT HIGHLIGHTS
| Aspects | Details |
|---|---|
| Study Period | 2020-2034 |
| Base Year | 2025 |
| Estimated Year | 2026 |
| Forecast Period | 2026-2034 |
| Historical Period | 2020-2025 |
| Growth Rate | CAGR of 5.5% from 2020-2034 |
| Segmentation |
|
Table of Contents
- 1. Introduction
- 1.1. Research Scope
- 1.2. Market Segmentation
- 1.3. Research Methodology
- 1.4. Definitions and Assumptions
- 2. Executive Summary
- 2.1. Introduction
- 3. Market Dynamics
- 3.1. Introduction
- 3.2. Market Drivers
- 3.3. Market Restrains
- 3.4. Market Trends
- 4. Market Factor Analysis
- 4.1. Porters Five Forces
- 4.2. Supply/Value Chain
- 4.3. PESTEL analysis
- 4.4. Market Entropy
- 4.5. Patent/Trademark Analysis
- 5. Global 5G Mixers Analysis, Insights and Forecast, 2020-2032
- 5.1. Market Analysis, Insights and Forecast - by Application
- 5.1.1. Wireless Infrastructure
- 5.1.2. Wired Broadband
- 5.1.3. Military & Defense & Aerospace
- 5.1.4. Others
- 5.2. Market Analysis, Insights and Forecast - by Types
- 5.2.1. Double Balanced Mixer
- 5.2.2. Single Balanced Mixer
- 5.2.3. Triple Balanced Mixer
- 5.2.4. Others
- 5.3. Market Analysis, Insights and Forecast - by Region
- 5.3.1. North America
- 5.3.2. South America
- 5.3.3. Europe
- 5.3.4. Middle East & Africa
- 5.3.5. Asia Pacific
- 5.1. Market Analysis, Insights and Forecast - by Application
- 6. North America 5G Mixers Analysis, Insights and Forecast, 2020-2032
- 6.1. Market Analysis, Insights and Forecast - by Application
- 6.1.1. Wireless Infrastructure
- 6.1.2. Wired Broadband
- 6.1.3. Military & Defense & Aerospace
- 6.1.4. Others
- 6.2. Market Analysis, Insights and Forecast - by Types
- 6.2.1. Double Balanced Mixer
- 6.2.2. Single Balanced Mixer
- 6.2.3. Triple Balanced Mixer
- 6.2.4. Others
- 6.1. Market Analysis, Insights and Forecast - by Application
- 7. South America 5G Mixers Analysis, Insights and Forecast, 2020-2032
- 7.1. Market Analysis, Insights and Forecast - by Application
- 7.1.1. Wireless Infrastructure
- 7.1.2. Wired Broadband
- 7.1.3. Military & Defense & Aerospace
- 7.1.4. Others
- 7.2. Market Analysis, Insights and Forecast - by Types
- 7.2.1. Double Balanced Mixer
- 7.2.2. Single Balanced Mixer
- 7.2.3. Triple Balanced Mixer
- 7.2.4. Others
- 7.1. Market Analysis, Insights and Forecast - by Application
- 8. Europe 5G Mixers Analysis, Insights and Forecast, 2020-2032
- 8.1. Market Analysis, Insights and Forecast - by Application
- 8.1.1. Wireless Infrastructure
- 8.1.2. Wired Broadband
- 8.1.3. Military & Defense & Aerospace
- 8.1.4. Others
- 8.2. Market Analysis, Insights and Forecast - by Types
- 8.2.1. Double Balanced Mixer
- 8.2.2. Single Balanced Mixer
- 8.2.3. Triple Balanced Mixer
- 8.2.4. Others
- 8.1. Market Analysis, Insights and Forecast - by Application
- 9. Middle East & Africa 5G Mixers Analysis, Insights and Forecast, 2020-2032
- 9.1. Market Analysis, Insights and Forecast - by Application
- 9.1.1. Wireless Infrastructure
- 9.1.2. Wired Broadband
- 9.1.3. Military & Defense & Aerospace
- 9.1.4. Others
- 9.2. Market Analysis, Insights and Forecast - by Types
- 9.2.1. Double Balanced Mixer
- 9.2.2. Single Balanced Mixer
- 9.2.3. Triple Balanced Mixer
- 9.2.4. Others
- 9.1. Market Analysis, Insights and Forecast - by Application
- 10. Asia Pacific 5G Mixers Analysis, Insights and Forecast, 2020-2032
- 10.1. Market Analysis, Insights and Forecast - by Application
- 10.1.1. Wireless Infrastructure
- 10.1.2. Wired Broadband
- 10.1.3. Military & Defense & Aerospace
- 10.1.4. Others
- 10.2. Market Analysis, Insights and Forecast - by Types
- 10.2.1. Double Balanced Mixer
- 10.2.2. Single Balanced Mixer
- 10.2.3. Triple Balanced Mixer
- 10.2.4. Others
- 10.1. Market Analysis, Insights and Forecast - by Application
- 11. Competitive Analysis
- 11.1. Global Market Share Analysis 2025
- 11.2. Company Profiles
- 11.2.1 Analog Devices
- 11.2.1.1. Overview
- 11.2.1.2. Products
- 11.2.1.3. SWOT Analysis
- 11.2.1.4. Recent Developments
- 11.2.1.5. Financials (Based on Availability)
- 11.2.2 Marki Microwave
- 11.2.2.1. Overview
- 11.2.2.2. Products
- 11.2.2.3. SWOT Analysis
- 11.2.2.4. Recent Developments
- 11.2.2.5. Financials (Based on Availability)
- 11.2.3 Pasternack Enterprises Inc
- 11.2.3.1. Overview
- 11.2.3.2. Products
- 11.2.3.3. SWOT Analysis
- 11.2.3.4. Recent Developments
- 11.2.3.5. Financials (Based on Availability)
- 11.2.4 Mini Circuits
- 11.2.4.1. Overview
- 11.2.4.2. Products
- 11.2.4.3. SWOT Analysis
- 11.2.4.4. Recent Developments
- 11.2.4.5. Financials (Based on Availability)
- 11.2.5 RF-Lambda
- 11.2.5.1. Overview
- 11.2.5.2. Products
- 11.2.5.3. SWOT Analysis
- 11.2.5.4. Recent Developments
- 11.2.5.5. Financials (Based on Availability)
- 11.2.6 DS Instruments
- 11.2.6.1. Overview
- 11.2.6.2. Products
- 11.2.6.3. SWOT Analysis
- 11.2.6.4. Recent Developments
- 11.2.6.5. Financials (Based on Availability)
- 11.2.7 ED2 Corp
- 11.2.7.1. Overview
- 11.2.7.2. Products
- 11.2.7.3. SWOT Analysis
- 11.2.7.4. Recent Developments
- 11.2.7.5. Financials (Based on Availability)
- 11.2.8 HXI
- 11.2.8.1. Overview
- 11.2.8.2. Products
- 11.2.8.3. SWOT Analysis
- 11.2.8.4. Recent Developments
- 11.2.8.5. Financials (Based on Availability)
- 11.2.9 MACOM
- 11.2.9.1. Overview
- 11.2.9.2. Products
- 11.2.9.3. SWOT Analysis
- 11.2.9.4. Recent Developments
- 11.2.9.5. Financials (Based on Availability)
- 11.2.10 MILLIBEAM
- 11.2.10.1. Overview
- 11.2.10.2. Products
- 11.2.10.3. SWOT Analysis
- 11.2.10.4. Recent Developments
- 11.2.10.5. Financials (Based on Availability)
- 11.2.11 United Monolithic Semiconductors
- 11.2.11.1. Overview
- 11.2.11.2. Products
- 11.2.11.3. SWOT Analysis
- 11.2.11.4. Recent Developments
- 11.2.11.5. Financials (Based on Availability)
- 11.2.1 Analog Devices
List of Figures
- Figure 1: Global 5G Mixers Revenue Breakdown (million, %) by Region 2025 & 2033
- Figure 2: Global 5G Mixers Volume Breakdown (K, %) by Region 2025 & 2033
- Figure 3: North America 5G Mixers Revenue (million), by Application 2025 & 2033
- Figure 4: North America 5G Mixers Volume (K), by Application 2025 & 2033
- Figure 5: North America 5G Mixers Revenue Share (%), by Application 2025 & 2033
- Figure 6: North America 5G Mixers Volume Share (%), by Application 2025 & 2033
- Figure 7: North America 5G Mixers Revenue (million), by Types 2025 & 2033
- Figure 8: North America 5G Mixers Volume (K), by Types 2025 & 2033
- Figure 9: North America 5G Mixers Revenue Share (%), by Types 2025 & 2033
- Figure 10: North America 5G Mixers Volume Share (%), by Types 2025 & 2033
- Figure 11: North America 5G Mixers Revenue (million), by Country 2025 & 2033
- Figure 12: North America 5G Mixers Volume (K), by Country 2025 & 2033
- Figure 13: North America 5G Mixers Revenue Share (%), by Country 2025 & 2033
- Figure 14: North America 5G Mixers Volume Share (%), by Country 2025 & 2033
- Figure 15: South America 5G Mixers Revenue (million), by Application 2025 & 2033
- Figure 16: South America 5G Mixers Volume (K), by Application 2025 & 2033
- Figure 17: South America 5G Mixers Revenue Share (%), by Application 2025 & 2033
- Figure 18: South America 5G Mixers Volume Share (%), by Application 2025 & 2033
- Figure 19: South America 5G Mixers Revenue (million), by Types 2025 & 2033
- Figure 20: South America 5G Mixers Volume (K), by Types 2025 & 2033
- Figure 21: South America 5G Mixers Revenue Share (%), by Types 2025 & 2033
- Figure 22: South America 5G Mixers Volume Share (%), by Types 2025 & 2033
- Figure 23: South America 5G Mixers Revenue (million), by Country 2025 & 2033
- Figure 24: South America 5G Mixers Volume (K), by Country 2025 & 2033
- Figure 25: South America 5G Mixers Revenue Share (%), by Country 2025 & 2033
- Figure 26: South America 5G Mixers Volume Share (%), by Country 2025 & 2033
- Figure 27: Europe 5G Mixers Revenue (million), by Application 2025 & 2033
- Figure 28: Europe 5G Mixers Volume (K), by Application 2025 & 2033
- Figure 29: Europe 5G Mixers Revenue Share (%), by Application 2025 & 2033
- Figure 30: Europe 5G Mixers Volume Share (%), by Application 2025 & 2033
- Figure 31: Europe 5G Mixers Revenue (million), by Types 2025 & 2033
- Figure 32: Europe 5G Mixers Volume (K), by Types 2025 & 2033
- Figure 33: Europe 5G Mixers Revenue Share (%), by Types 2025 & 2033
- Figure 34: Europe 5G Mixers Volume Share (%), by Types 2025 & 2033
- Figure 35: Europe 5G Mixers Revenue (million), by Country 2025 & 2033
- Figure 36: Europe 5G Mixers Volume (K), by Country 2025 & 2033
- Figure 37: Europe 5G Mixers Revenue Share (%), by Country 2025 & 2033
- Figure 38: Europe 5G Mixers Volume Share (%), by Country 2025 & 2033
- Figure 39: Middle East & Africa 5G Mixers Revenue (million), by Application 2025 & 2033
- Figure 40: Middle East & Africa 5G Mixers Volume (K), by Application 2025 & 2033
- Figure 41: Middle East & Africa 5G Mixers Revenue Share (%), by Application 2025 & 2033
- Figure 42: Middle East & Africa 5G Mixers Volume Share (%), by Application 2025 & 2033
- Figure 43: Middle East & Africa 5G Mixers Revenue (million), by Types 2025 & 2033
- Figure 44: Middle East & Africa 5G Mixers Volume (K), by Types 2025 & 2033
- Figure 45: Middle East & Africa 5G Mixers Revenue Share (%), by Types 2025 & 2033
- Figure 46: Middle East & Africa 5G Mixers Volume Share (%), by Types 2025 & 2033
- Figure 47: Middle East & Africa 5G Mixers Revenue (million), by Country 2025 & 2033
- Figure 48: Middle East & Africa 5G Mixers Volume (K), by Country 2025 & 2033
- Figure 49: Middle East & Africa 5G Mixers Revenue Share (%), by Country 2025 & 2033
- Figure 50: Middle East & Africa 5G Mixers Volume Share (%), by Country 2025 & 2033
- Figure 51: Asia Pacific 5G Mixers Revenue (million), by Application 2025 & 2033
- Figure 52: Asia Pacific 5G Mixers Volume (K), by Application 2025 & 2033
- Figure 53: Asia Pacific 5G Mixers Revenue Share (%), by Application 2025 & 2033
- Figure 54: Asia Pacific 5G Mixers Volume Share (%), by Application 2025 & 2033
- Figure 55: Asia Pacific 5G Mixers Revenue (million), by Types 2025 & 2033
- Figure 56: Asia Pacific 5G Mixers Volume (K), by Types 2025 & 2033
- Figure 57: Asia Pacific 5G Mixers Revenue Share (%), by Types 2025 & 2033
- Figure 58: Asia Pacific 5G Mixers Volume Share (%), by Types 2025 & 2033
- Figure 59: Asia Pacific 5G Mixers Revenue (million), by Country 2025 & 2033
- Figure 60: Asia Pacific 5G Mixers Volume (K), by Country 2025 & 2033
- Figure 61: Asia Pacific 5G Mixers Revenue Share (%), by Country 2025 & 2033
- Figure 62: Asia Pacific 5G Mixers Volume Share (%), by Country 2025 & 2033
List of Tables
- Table 1: Global 5G Mixers Revenue million Forecast, by Application 2020 & 2033
- Table 2: Global 5G Mixers Volume K Forecast, by Application 2020 & 2033
- Table 3: Global 5G Mixers Revenue million Forecast, by Types 2020 & 2033
- Table 4: Global 5G Mixers Volume K Forecast, by Types 2020 & 2033
- Table 5: Global 5G Mixers Revenue million Forecast, by Region 2020 & 2033
- Table 6: Global 5G Mixers Volume K Forecast, by Region 2020 & 2033
- Table 7: Global 5G Mixers Revenue million Forecast, by Application 2020 & 2033
- Table 8: Global 5G Mixers Volume K Forecast, by Application 2020 & 2033
- Table 9: Global 5G Mixers Revenue million Forecast, by Types 2020 & 2033
- Table 10: Global 5G Mixers Volume K Forecast, by Types 2020 & 2033
- Table 11: Global 5G Mixers Revenue million Forecast, by Country 2020 & 2033
- Table 12: Global 5G Mixers Volume K Forecast, by Country 2020 & 2033
- Table 13: United States 5G Mixers Revenue (million) Forecast, by Application 2020 & 2033
- Table 14: United States 5G Mixers Volume (K) Forecast, by Application 2020 & 2033
- Table 15: Canada 5G Mixers Revenue (million) Forecast, by Application 2020 & 2033
- Table 16: Canada 5G Mixers Volume (K) Forecast, by Application 2020 & 2033
- Table 17: Mexico 5G Mixers Revenue (million) Forecast, by Application 2020 & 2033
- Table 18: Mexico 5G Mixers Volume (K) Forecast, by Application 2020 & 2033
- Table 19: Global 5G Mixers Revenue million Forecast, by Application 2020 & 2033
- Table 20: Global 5G Mixers Volume K Forecast, by Application 2020 & 2033
- Table 21: Global 5G Mixers Revenue million Forecast, by Types 2020 & 2033
- Table 22: Global 5G Mixers Volume K Forecast, by Types 2020 & 2033
- Table 23: Global 5G Mixers Revenue million Forecast, by Country 2020 & 2033
- Table 24: Global 5G Mixers Volume K Forecast, by Country 2020 & 2033
- Table 25: Brazil 5G Mixers Revenue (million) Forecast, by Application 2020 & 2033
- Table 26: Brazil 5G Mixers Volume (K) Forecast, by Application 2020 & 2033
- Table 27: Argentina 5G Mixers Revenue (million) Forecast, by Application 2020 & 2033
- Table 28: Argentina 5G Mixers Volume (K) Forecast, by Application 2020 & 2033
- Table 29: Rest of South America 5G Mixers Revenue (million) Forecast, by Application 2020 & 2033
- Table 30: Rest of South America 5G Mixers Volume (K) Forecast, by Application 2020 & 2033
- Table 31: Global 5G Mixers Revenue million Forecast, by Application 2020 & 2033
- Table 32: Global 5G Mixers Volume K Forecast, by Application 2020 & 2033
- Table 33: Global 5G Mixers Revenue million Forecast, by Types 2020 & 2033
- Table 34: Global 5G Mixers Volume K Forecast, by Types 2020 & 2033
- Table 35: Global 5G Mixers Revenue million Forecast, by Country 2020 & 2033
- Table 36: Global 5G Mixers Volume K Forecast, by Country 2020 & 2033
- Table 37: United Kingdom 5G Mixers Revenue (million) Forecast, by Application 2020 & 2033
- Table 38: United Kingdom 5G Mixers Volume (K) Forecast, by Application 2020 & 2033
- Table 39: Germany 5G Mixers Revenue (million) Forecast, by Application 2020 & 2033
- Table 40: Germany 5G Mixers Volume (K) Forecast, by Application 2020 & 2033
- Table 41: France 5G Mixers Revenue (million) Forecast, by Application 2020 & 2033
- Table 42: France 5G Mixers Volume (K) Forecast, by Application 2020 & 2033
- Table 43: Italy 5G Mixers Revenue (million) Forecast, by Application 2020 & 2033
- Table 44: Italy 5G Mixers Volume (K) Forecast, by Application 2020 & 2033
- Table 45: Spain 5G Mixers Revenue (million) Forecast, by Application 2020 & 2033
- Table 46: Spain 5G Mixers Volume (K) Forecast, by Application 2020 & 2033
- Table 47: Russia 5G Mixers Revenue (million) Forecast, by Application 2020 & 2033
- Table 48: Russia 5G Mixers Volume (K) Forecast, by Application 2020 & 2033
- Table 49: Benelux 5G Mixers Revenue (million) Forecast, by Application 2020 & 2033
- Table 50: Benelux 5G Mixers Volume (K) Forecast, by Application 2020 & 2033
- Table 51: Nordics 5G Mixers Revenue (million) Forecast, by Application 2020 & 2033
- Table 52: Nordics 5G Mixers Volume (K) Forecast, by Application 2020 & 2033
- Table 53: Rest of Europe 5G Mixers Revenue (million) Forecast, by Application 2020 & 2033
- Table 54: Rest of Europe 5G Mixers Volume (K) Forecast, by Application 2020 & 2033
- Table 55: Global 5G Mixers Revenue million Forecast, by Application 2020 & 2033
- Table 56: Global 5G Mixers Volume K Forecast, by Application 2020 & 2033
- Table 57: Global 5G Mixers Revenue million Forecast, by Types 2020 & 2033
- Table 58: Global 5G Mixers Volume K Forecast, by Types 2020 & 2033
- Table 59: Global 5G Mixers Revenue million Forecast, by Country 2020 & 2033
- Table 60: Global 5G Mixers Volume K Forecast, by Country 2020 & 2033
- Table 61: Turkey 5G Mixers Revenue (million) Forecast, by Application 2020 & 2033
- Table 62: Turkey 5G Mixers Volume (K) Forecast, by Application 2020 & 2033
- Table 63: Israel 5G Mixers Revenue (million) Forecast, by Application 2020 & 2033
- Table 64: Israel 5G Mixers Volume (K) Forecast, by Application 2020 & 2033
- Table 65: GCC 5G Mixers Revenue (million) Forecast, by Application 2020 & 2033
- Table 66: GCC 5G Mixers Volume (K) Forecast, by Application 2020 & 2033
- Table 67: North Africa 5G Mixers Revenue (million) Forecast, by Application 2020 & 2033
- Table 68: North Africa 5G Mixers Volume (K) Forecast, by Application 2020 & 2033
- Table 69: South Africa 5G Mixers Revenue (million) Forecast, by Application 2020 & 2033
- Table 70: South Africa 5G Mixers Volume (K) Forecast, by Application 2020 & 2033
- Table 71: Rest of Middle East & Africa 5G Mixers Revenue (million) Forecast, by Application 2020 & 2033
- Table 72: Rest of Middle East & Africa 5G Mixers Volume (K) Forecast, by Application 2020 & 2033
- Table 73: Global 5G Mixers Revenue million Forecast, by Application 2020 & 2033
- Table 74: Global 5G Mixers Volume K Forecast, by Application 2020 & 2033
- Table 75: Global 5G Mixers Revenue million Forecast, by Types 2020 & 2033
- Table 76: Global 5G Mixers Volume K Forecast, by Types 2020 & 2033
- Table 77: Global 5G Mixers Revenue million Forecast, by Country 2020 & 2033
- Table 78: Global 5G Mixers Volume K Forecast, by Country 2020 & 2033
- Table 79: China 5G Mixers Revenue (million) Forecast, by Application 2020 & 2033
- Table 80: China 5G Mixers Volume (K) Forecast, by Application 2020 & 2033
- Table 81: India 5G Mixers Revenue (million) Forecast, by Application 2020 & 2033
- Table 82: India 5G Mixers Volume (K) Forecast, by Application 2020 & 2033
- Table 83: Japan 5G Mixers Revenue (million) Forecast, by Application 2020 & 2033
- Table 84: Japan 5G Mixers Volume (K) Forecast, by Application 2020 & 2033
- Table 85: South Korea 5G Mixers Revenue (million) Forecast, by Application 2020 & 2033
- Table 86: South Korea 5G Mixers Volume (K) Forecast, by Application 2020 & 2033
- Table 87: ASEAN 5G Mixers Revenue (million) Forecast, by Application 2020 & 2033
- Table 88: ASEAN 5G Mixers Volume (K) Forecast, by Application 2020 & 2033
- Table 89: Oceania 5G Mixers Revenue (million) Forecast, by Application 2020 & 2033
- Table 90: Oceania 5G Mixers Volume (K) Forecast, by Application 2020 & 2033
- Table 91: Rest of Asia Pacific 5G Mixers Revenue (million) Forecast, by Application 2020 & 2033
- Table 92: Rest of Asia Pacific 5G Mixers Volume (K) Forecast, by Application 2020 & 2033
Frequently Asked Questions
1. What is the projected Compound Annual Growth Rate (CAGR) of the 5G Mixers?
The projected CAGR is approximately 5.5%.
2. Which companies are prominent players in the 5G Mixers?
Key companies in the market include Analog Devices, Marki Microwave, Pasternack Enterprises Inc, Mini Circuits, RF-Lambda, DS Instruments, ED2 Corp, HXI, MACOM, MILLIBEAM, United Monolithic Semiconductors.
3. What are the main segments of the 5G Mixers?
The market segments include Application, Types.
4. Can you provide details about the market size?
The market size is estimated to be USD 776 million as of 2022.
5. What are some drivers contributing to market growth?
N/A
6. What are the notable trends driving market growth?
N/A
7. Are there any restraints impacting market growth?
N/A
8. Can you provide examples of recent developments in the market?
N/A
9. What pricing options are available for accessing the report?
Pricing options include single-user, multi-user, and enterprise licenses priced at USD 3950.00, USD 5925.00, and USD 7900.00 respectively.
10. Is the market size provided in terms of value or volume?
The market size is provided in terms of value, measured in million and volume, measured in K.
11. Are there any specific market keywords associated with the report?
Yes, the market keyword associated with the report is "5G Mixers," which aids in identifying and referencing the specific market segment covered.
12. How do I determine which pricing option suits my needs best?
The pricing options vary based on user requirements and access needs. Individual users may opt for single-user licenses, while businesses requiring broader access may choose multi-user or enterprise licenses for cost-effective access to the report.
13. Are there any additional resources or data provided in the 5G Mixers report?
While the report offers comprehensive insights, it's advisable to review the specific contents or supplementary materials provided to ascertain if additional resources or data are available.
14. How can I stay updated on further developments or reports in the 5G Mixers?
To stay informed about further developments, trends, and reports in the 5G Mixers, consider subscribing to industry newsletters, following relevant companies and organizations, or regularly checking reputable industry news sources and publications.
Methodology
Step 1 - Identification of Relevant Samples Size from Population Database


Step 2 - Approaches for Defining Global Market Size (Value, Volume* & Price*)

Note*: In applicable scenarios
Step 3 - Data Sources
Primary Research
- Web Analytics
- Survey Reports
- Research Institute
- Latest Research Reports
- Opinion Leaders
Secondary Research
- Annual Reports
- White Paper
- Latest Press Release
- Industry Association
- Paid Database
- Investor Presentations

Step 4 - Data Triangulation
Involves using different sources of information in order to increase the validity of a study
These sources are likely to be stakeholders in a program - participants, other researchers, program staff, other community members, and so on.
Then we put all data in single framework & apply various statistical tools to find out the dynamic on the market.
During the analysis stage, feedback from the stakeholder groups would be compared to determine areas of agreement as well as areas of divergence