

Key Insights
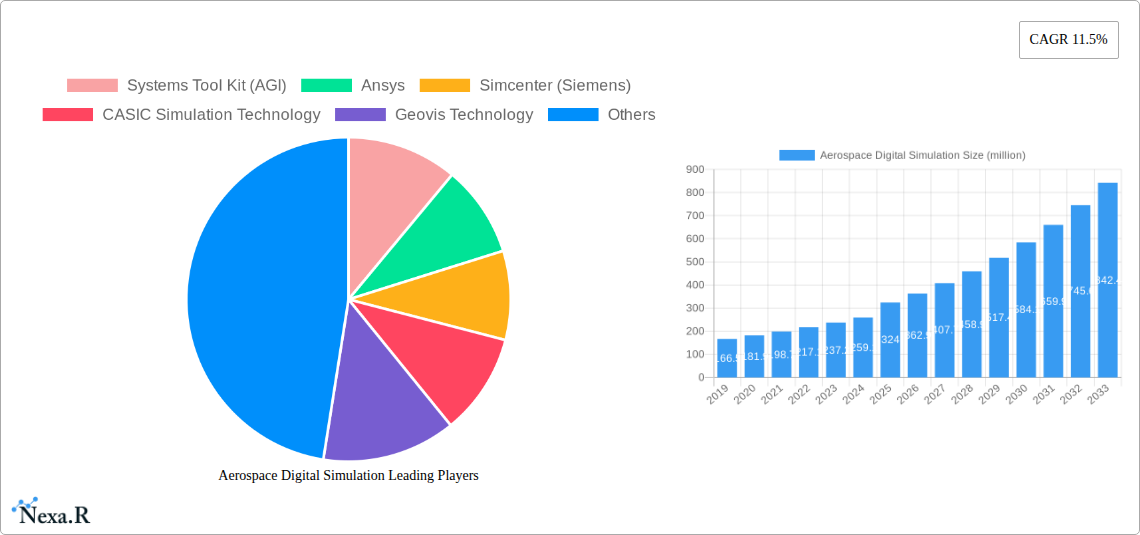
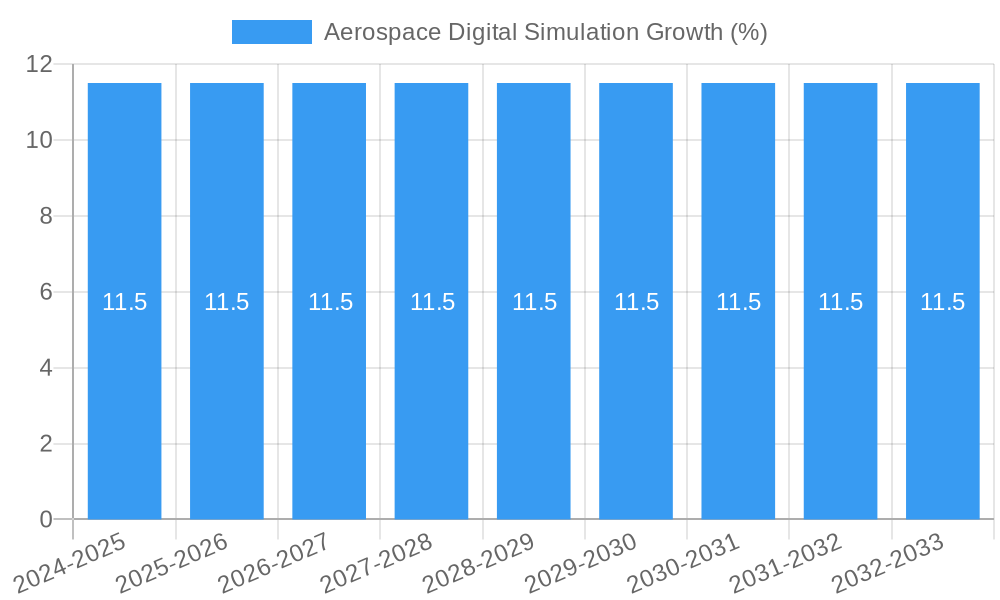
The global Aerospace Digital Simulation market is poised for significant expansion, projected to reach an estimated \$324 million in 2025 and demonstrating a robust Compound Annual Growth Rate (CAGR) of 11.5% throughout the forecast period extending to 2033. This impressive growth is primarily fueled by the escalating demand for advanced simulation solutions in both civilian and commercial aerospace sectors. Key drivers include the imperative to reduce development costs, shorten product lifecycles, and enhance the safety and performance of aircraft through rigorous virtual testing. The increasing complexity of modern aircraft designs, coupled with the need for efficient aerodynamic analysis, structural integrity assessments, and flight dynamics simulations, further propels market adoption. Furthermore, the rise of digital twin technology and the integration of AI and machine learning into simulation processes are creating new avenues for innovation and efficiency, making digital simulation an indispensable tool for aerospace manufacturers and regulatory bodies.
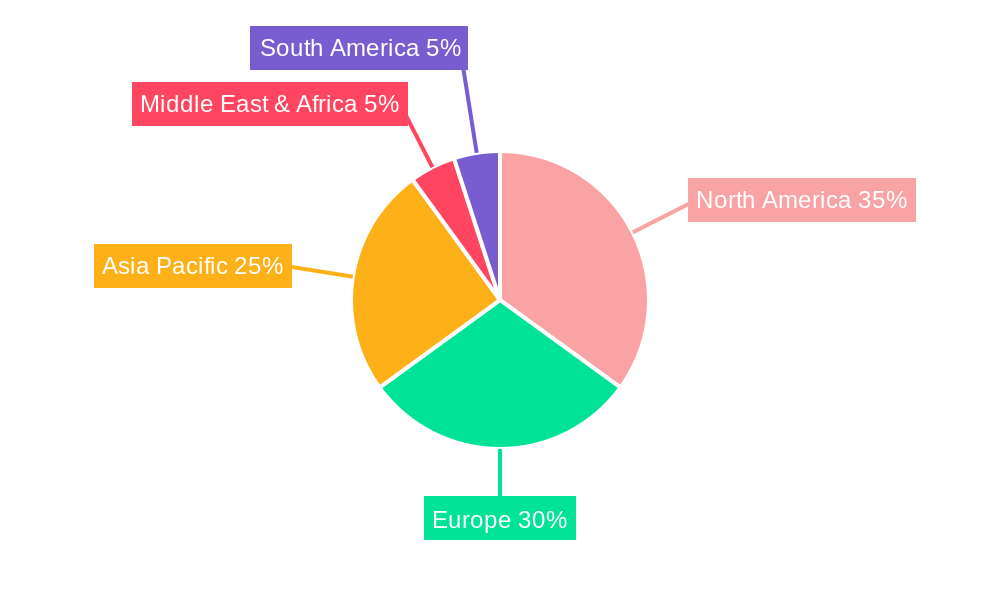
The market is characterized by distinct trends, including a strong preference for cloud-based simulation solutions due to their scalability, accessibility, and cost-effectiveness, alongside continued adoption of on-premise systems for specific high-security or legacy applications. Geographically, North America and Europe are expected to remain dominant markets, driven by established aerospace industries and significant investments in R&D. However, the Asia Pacific region, particularly China and India, is anticipated to witness the fastest growth, owing to the rapid expansion of their domestic aerospace manufacturing capabilities and increasing government support for advanced technological adoption. Restraints, such as the high initial investment costs for sophisticated simulation software and hardware, and the need for specialized skilled personnel, may temper growth in certain segments. Nevertheless, the overwhelming benefits in terms of improved design optimization, reduced physical prototyping, and enhanced product reliability are expected to overcome these challenges, solidifying the critical role of digital simulation in the future of aerospace.
This in-depth report offers an indispensable analysis of the global Aerospace Digital Simulation market, forecasting its evolution from 2019 to 2033, with a base and estimated year of 2025. We delve into critical market dynamics, growth trends, regional dominance, product landscapes, key drivers, barriers, emerging opportunities, and growth accelerators. This research is vital for industry stakeholders seeking to understand market concentration, technological innovation drivers, regulatory frameworks, competitive product substitutes, end-user demographics, and M&A trends.
Aerospace Digital Simulation Market Dynamics & Structure
The Aerospace Digital Simulation market is characterized by a moderately consolidated structure, with key players like Ansys, Simcenter (Siemens), and Systems Tool Kit (AGI) holding significant market share. Technological innovation remains a primary driver, fueled by advancements in AI, machine learning, and high-performance computing, enabling more accurate and complex simulations for aircraft design, testing, and operational optimization. Regulatory frameworks, particularly stringent safety and certification standards from bodies like the FAA and EASA, are instrumental in shaping simulation methodologies and demanding robust validation processes. Competitive product substitutes, while present in traditional testing methods, are increasingly being displaced by the cost-effectiveness and speed of digital simulations. End-user demographics are shifting towards a greater demand for integrated simulation solutions across the entire aerospace lifecycle, from conceptual design to in-service maintenance. Mergers and acquisitions (M&A) activity, valued at approximately $500 million in the historical period (2019-2024), indicates a trend towards consolidation and expansion of capabilities among leading simulation providers.
- Market Concentration: Dominated by a few key global players, with a growing presence of specialized regional providers.
- Technological Innovation Drivers: AI/ML integration, cloud-based simulation platforms, digital twin technology, and advanced visualization tools.
- Regulatory Frameworks: Emphasis on safety, certification, and compliance standards driving the need for advanced validation tools.
- Competitive Product Substitutes: Traditional physical testing methods are gradually being replaced by cost-efficient and faster digital alternatives.
- End-User Demographics: Increasing demand from commercial aerospace for faster product development cycles and from civilian aerospace for enhanced safety and efficiency.
- M&A Trends: Strategic acquisitions aimed at expanding product portfolios, geographical reach, and technological expertise.
Aerospace Digital Simulation Growth Trends & Insights
The Aerospace Digital Simulation market is poised for robust growth, driven by the increasing complexity of aircraft designs, the imperative for reduced development costs, and the growing emphasis on flight safety and efficiency. The market size, estimated at $10,500 million in 2025, is projected to expand at a Compound Annual Growth Rate (CAGR) of 12.5% during the forecast period (2025–2033), reaching an estimated $25,700 million by 2033. Adoption rates are escalating as aerospace manufacturers increasingly integrate digital simulation into their R&D workflows, reducing the need for expensive and time-consuming physical prototypes. Technological disruptions, such as the widespread adoption of cloud-based simulation platforms and the advancement of digital twin technology, are further accelerating this trend. Cloud-based solutions offer scalability, accessibility, and cost-effectiveness, while digital twins provide real-time performance monitoring and predictive maintenance capabilities, enhancing operational efficiency and reducing downtime. Consumer behavior shifts are also playing a role, with a growing preference for sustainable aviation solutions that can be effectively designed and validated through advanced simulations. The historical period (2019–2024) witnessed a CAGR of 10.8%, indicating a consistent upward trajectory.
Dominant Regions, Countries, or Segments in Aerospace Digital Simulation
The Commercial Aerospace segment is the dominant force driving growth in the global Aerospace Digital Simulation market, with an estimated market share of 65% in 2025. This dominance stems from the continuous demand for new aircraft models, fleet expansions, and the need for enhanced fuel efficiency and reduced emissions. Leading countries such as the United States and those within the European Union, home to major aerospace manufacturers like Boeing and Airbus, are spearheading adoption. The "On-premise" deployment model currently holds a larger market share of 58% in 2025 due to the critical nature of aerospace data and existing IT infrastructure, though "Cloud-based" solutions are rapidly gaining traction due to their scalability and accessibility. Economic policies in these dominant regions, including government investments in aerospace research and development and favorable trade agreements, further stimulate market expansion. Infrastructure development, such as advanced manufacturing facilities and robust R&D centers, also plays a crucial role in fostering the widespread use of digital simulation tools. The Asia-Pacific region, particularly China, is emerging as a significant growth market, driven by its expanding aerospace manufacturing capabilities and increasing investments in indigenous aircraft development. Civilian Aerospace, while a smaller segment at present with an estimated 25% market share in 2025, is expected to witness substantial growth, driven by advancements in urban air mobility (UAM) and drone technology, requiring sophisticated simulation for safety and certification.
- Dominant Segment (Application): Commercial Aerospace (65% market share in 2025)
- Dominant Segment (Type): On-premise (58% market share in 2025)
- Leading Regions: North America (USA) and Europe (EU nations)
- Key Drivers in Dominant Regions: Government R&D funding, robust aerospace manufacturing base, favorable regulatory environments, and strong demand for new aircraft.
- Emerging Growth Market: Asia-Pacific (China)
Aerospace Digital Simulation Product Landscape
The Aerospace Digital Simulation product landscape is defined by sophisticated software suites and integrated platforms designed for comprehensive aircraft lifecycle management. Companies are focusing on developing solutions that offer advanced computational fluid dynamics (CFD), finite element analysis (FEA), multibody dynamics, and mission planning capabilities. Innovations include real-time simulation, integrated multidisciplinary optimization (MDO), and AI-driven design exploration. Unique selling propositions revolve around increased simulation fidelity, faster computation times, and seamless integration with design and manufacturing workflows. Technological advancements are enabling the simulation of increasingly complex phenomena, from extreme weather conditions to intricate structural stresses, providing engineers with unprecedented insights into aircraft performance and safety.
Key Drivers, Barriers & Challenges in Aerospace Digital Simulation
The Aerospace Digital Simulation market is propelled by several key drivers: the imperative for cost reduction in aircraft development, the increasing complexity of aerospace systems demanding advanced analytical tools, and the stringent safety and certification requirements necessitating rigorous virtual testing. Technological advancements in computing power and algorithms are enabling more accurate and sophisticated simulations, further accelerating adoption.
- Key Drivers:
- Cost-effectiveness of virtual prototyping over physical testing.
- Demand for higher performance, fuel efficiency, and reduced emissions.
- Stringent safety and certification mandates.
- Advancements in computational power and simulation algorithms.
However, the market faces significant barriers and challenges. High initial investment costs for advanced simulation software and hardware can be a hurdle for smaller enterprises. Data security and intellectual property protection concerns, especially with cloud-based solutions, are critical. The need for highly skilled personnel to operate and interpret complex simulation results also presents a challenge, leading to a shortage of qualified professionals. Regulatory hurdles, while driving innovation, can also create complexities in validating new simulation methodologies. Supply chain issues can impact the availability of specialized hardware required for high-performance computing.
- Key Barriers & Challenges:
- High initial software and hardware investment.
- Data security and intellectual property concerns.
- Shortage of skilled simulation engineers.
- Complex regulatory approval processes for new simulation techniques.
- Dependence on specialized hardware and potential supply chain disruptions.
Emerging Opportunities in Aerospace Digital Simulation
Emerging opportunities in the Aerospace Digital Simulation sector lie in the growing demand for sustainable aviation solutions, the expansion of urban air mobility (UAM), and the increasing adoption of digital twin technology for predictive maintenance and operational optimization. The integration of AI and machine learning for autonomous design exploration and anomaly detection presents a significant untapped market. Furthermore, the development of more accessible, cloud-native simulation platforms catering to smaller aerospace companies and startups offers a pathway to wider market penetration.
Growth Accelerators in the Aerospace Digital Simulation Industry
Growth in the Aerospace Digital Simulation industry is being significantly accelerated by strategic partnerships between software providers and aerospace manufacturers, fostering the co-development of specialized simulation tools. Technological breakthroughs in areas like GPU computing and advanced meshing algorithms are enabling faster and more detailed simulations. Furthermore, the increasing adoption of simulation-driven design methodologies by major aerospace players, coupled with governmental initiatives promoting digital transformation within the defense and commercial aerospace sectors, are acting as powerful catalysts for sustained growth.
Key Players Shaping the Aerospace Digital Simulation Market
- Ansys
- Simcenter (Siemens)
- Systems Tool Kit (AGI)
- CASIC Simulation Technology
- Geovis Technology
- Shanghai Paisatellite Information Technology
Notable Milestones in Aerospace Digital Simulation Sector
- 2021: Ansys announces integration of AI/ML for design optimization, improving simulation efficiency by 30%.
- 2022: Siemens launches Simcenter 3D 2022, featuring enhanced cloud deployment options and expanded multi-physics simulation capabilities.
- 2023: AGI releases STK 12, incorporating advanced multi-domain simulation for satellite and aerospace systems.
- 2023: CASIC Simulation Technology reports significant advancements in high-fidelity aerodynamic simulations for next-generation aircraft.
- 2024: Geovis Technology expands its geospatial simulation capabilities for defense applications.
- 2024: Shanghai Paisatellite Information Technology develops novel simulation frameworks for satellite constellation management.
In-Depth Aerospace Digital Simulation Market Outlook
The future outlook for the Aerospace Digital Simulation market is exceptionally promising, driven by ongoing technological advancements and the indispensable role of digital simulation in addressing the evolving needs of the aerospace industry. Growth accelerators such as the pursuit of sustainable aviation, the burgeoning urban air mobility sector, and the widespread implementation of digital twins for enhanced operational efficiency will continue to fuel market expansion. Strategic partnerships and increased governmental support for digital transformation initiatives will further solidify the market's trajectory, offering substantial opportunities for innovation and growth in the coming years.
Aerospace Digital Simulation Segmentation
-
1. Application
- 1.1. Civilian Aerospace
- 1.2. Commercial Aerospace
- 1.3. Others
-
2. Types
- 2.1. Cloud-based
- 2.2. On-premise
Aerospace Digital Simulation Segmentation By Geography
-
1. North America
- 1.1. United States
- 1.2. Canada
- 1.3. Mexico
-
2. South America
- 2.1. Brazil
- 2.2. Argentina
- 2.3. Rest of South America
-
3. Europe
- 3.1. United Kingdom
- 3.2. Germany
- 3.3. France
- 3.4. Italy
- 3.5. Spain
- 3.6. Russia
- 3.7. Benelux
- 3.8. Nordics
- 3.9. Rest of Europe
-
4. Middle East & Africa
- 4.1. Turkey
- 4.2. Israel
- 4.3. GCC
- 4.4. North Africa
- 4.5. South Africa
- 4.6. Rest of Middle East & Africa
-
5. Asia Pacific
- 5.1. China
- 5.2. India
- 5.3. Japan
- 5.4. South Korea
- 5.5. ASEAN
- 5.6. Oceania
- 5.7. Rest of Asia Pacific
Aerospace Digital Simulation REPORT HIGHLIGHTS
| Aspects | Details |
|---|---|
| Study Period | 2019-2033 |
| Base Year | 2024 |
| Estimated Year | 2025 |
| Forecast Period | 2025-2033 |
| Historical Period | 2019-2024 |
| Growth Rate | CAGR of 11.5% from 2019-2033 |
| Segmentation |
|
Table of Contents
- 1. Introduction
- 1.1. Research Scope
- 1.2. Market Segmentation
- 1.3. Research Methodology
- 1.4. Definitions and Assumptions
- 2. Executive Summary
- 2.1. Introduction
- 3. Market Dynamics
- 3.1. Introduction
- 3.2. Market Drivers
- 3.3. Market Restrains
- 3.4. Market Trends
- 4. Market Factor Analysis
- 4.1. Porters Five Forces
- 4.2. Supply/Value Chain
- 4.3. PESTEL analysis
- 4.4. Market Entropy
- 4.5. Patent/Trademark Analysis
- 5. Global Aerospace Digital Simulation Analysis, Insights and Forecast, 2019-2031
- 5.1. Market Analysis, Insights and Forecast - by Application
- 5.1.1. Civilian Aerospace
- 5.1.2. Commercial Aerospace
- 5.1.3. Others
- 5.2. Market Analysis, Insights and Forecast - by Types
- 5.2.1. Cloud-based
- 5.2.2. On-premise
- 5.3. Market Analysis, Insights and Forecast - by Region
- 5.3.1. North America
- 5.3.2. South America
- 5.3.3. Europe
- 5.3.4. Middle East & Africa
- 5.3.5. Asia Pacific
- 5.1. Market Analysis, Insights and Forecast - by Application
- 6. North America Aerospace Digital Simulation Analysis, Insights and Forecast, 2019-2031
- 6.1. Market Analysis, Insights and Forecast - by Application
- 6.1.1. Civilian Aerospace
- 6.1.2. Commercial Aerospace
- 6.1.3. Others
- 6.2. Market Analysis, Insights and Forecast - by Types
- 6.2.1. Cloud-based
- 6.2.2. On-premise
- 6.1. Market Analysis, Insights and Forecast - by Application
- 7. South America Aerospace Digital Simulation Analysis, Insights and Forecast, 2019-2031
- 7.1. Market Analysis, Insights and Forecast - by Application
- 7.1.1. Civilian Aerospace
- 7.1.2. Commercial Aerospace
- 7.1.3. Others
- 7.2. Market Analysis, Insights and Forecast - by Types
- 7.2.1. Cloud-based
- 7.2.2. On-premise
- 7.1. Market Analysis, Insights and Forecast - by Application
- 8. Europe Aerospace Digital Simulation Analysis, Insights and Forecast, 2019-2031
- 8.1. Market Analysis, Insights and Forecast - by Application
- 8.1.1. Civilian Aerospace
- 8.1.2. Commercial Aerospace
- 8.1.3. Others
- 8.2. Market Analysis, Insights and Forecast - by Types
- 8.2.1. Cloud-based
- 8.2.2. On-premise
- 8.1. Market Analysis, Insights and Forecast - by Application
- 9. Middle East & Africa Aerospace Digital Simulation Analysis, Insights and Forecast, 2019-2031
- 9.1. Market Analysis, Insights and Forecast - by Application
- 9.1.1. Civilian Aerospace
- 9.1.2. Commercial Aerospace
- 9.1.3. Others
- 9.2. Market Analysis, Insights and Forecast - by Types
- 9.2.1. Cloud-based
- 9.2.2. On-premise
- 9.1. Market Analysis, Insights and Forecast - by Application
- 10. Asia Pacific Aerospace Digital Simulation Analysis, Insights and Forecast, 2019-2031
- 10.1. Market Analysis, Insights and Forecast - by Application
- 10.1.1. Civilian Aerospace
- 10.1.2. Commercial Aerospace
- 10.1.3. Others
- 10.2. Market Analysis, Insights and Forecast - by Types
- 10.2.1. Cloud-based
- 10.2.2. On-premise
- 10.1. Market Analysis, Insights and Forecast - by Application
- 11. Competitive Analysis
- 11.1. Global Market Share Analysis 2024
- 11.2. Company Profiles
- 11.2.1 Systems Tool Kit (AGI)
- 11.2.1.1. Overview
- 11.2.1.2. Products
- 11.2.1.3. SWOT Analysis
- 11.2.1.4. Recent Developments
- 11.2.1.5. Financials (Based on Availability)
- 11.2.2 Ansys
- 11.2.2.1. Overview
- 11.2.2.2. Products
- 11.2.2.3. SWOT Analysis
- 11.2.2.4. Recent Developments
- 11.2.2.5. Financials (Based on Availability)
- 11.2.3 Simcenter (Siemens)
- 11.2.3.1. Overview
- 11.2.3.2. Products
- 11.2.3.3. SWOT Analysis
- 11.2.3.4. Recent Developments
- 11.2.3.5. Financials (Based on Availability)
- 11.2.4 CASIC Simulation Technology
- 11.2.4.1. Overview
- 11.2.4.2. Products
- 11.2.4.3. SWOT Analysis
- 11.2.4.4. Recent Developments
- 11.2.4.5. Financials (Based on Availability)
- 11.2.5 Geovis Technology
- 11.2.5.1. Overview
- 11.2.5.2. Products
- 11.2.5.3. SWOT Analysis
- 11.2.5.4. Recent Developments
- 11.2.5.5. Financials (Based on Availability)
- 11.2.6 Shanghai Paisatellite Information Technology
- 11.2.6.1. Overview
- 11.2.6.2. Products
- 11.2.6.3. SWOT Analysis
- 11.2.6.4. Recent Developments
- 11.2.6.5. Financials (Based on Availability)
- 11.2.1 Systems Tool Kit (AGI)
List of Figures
- Figure 1: Global Aerospace Digital Simulation Revenue Breakdown (million, %) by Region 2024 & 2032
- Figure 2: North America Aerospace Digital Simulation Revenue (million), by Application 2024 & 2032
- Figure 3: North America Aerospace Digital Simulation Revenue Share (%), by Application 2024 & 2032
- Figure 4: North America Aerospace Digital Simulation Revenue (million), by Types 2024 & 2032
- Figure 5: North America Aerospace Digital Simulation Revenue Share (%), by Types 2024 & 2032
- Figure 6: North America Aerospace Digital Simulation Revenue (million), by Country 2024 & 2032
- Figure 7: North America Aerospace Digital Simulation Revenue Share (%), by Country 2024 & 2032
- Figure 8: South America Aerospace Digital Simulation Revenue (million), by Application 2024 & 2032
- Figure 9: South America Aerospace Digital Simulation Revenue Share (%), by Application 2024 & 2032
- Figure 10: South America Aerospace Digital Simulation Revenue (million), by Types 2024 & 2032
- Figure 11: South America Aerospace Digital Simulation Revenue Share (%), by Types 2024 & 2032
- Figure 12: South America Aerospace Digital Simulation Revenue (million), by Country 2024 & 2032
- Figure 13: South America Aerospace Digital Simulation Revenue Share (%), by Country 2024 & 2032
- Figure 14: Europe Aerospace Digital Simulation Revenue (million), by Application 2024 & 2032
- Figure 15: Europe Aerospace Digital Simulation Revenue Share (%), by Application 2024 & 2032
- Figure 16: Europe Aerospace Digital Simulation Revenue (million), by Types 2024 & 2032
- Figure 17: Europe Aerospace Digital Simulation Revenue Share (%), by Types 2024 & 2032
- Figure 18: Europe Aerospace Digital Simulation Revenue (million), by Country 2024 & 2032
- Figure 19: Europe Aerospace Digital Simulation Revenue Share (%), by Country 2024 & 2032
- Figure 20: Middle East & Africa Aerospace Digital Simulation Revenue (million), by Application 2024 & 2032
- Figure 21: Middle East & Africa Aerospace Digital Simulation Revenue Share (%), by Application 2024 & 2032
- Figure 22: Middle East & Africa Aerospace Digital Simulation Revenue (million), by Types 2024 & 2032
- Figure 23: Middle East & Africa Aerospace Digital Simulation Revenue Share (%), by Types 2024 & 2032
- Figure 24: Middle East & Africa Aerospace Digital Simulation Revenue (million), by Country 2024 & 2032
- Figure 25: Middle East & Africa Aerospace Digital Simulation Revenue Share (%), by Country 2024 & 2032
- Figure 26: Asia Pacific Aerospace Digital Simulation Revenue (million), by Application 2024 & 2032
- Figure 27: Asia Pacific Aerospace Digital Simulation Revenue Share (%), by Application 2024 & 2032
- Figure 28: Asia Pacific Aerospace Digital Simulation Revenue (million), by Types 2024 & 2032
- Figure 29: Asia Pacific Aerospace Digital Simulation Revenue Share (%), by Types 2024 & 2032
- Figure 30: Asia Pacific Aerospace Digital Simulation Revenue (million), by Country 2024 & 2032
- Figure 31: Asia Pacific Aerospace Digital Simulation Revenue Share (%), by Country 2024 & 2032
List of Tables
- Table 1: Global Aerospace Digital Simulation Revenue million Forecast, by Region 2019 & 2032
- Table 2: Global Aerospace Digital Simulation Revenue million Forecast, by Application 2019 & 2032
- Table 3: Global Aerospace Digital Simulation Revenue million Forecast, by Types 2019 & 2032
- Table 4: Global Aerospace Digital Simulation Revenue million Forecast, by Region 2019 & 2032
- Table 5: Global Aerospace Digital Simulation Revenue million Forecast, by Application 2019 & 2032
- Table 6: Global Aerospace Digital Simulation Revenue million Forecast, by Types 2019 & 2032
- Table 7: Global Aerospace Digital Simulation Revenue million Forecast, by Country 2019 & 2032
- Table 8: United States Aerospace Digital Simulation Revenue (million) Forecast, by Application 2019 & 2032
- Table 9: Canada Aerospace Digital Simulation Revenue (million) Forecast, by Application 2019 & 2032
- Table 10: Mexico Aerospace Digital Simulation Revenue (million) Forecast, by Application 2019 & 2032
- Table 11: Global Aerospace Digital Simulation Revenue million Forecast, by Application 2019 & 2032
- Table 12: Global Aerospace Digital Simulation Revenue million Forecast, by Types 2019 & 2032
- Table 13: Global Aerospace Digital Simulation Revenue million Forecast, by Country 2019 & 2032
- Table 14: Brazil Aerospace Digital Simulation Revenue (million) Forecast, by Application 2019 & 2032
- Table 15: Argentina Aerospace Digital Simulation Revenue (million) Forecast, by Application 2019 & 2032
- Table 16: Rest of South America Aerospace Digital Simulation Revenue (million) Forecast, by Application 2019 & 2032
- Table 17: Global Aerospace Digital Simulation Revenue million Forecast, by Application 2019 & 2032
- Table 18: Global Aerospace Digital Simulation Revenue million Forecast, by Types 2019 & 2032
- Table 19: Global Aerospace Digital Simulation Revenue million Forecast, by Country 2019 & 2032
- Table 20: United Kingdom Aerospace Digital Simulation Revenue (million) Forecast, by Application 2019 & 2032
- Table 21: Germany Aerospace Digital Simulation Revenue (million) Forecast, by Application 2019 & 2032
- Table 22: France Aerospace Digital Simulation Revenue (million) Forecast, by Application 2019 & 2032
- Table 23: Italy Aerospace Digital Simulation Revenue (million) Forecast, by Application 2019 & 2032
- Table 24: Spain Aerospace Digital Simulation Revenue (million) Forecast, by Application 2019 & 2032
- Table 25: Russia Aerospace Digital Simulation Revenue (million) Forecast, by Application 2019 & 2032
- Table 26: Benelux Aerospace Digital Simulation Revenue (million) Forecast, by Application 2019 & 2032
- Table 27: Nordics Aerospace Digital Simulation Revenue (million) Forecast, by Application 2019 & 2032
- Table 28: Rest of Europe Aerospace Digital Simulation Revenue (million) Forecast, by Application 2019 & 2032
- Table 29: Global Aerospace Digital Simulation Revenue million Forecast, by Application 2019 & 2032
- Table 30: Global Aerospace Digital Simulation Revenue million Forecast, by Types 2019 & 2032
- Table 31: Global Aerospace Digital Simulation Revenue million Forecast, by Country 2019 & 2032
- Table 32: Turkey Aerospace Digital Simulation Revenue (million) Forecast, by Application 2019 & 2032
- Table 33: Israel Aerospace Digital Simulation Revenue (million) Forecast, by Application 2019 & 2032
- Table 34: GCC Aerospace Digital Simulation Revenue (million) Forecast, by Application 2019 & 2032
- Table 35: North Africa Aerospace Digital Simulation Revenue (million) Forecast, by Application 2019 & 2032
- Table 36: South Africa Aerospace Digital Simulation Revenue (million) Forecast, by Application 2019 & 2032
- Table 37: Rest of Middle East & Africa Aerospace Digital Simulation Revenue (million) Forecast, by Application 2019 & 2032
- Table 38: Global Aerospace Digital Simulation Revenue million Forecast, by Application 2019 & 2032
- Table 39: Global Aerospace Digital Simulation Revenue million Forecast, by Types 2019 & 2032
- Table 40: Global Aerospace Digital Simulation Revenue million Forecast, by Country 2019 & 2032
- Table 41: China Aerospace Digital Simulation Revenue (million) Forecast, by Application 2019 & 2032
- Table 42: India Aerospace Digital Simulation Revenue (million) Forecast, by Application 2019 & 2032
- Table 43: Japan Aerospace Digital Simulation Revenue (million) Forecast, by Application 2019 & 2032
- Table 44: South Korea Aerospace Digital Simulation Revenue (million) Forecast, by Application 2019 & 2032
- Table 45: ASEAN Aerospace Digital Simulation Revenue (million) Forecast, by Application 2019 & 2032
- Table 46: Oceania Aerospace Digital Simulation Revenue (million) Forecast, by Application 2019 & 2032
- Table 47: Rest of Asia Pacific Aerospace Digital Simulation Revenue (million) Forecast, by Application 2019 & 2032
Frequently Asked Questions
1. What is the projected Compound Annual Growth Rate (CAGR) of the Aerospace Digital Simulation?
The projected CAGR is approximately 11.5%.
2. Which companies are prominent players in the Aerospace Digital Simulation?
Key companies in the market include Systems Tool Kit (AGI), Ansys, Simcenter (Siemens), CASIC Simulation Technology, Geovis Technology, Shanghai Paisatellite Information Technology.
3. What are the main segments of the Aerospace Digital Simulation?
The market segments include Application, Types.
4. Can you provide details about the market size?
The market size is estimated to be USD 324 million as of 2022.
5. What are some drivers contributing to market growth?
N/A
6. What are the notable trends driving market growth?
N/A
7. Are there any restraints impacting market growth?
N/A
8. Can you provide examples of recent developments in the market?
N/A
9. What pricing options are available for accessing the report?
Pricing options include single-user, multi-user, and enterprise licenses priced at USD 4900.00, USD 7350.00, and USD 9800.00 respectively.
10. Is the market size provided in terms of value or volume?
The market size is provided in terms of value, measured in million.
11. Are there any specific market keywords associated with the report?
Yes, the market keyword associated with the report is "Aerospace Digital Simulation," which aids in identifying and referencing the specific market segment covered.
12. How do I determine which pricing option suits my needs best?
The pricing options vary based on user requirements and access needs. Individual users may opt for single-user licenses, while businesses requiring broader access may choose multi-user or enterprise licenses for cost-effective access to the report.
13. Are there any additional resources or data provided in the Aerospace Digital Simulation report?
While the report offers comprehensive insights, it's advisable to review the specific contents or supplementary materials provided to ascertain if additional resources or data are available.
14. How can I stay updated on further developments or reports in the Aerospace Digital Simulation?
To stay informed about further developments, trends, and reports in the Aerospace Digital Simulation, consider subscribing to industry newsletters, following relevant companies and organizations, or regularly checking reputable industry news sources and publications.
Methodology
Step 1 - Identification of Relevant Samples Size from Population Database


Step 2 - Approaches for Defining Global Market Size (Value, Volume* & Price*)

Note*: In applicable scenarios
Step 3 - Data Sources
Primary Research
- Web Analytics
- Survey Reports
- Research Institute
- Latest Research Reports
- Opinion Leaders
Secondary Research
- Annual Reports
- White Paper
- Latest Press Release
- Industry Association
- Paid Database
- Investor Presentations

Step 4 - Data Triangulation
Involves using different sources of information in order to increase the validity of a study
These sources are likely to be stakeholders in a program - participants, other researchers, program staff, other community members, and so on.
Then we put all data in single framework & apply various statistical tools to find out the dynamic on the market.
During the analysis stage, feedback from the stakeholder groups would be compared to determine areas of agreement as well as areas of divergence
