

Key Insights
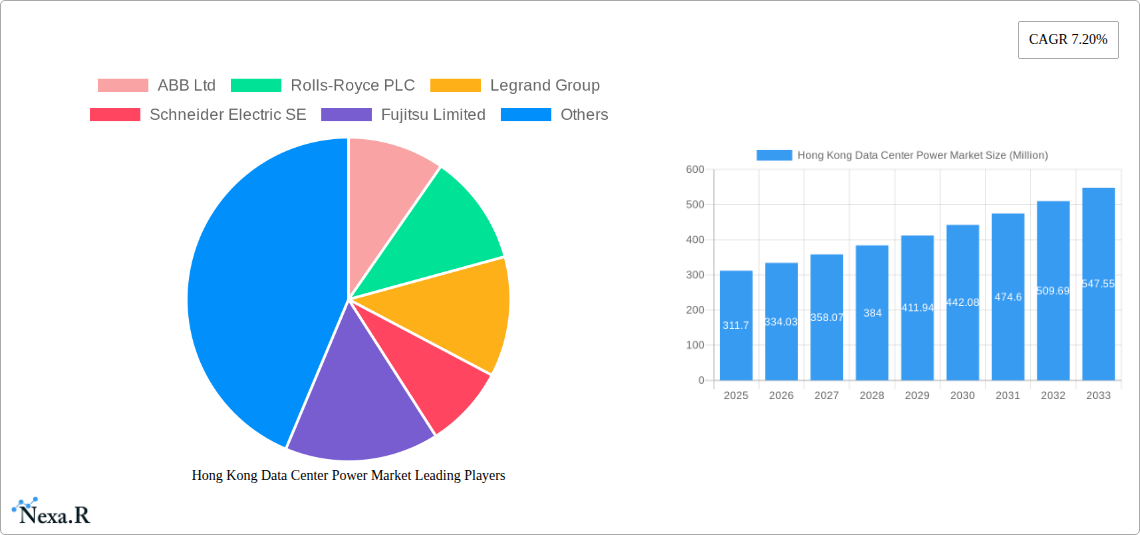
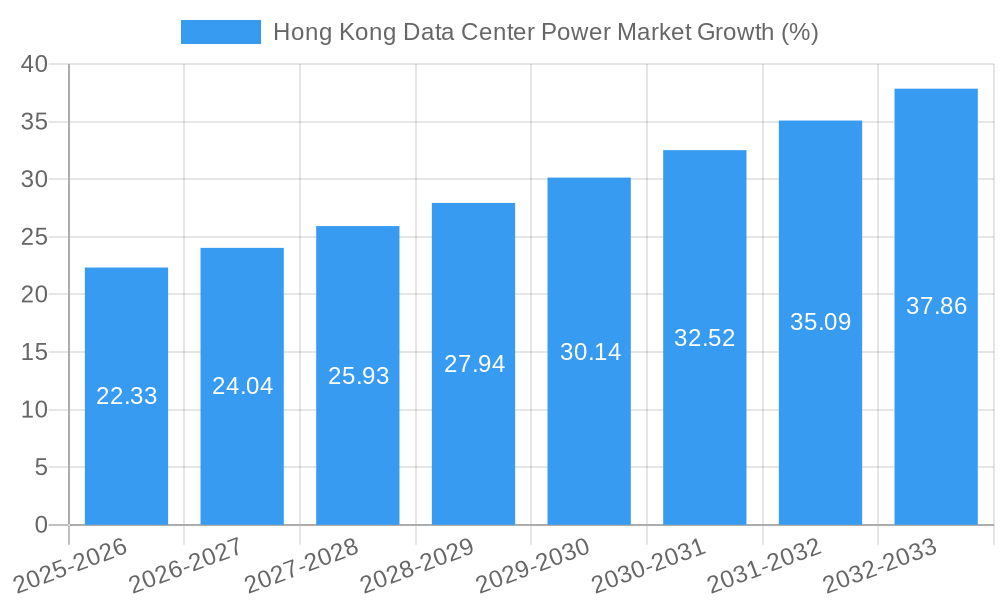
The Hong Kong data center power market, valued at $311.70 million in 2025, is experiencing robust growth, projected to expand at a compound annual growth rate (CAGR) of 7.20% from 2025 to 2033. This expansion is driven by several key factors. The burgeoning IT and telecommunication sector in Hong Kong, coupled with increasing cloud adoption and the growth of big data analytics, fuels a significant demand for reliable and efficient power solutions within data centers. Furthermore, the financial services (BFSI) and government sectors are also contributing to market growth through substantial investments in their respective IT infrastructure. Increased focus on energy efficiency and sustainability within data centers, alongside the adoption of advanced power distribution solutions like PDUs, switchgear, and critical power distribution systems, are further bolstering market expansion. However, the market faces challenges such as high initial investment costs for advanced power infrastructure and potential disruptions from geopolitical uncertainties. The competitive landscape is dominated by established players like ABB, Schneider Electric, and Vertiv, along with other significant technology providers, vying for market share through innovative product offerings and strategic partnerships. The market segmentation across power distribution solutions, end-users, and power infrastructure provides further opportunities for specialized vendors to capture specific niche markets.
The forecast period of 2025-2033 presents significant opportunities for market players. The continuous growth of data consumption and the government's initiatives to support technological advancements are expected to create an expanding market. Competitive strategies will likely center on technological innovation, particularly in areas such as renewable energy integration and smart power management systems. Companies will need to demonstrate expertise in offering comprehensive solutions that encompass not only hardware but also services like installation, maintenance, and ongoing support. Furthermore, a focus on sustainability and adhering to evolving environmental regulations will be crucial for sustained success in this growing market.
Hong Kong Data Center Power Market: A Comprehensive Report (2019-2033)
This in-depth report provides a comprehensive analysis of the Hong Kong data center power market, encompassing market dynamics, growth trends, key players, and future outlook. The report covers the historical period (2019-2024), base year (2025), and forecast period (2025-2033), offering invaluable insights for industry professionals, investors, and strategic decision-makers. The study segments the market by Power Distribution Solutions (PDU, Switchgear, Critical Power Distribution, Transfer Switches, Remote Power Panels, Other Power Distribution Solutions, Service), End-User (IT & Telecommunication, BFSI, Government, Media & Entertainment, Other End Users), and Power Infrastructure (Electrical Solution). The total market size is valued at xx Million in 2025 and is projected to reach xx Million by 2033.
Hong Kong Data Center Power Market Dynamics & Structure
This section analyzes the Hong Kong data center power market's competitive landscape, technological advancements, regulatory environment, and market trends. The market is characterized by a moderate level of concentration, with key players holding significant market share. Technological innovation, driven by the increasing demand for energy efficiency and reliability, is a major growth driver. Stringent regulatory frameworks concerning energy consumption and environmental sustainability influence market dynamics. The growing adoption of renewable energy sources and the development of advanced power distribution solutions are creating new opportunities for market participants.
- Market Concentration: The top five players hold approximately xx% of the market share in 2025.
- Technological Innovation: Focus on improving energy efficiency, reducing carbon footprint, and enhancing system reliability is driving innovation.
- Regulatory Framework: Government initiatives promoting sustainable energy practices are influencing technology adoption and investment decisions.
- Competitive Substitutes: Alternative power sources like hydrogen fuel cells are emerging as competitive substitutes for traditional backup generators.
- M&A Activity: The number of M&A deals in the sector averaged xx per year during the period 2019-2024.
Hong Kong Data Center Power Market Growth Trends & Insights
The Hong Kong data center power market has experienced significant growth over the past five years, driven by the rapid expansion of the data center industry. The market size expanded from xx Million in 2019 to xx Million in 2024, registering a CAGR of xx%. This growth is primarily attributed to increased investment in data center infrastructure, rising demand for cloud services, and the growing adoption of advanced technologies such as AI and IoT. Technological disruptions like the introduction of hydrogen fuel cells as backup power are expected to further accelerate market growth. Shifts in consumer behavior toward digitalization are also underpinning demand.
- Market Size Evolution: From xx Million in 2019 to xx Million in 2024, a CAGR of xx%.
- Adoption Rates: High adoption of cloud computing and increasing demand for high-speed internet connectivity fuels growth.
- Technological Disruptions: Hydrogen fuel cells and other innovative power solutions are reshaping the market.
- Consumer Behavior: Increased reliance on digital services and data-driven applications fuels demand for robust power infrastructure.
Dominant Regions, Countries, or Segments in Hong Kong Data Center Power Market
The IT & Telecommunication sector dominates the Hong Kong data center power market, accounting for approximately xx% of the total market value in 2025, followed by BFSI at xx%. Within Power Distribution Solutions, Critical Power Distribution and Switchgear are the leading segments, driven by the stringent power reliability requirements of data centers. The dominance of these segments is attributed to the growing demand for resilient power solutions, robust infrastructure, and supportive government policies that promote data center development.
- Leading Segment: IT & Telecommunication, holding xx% market share in 2025.
- Key Drivers: Stringent power reliability requirements, increasing data center density, and government support for infrastructure development.
- Growth Potential: Significant potential for expansion exists in the BFSI and Government sectors.
Hong Kong Data Center Power Market Product Landscape
The Hong Kong data center power market features a diverse range of products, including advanced power distribution units (PDUs), intelligent switchgear, and robust uninterruptible power supplies (UPS). These products are designed to ensure high availability, efficiency, and reliability. Recent innovations focus on enhanced monitoring capabilities, predictive maintenance features, and integration with smart building management systems. Unique selling propositions include increased energy efficiency, reduced downtime, and improved environmental performance.
Key Drivers, Barriers & Challenges in Hong Kong Data Center Power Market
Key Drivers: The rapid expansion of data centers, growing demand for cloud services, and the increasing adoption of energy-efficient technologies drive market growth. Government support through favorable policies and infrastructure development further boosts the market.
Key Challenges: High upfront investment costs for advanced power solutions, potential supply chain disruptions, and the need for skilled workforce pose challenges. Regulatory compliance and ensuring data security also present hurdles. The impact of these challenges is estimated to reduce the overall market growth by approximately xx% during the forecast period.
Emerging Opportunities in Hong Kong Data Center Power Market
Emerging opportunities lie in the increasing adoption of renewable energy sources for powering data centers, the rise of edge computing, and the demand for modular and scalable power solutions. The development of innovative backup power systems, such as hydrogen fuel cells, presents significant growth potential. Untapped markets in smaller data centers and the expansion into new sectors like healthcare offer further opportunities.
Growth Accelerators in the Hong Kong Data Center Power Market Industry
Technological breakthroughs in energy storage and power management are key growth accelerators. Strategic partnerships between data center operators and power solution providers are fostering innovation and driving market expansion. Government initiatives promoting sustainable energy and data center development are creating a favorable environment for long-term growth. Market expansion into new geographical locations and the development of new applications further contribute to growth.
Key Players Shaping the Hong Kong Data Center Power Market Market
- ABB Ltd
- Rolls-Royce PLC
- Legrand Group
- Schneider Electric SE
- Fujitsu Limited
- Caterpillar Inc
- Rittal GmbH & Co KG
- Cisco Systems Inc
- Cummins Inc
- Vertiv Group Corp
- Eaton Corporation
Notable Milestones in Hong Kong Data Center Power Market Sector
- January 2024: Caterpillar Inc. partnered with Microsoft and Ballard Power Systems to test hydrogen fuel cells for data center backup power, signaling a shift toward eco-friendly solutions.
- March 2024: Schneider Electric expanded its US manufacturing facilities for electrical switchgear and medium-voltage power distribution products, indicating increased investment in critical infrastructure support.
In-Depth Hong Kong Data Center Power Market Market Outlook
The Hong Kong data center power market is poised for continued growth over the next decade, driven by technological advancements, increasing data center deployments, and supportive government policies. The adoption of sustainable power solutions and the development of innovative technologies will create significant opportunities for market participants. Strategic partnerships and expansion into new market segments will be crucial for achieving long-term success. The market is expected to witness a healthy CAGR of xx% during the forecast period (2025-2033).
Hong Kong Data Center Power Market Segmentation
-
1. Power Infrastructure
-
1.1. Electrical Solution
- 1.1.1. UPS Systems
- 1.1.2. Generators
-
1.1.3. Power Distribution Solutions
- 1.1.3.1. PDU
- 1.1.3.2. Switchgear
- 1.1.3.3. Critical Power Distribution
- 1.1.3.4. Transfer Switches
- 1.1.3.5. Remote Power Panels
- 1.1.3.6. Other Power Distribution Solutions
- 1.2. Service
-
1.1. Electrical Solution
-
2. End User
- 2.1. IT & Telecommunication
- 2.2. BFSI
- 2.3. Government
- 2.4. Media & Entertainment
- 2.5. Other End Users
Hong Kong Data Center Power Market Segmentation By Geography
-
1. North America
- 1.1. United States
- 1.2. Canada
- 1.3. Mexico
-
2. South America
- 2.1. Brazil
- 2.2. Argentina
- 2.3. Rest of South America
-
3. Europe
- 3.1. United Kingdom
- 3.2. Germany
- 3.3. France
- 3.4. Italy
- 3.5. Spain
- 3.6. Russia
- 3.7. Benelux
- 3.8. Nordics
- 3.9. Rest of Europe
-
4. Middle East & Africa
- 4.1. Turkey
- 4.2. Israel
- 4.3. GCC
- 4.4. North Africa
- 4.5. South Africa
- 4.6. Rest of Middle East & Africa
-
5. Asia Pacific
- 5.1. China
- 5.2. India
- 5.3. Japan
- 5.4. South Korea
- 5.5. ASEAN
- 5.6. Oceania
- 5.7. Rest of Asia Pacific
Hong Kong Data Center Power Market REPORT HIGHLIGHTS
| Aspects | Details |
|---|---|
| Study Period | 2019-2033 |
| Base Year | 2024 |
| Estimated Year | 2025 |
| Forecast Period | 2025-2033 |
| Historical Period | 2019-2024 |
| Growth Rate | CAGR of 7.20% from 2019-2033 |
| Segmentation |
|
Table of Contents
- 1. Introduction
- 1.1. Research Scope
- 1.2. Market Segmentation
- 1.3. Research Methodology
- 1.4. Definitions and Assumptions
- 2. Executive Summary
- 2.1. Introduction
- 3. Market Dynamics
- 3.1. Introduction
- 3.2. Market Drivers
- 3.2.1. Rising Adoption of Mega Data Centers and Cloud Computing; Increasing Demand to Reduce Operational Costs
- 3.3. Market Restrains
- 3.3.1. High Cost of Installation and Maintenance
- 3.4. Market Trends
- 3.4.1. IT & Telecommunication Segment to Hold Major Share in the Market
- 4. Market Factor Analysis
- 4.1. Porters Five Forces
- 4.2. Supply/Value Chain
- 4.3. PESTEL analysis
- 4.4. Market Entropy
- 4.5. Patent/Trademark Analysis
- 5. Global Hong Kong Data Center Power Market Analysis, Insights and Forecast, 2019-2031
- 5.1. Market Analysis, Insights and Forecast - by Power Infrastructure
- 5.1.1. Electrical Solution
- 5.1.1.1. UPS Systems
- 5.1.1.2. Generators
- 5.1.1.3. Power Distribution Solutions
- 5.1.1.3.1. PDU
- 5.1.1.3.2. Switchgear
- 5.1.1.3.3. Critical Power Distribution
- 5.1.1.3.4. Transfer Switches
- 5.1.1.3.5. Remote Power Panels
- 5.1.1.3.6. Other Power Distribution Solutions
- 5.1.2. Service
- 5.1.1. Electrical Solution
- 5.2. Market Analysis, Insights and Forecast - by End User
- 5.2.1. IT & Telecommunication
- 5.2.2. BFSI
- 5.2.3. Government
- 5.2.4. Media & Entertainment
- 5.2.5. Other End Users
- 5.3. Market Analysis, Insights and Forecast - by Region
- 5.3.1. North America
- 5.3.2. South America
- 5.3.3. Europe
- 5.3.4. Middle East & Africa
- 5.3.5. Asia Pacific
- 5.1. Market Analysis, Insights and Forecast - by Power Infrastructure
- 6. North America Hong Kong Data Center Power Market Analysis, Insights and Forecast, 2019-2031
- 6.1. Market Analysis, Insights and Forecast - by Power Infrastructure
- 6.1.1. Electrical Solution
- 6.1.1.1. UPS Systems
- 6.1.1.2. Generators
- 6.1.1.3. Power Distribution Solutions
- 6.1.1.3.1. PDU
- 6.1.1.3.2. Switchgear
- 6.1.1.3.3. Critical Power Distribution
- 6.1.1.3.4. Transfer Switches
- 6.1.1.3.5. Remote Power Panels
- 6.1.1.3.6. Other Power Distribution Solutions
- 6.1.2. Service
- 6.1.1. Electrical Solution
- 6.2. Market Analysis, Insights and Forecast - by End User
- 6.2.1. IT & Telecommunication
- 6.2.2. BFSI
- 6.2.3. Government
- 6.2.4. Media & Entertainment
- 6.2.5. Other End Users
- 6.1. Market Analysis, Insights and Forecast - by Power Infrastructure
- 7. South America Hong Kong Data Center Power Market Analysis, Insights and Forecast, 2019-2031
- 7.1. Market Analysis, Insights and Forecast - by Power Infrastructure
- 7.1.1. Electrical Solution
- 7.1.1.1. UPS Systems
- 7.1.1.2. Generators
- 7.1.1.3. Power Distribution Solutions
- 7.1.1.3.1. PDU
- 7.1.1.3.2. Switchgear
- 7.1.1.3.3. Critical Power Distribution
- 7.1.1.3.4. Transfer Switches
- 7.1.1.3.5. Remote Power Panels
- 7.1.1.3.6. Other Power Distribution Solutions
- 7.1.2. Service
- 7.1.1. Electrical Solution
- 7.2. Market Analysis, Insights and Forecast - by End User
- 7.2.1. IT & Telecommunication
- 7.2.2. BFSI
- 7.2.3. Government
- 7.2.4. Media & Entertainment
- 7.2.5. Other End Users
- 7.1. Market Analysis, Insights and Forecast - by Power Infrastructure
- 8. Europe Hong Kong Data Center Power Market Analysis, Insights and Forecast, 2019-2031
- 8.1. Market Analysis, Insights and Forecast - by Power Infrastructure
- 8.1.1. Electrical Solution
- 8.1.1.1. UPS Systems
- 8.1.1.2. Generators
- 8.1.1.3. Power Distribution Solutions
- 8.1.1.3.1. PDU
- 8.1.1.3.2. Switchgear
- 8.1.1.3.3. Critical Power Distribution
- 8.1.1.3.4. Transfer Switches
- 8.1.1.3.5. Remote Power Panels
- 8.1.1.3.6. Other Power Distribution Solutions
- 8.1.2. Service
- 8.1.1. Electrical Solution
- 8.2. Market Analysis, Insights and Forecast - by End User
- 8.2.1. IT & Telecommunication
- 8.2.2. BFSI
- 8.2.3. Government
- 8.2.4. Media & Entertainment
- 8.2.5. Other End Users
- 8.1. Market Analysis, Insights and Forecast - by Power Infrastructure
- 9. Middle East & Africa Hong Kong Data Center Power Market Analysis, Insights and Forecast, 2019-2031
- 9.1. Market Analysis, Insights and Forecast - by Power Infrastructure
- 9.1.1. Electrical Solution
- 9.1.1.1. UPS Systems
- 9.1.1.2. Generators
- 9.1.1.3. Power Distribution Solutions
- 9.1.1.3.1. PDU
- 9.1.1.3.2. Switchgear
- 9.1.1.3.3. Critical Power Distribution
- 9.1.1.3.4. Transfer Switches
- 9.1.1.3.5. Remote Power Panels
- 9.1.1.3.6. Other Power Distribution Solutions
- 9.1.2. Service
- 9.1.1. Electrical Solution
- 9.2. Market Analysis, Insights and Forecast - by End User
- 9.2.1. IT & Telecommunication
- 9.2.2. BFSI
- 9.2.3. Government
- 9.2.4. Media & Entertainment
- 9.2.5. Other End Users
- 9.1. Market Analysis, Insights and Forecast - by Power Infrastructure
- 10. Asia Pacific Hong Kong Data Center Power Market Analysis, Insights and Forecast, 2019-2031
- 10.1. Market Analysis, Insights and Forecast - by Power Infrastructure
- 10.1.1. Electrical Solution
- 10.1.1.1. UPS Systems
- 10.1.1.2. Generators
- 10.1.1.3. Power Distribution Solutions
- 10.1.1.3.1. PDU
- 10.1.1.3.2. Switchgear
- 10.1.1.3.3. Critical Power Distribution
- 10.1.1.3.4. Transfer Switches
- 10.1.1.3.5. Remote Power Panels
- 10.1.1.3.6. Other Power Distribution Solutions
- 10.1.2. Service
- 10.1.1. Electrical Solution
- 10.2. Market Analysis, Insights and Forecast - by End User
- 10.2.1. IT & Telecommunication
- 10.2.2. BFSI
- 10.2.3. Government
- 10.2.4. Media & Entertainment
- 10.2.5. Other End Users
- 10.1. Market Analysis, Insights and Forecast - by Power Infrastructure
- 11. Competitive Analysis
- 11.1. Global Market Share Analysis 2024
- 11.2. Company Profiles
- 11.2.1 ABB Ltd
- 11.2.1.1. Overview
- 11.2.1.2. Products
- 11.2.1.3. SWOT Analysis
- 11.2.1.4. Recent Developments
- 11.2.1.5. Financials (Based on Availability)
- 11.2.2 Rolls-Royce PLC
- 11.2.2.1. Overview
- 11.2.2.2. Products
- 11.2.2.3. SWOT Analysis
- 11.2.2.4. Recent Developments
- 11.2.2.5. Financials (Based on Availability)
- 11.2.3 Legrand Group
- 11.2.3.1. Overview
- 11.2.3.2. Products
- 11.2.3.3. SWOT Analysis
- 11.2.3.4. Recent Developments
- 11.2.3.5. Financials (Based on Availability)
- 11.2.4 Schneider Electric SE
- 11.2.4.1. Overview
- 11.2.4.2. Products
- 11.2.4.3. SWOT Analysis
- 11.2.4.4. Recent Developments
- 11.2.4.5. Financials (Based on Availability)
- 11.2.5 Fujitsu Limited
- 11.2.5.1. Overview
- 11.2.5.2. Products
- 11.2.5.3. SWOT Analysis
- 11.2.5.4. Recent Developments
- 11.2.5.5. Financials (Based on Availability)
- 11.2.6 Caterpillar Inc
- 11.2.6.1. Overview
- 11.2.6.2. Products
- 11.2.6.3. SWOT Analysis
- 11.2.6.4. Recent Developments
- 11.2.6.5. Financials (Based on Availability)
- 11.2.7 Rittal GmbH & Co KG
- 11.2.7.1. Overview
- 11.2.7.2. Products
- 11.2.7.3. SWOT Analysis
- 11.2.7.4. Recent Developments
- 11.2.7.5. Financials (Based on Availability)
- 11.2.8 Cisco Systems Inc *List Not Exhaustive
- 11.2.8.1. Overview
- 11.2.8.2. Products
- 11.2.8.3. SWOT Analysis
- 11.2.8.4. Recent Developments
- 11.2.8.5. Financials (Based on Availability)
- 11.2.9 Cummins Inc
- 11.2.9.1. Overview
- 11.2.9.2. Products
- 11.2.9.3. SWOT Analysis
- 11.2.9.4. Recent Developments
- 11.2.9.5. Financials (Based on Availability)
- 11.2.10 Vertiv Group Corp
- 11.2.10.1. Overview
- 11.2.10.2. Products
- 11.2.10.3. SWOT Analysis
- 11.2.10.4. Recent Developments
- 11.2.10.5. Financials (Based on Availability)
- 11.2.11 Eaton Corporation
- 11.2.11.1. Overview
- 11.2.11.2. Products
- 11.2.11.3. SWOT Analysis
- 11.2.11.4. Recent Developments
- 11.2.11.5. Financials (Based on Availability)
- 11.2.1 ABB Ltd
List of Figures
- Figure 1: Global Hong Kong Data Center Power Market Revenue Breakdown (Million, %) by Region 2024 & 2032
- Figure 2: Hong Kong Hong Kong Data Center Power Market Revenue (Million), by Country 2024 & 2032
- Figure 3: Hong Kong Hong Kong Data Center Power Market Revenue Share (%), by Country 2024 & 2032
- Figure 4: North America Hong Kong Data Center Power Market Revenue (Million), by Power Infrastructure 2024 & 2032
- Figure 5: North America Hong Kong Data Center Power Market Revenue Share (%), by Power Infrastructure 2024 & 2032
- Figure 6: North America Hong Kong Data Center Power Market Revenue (Million), by End User 2024 & 2032
- Figure 7: North America Hong Kong Data Center Power Market Revenue Share (%), by End User 2024 & 2032
- Figure 8: North America Hong Kong Data Center Power Market Revenue (Million), by Country 2024 & 2032
- Figure 9: North America Hong Kong Data Center Power Market Revenue Share (%), by Country 2024 & 2032
- Figure 10: South America Hong Kong Data Center Power Market Revenue (Million), by Power Infrastructure 2024 & 2032
- Figure 11: South America Hong Kong Data Center Power Market Revenue Share (%), by Power Infrastructure 2024 & 2032
- Figure 12: South America Hong Kong Data Center Power Market Revenue (Million), by End User 2024 & 2032
- Figure 13: South America Hong Kong Data Center Power Market Revenue Share (%), by End User 2024 & 2032
- Figure 14: South America Hong Kong Data Center Power Market Revenue (Million), by Country 2024 & 2032
- Figure 15: South America Hong Kong Data Center Power Market Revenue Share (%), by Country 2024 & 2032
- Figure 16: Europe Hong Kong Data Center Power Market Revenue (Million), by Power Infrastructure 2024 & 2032
- Figure 17: Europe Hong Kong Data Center Power Market Revenue Share (%), by Power Infrastructure 2024 & 2032
- Figure 18: Europe Hong Kong Data Center Power Market Revenue (Million), by End User 2024 & 2032
- Figure 19: Europe Hong Kong Data Center Power Market Revenue Share (%), by End User 2024 & 2032
- Figure 20: Europe Hong Kong Data Center Power Market Revenue (Million), by Country 2024 & 2032
- Figure 21: Europe Hong Kong Data Center Power Market Revenue Share (%), by Country 2024 & 2032
- Figure 22: Middle East & Africa Hong Kong Data Center Power Market Revenue (Million), by Power Infrastructure 2024 & 2032
- Figure 23: Middle East & Africa Hong Kong Data Center Power Market Revenue Share (%), by Power Infrastructure 2024 & 2032
- Figure 24: Middle East & Africa Hong Kong Data Center Power Market Revenue (Million), by End User 2024 & 2032
- Figure 25: Middle East & Africa Hong Kong Data Center Power Market Revenue Share (%), by End User 2024 & 2032
- Figure 26: Middle East & Africa Hong Kong Data Center Power Market Revenue (Million), by Country 2024 & 2032
- Figure 27: Middle East & Africa Hong Kong Data Center Power Market Revenue Share (%), by Country 2024 & 2032
- Figure 28: Asia Pacific Hong Kong Data Center Power Market Revenue (Million), by Power Infrastructure 2024 & 2032
- Figure 29: Asia Pacific Hong Kong Data Center Power Market Revenue Share (%), by Power Infrastructure 2024 & 2032
- Figure 30: Asia Pacific Hong Kong Data Center Power Market Revenue (Million), by End User 2024 & 2032
- Figure 31: Asia Pacific Hong Kong Data Center Power Market Revenue Share (%), by End User 2024 & 2032
- Figure 32: Asia Pacific Hong Kong Data Center Power Market Revenue (Million), by Country 2024 & 2032
- Figure 33: Asia Pacific Hong Kong Data Center Power Market Revenue Share (%), by Country 2024 & 2032
List of Tables
- Table 1: Global Hong Kong Data Center Power Market Revenue Million Forecast, by Region 2019 & 2032
- Table 2: Global Hong Kong Data Center Power Market Revenue Million Forecast, by Power Infrastructure 2019 & 2032
- Table 3: Global Hong Kong Data Center Power Market Revenue Million Forecast, by End User 2019 & 2032
- Table 4: Global Hong Kong Data Center Power Market Revenue Million Forecast, by Region 2019 & 2032
- Table 5: Global Hong Kong Data Center Power Market Revenue Million Forecast, by Country 2019 & 2032
- Table 6: Global Hong Kong Data Center Power Market Revenue Million Forecast, by Power Infrastructure 2019 & 2032
- Table 7: Global Hong Kong Data Center Power Market Revenue Million Forecast, by End User 2019 & 2032
- Table 8: Global Hong Kong Data Center Power Market Revenue Million Forecast, by Country 2019 & 2032
- Table 9: United States Hong Kong Data Center Power Market Revenue (Million) Forecast, by Application 2019 & 2032
- Table 10: Canada Hong Kong Data Center Power Market Revenue (Million) Forecast, by Application 2019 & 2032
- Table 11: Mexico Hong Kong Data Center Power Market Revenue (Million) Forecast, by Application 2019 & 2032
- Table 12: Global Hong Kong Data Center Power Market Revenue Million Forecast, by Power Infrastructure 2019 & 2032
- Table 13: Global Hong Kong Data Center Power Market Revenue Million Forecast, by End User 2019 & 2032
- Table 14: Global Hong Kong Data Center Power Market Revenue Million Forecast, by Country 2019 & 2032
- Table 15: Brazil Hong Kong Data Center Power Market Revenue (Million) Forecast, by Application 2019 & 2032
- Table 16: Argentina Hong Kong Data Center Power Market Revenue (Million) Forecast, by Application 2019 & 2032
- Table 17: Rest of South America Hong Kong Data Center Power Market Revenue (Million) Forecast, by Application 2019 & 2032
- Table 18: Global Hong Kong Data Center Power Market Revenue Million Forecast, by Power Infrastructure 2019 & 2032
- Table 19: Global Hong Kong Data Center Power Market Revenue Million Forecast, by End User 2019 & 2032
- Table 20: Global Hong Kong Data Center Power Market Revenue Million Forecast, by Country 2019 & 2032
- Table 21: United Kingdom Hong Kong Data Center Power Market Revenue (Million) Forecast, by Application 2019 & 2032
- Table 22: Germany Hong Kong Data Center Power Market Revenue (Million) Forecast, by Application 2019 & 2032
- Table 23: France Hong Kong Data Center Power Market Revenue (Million) Forecast, by Application 2019 & 2032
- Table 24: Italy Hong Kong Data Center Power Market Revenue (Million) Forecast, by Application 2019 & 2032
- Table 25: Spain Hong Kong Data Center Power Market Revenue (Million) Forecast, by Application 2019 & 2032
- Table 26: Russia Hong Kong Data Center Power Market Revenue (Million) Forecast, by Application 2019 & 2032
- Table 27: Benelux Hong Kong Data Center Power Market Revenue (Million) Forecast, by Application 2019 & 2032
- Table 28: Nordics Hong Kong Data Center Power Market Revenue (Million) Forecast, by Application 2019 & 2032
- Table 29: Rest of Europe Hong Kong Data Center Power Market Revenue (Million) Forecast, by Application 2019 & 2032
- Table 30: Global Hong Kong Data Center Power Market Revenue Million Forecast, by Power Infrastructure 2019 & 2032
- Table 31: Global Hong Kong Data Center Power Market Revenue Million Forecast, by End User 2019 & 2032
- Table 32: Global Hong Kong Data Center Power Market Revenue Million Forecast, by Country 2019 & 2032
- Table 33: Turkey Hong Kong Data Center Power Market Revenue (Million) Forecast, by Application 2019 & 2032
- Table 34: Israel Hong Kong Data Center Power Market Revenue (Million) Forecast, by Application 2019 & 2032
- Table 35: GCC Hong Kong Data Center Power Market Revenue (Million) Forecast, by Application 2019 & 2032
- Table 36: North Africa Hong Kong Data Center Power Market Revenue (Million) Forecast, by Application 2019 & 2032
- Table 37: South Africa Hong Kong Data Center Power Market Revenue (Million) Forecast, by Application 2019 & 2032
- Table 38: Rest of Middle East & Africa Hong Kong Data Center Power Market Revenue (Million) Forecast, by Application 2019 & 2032
- Table 39: Global Hong Kong Data Center Power Market Revenue Million Forecast, by Power Infrastructure 2019 & 2032
- Table 40: Global Hong Kong Data Center Power Market Revenue Million Forecast, by End User 2019 & 2032
- Table 41: Global Hong Kong Data Center Power Market Revenue Million Forecast, by Country 2019 & 2032
- Table 42: China Hong Kong Data Center Power Market Revenue (Million) Forecast, by Application 2019 & 2032
- Table 43: India Hong Kong Data Center Power Market Revenue (Million) Forecast, by Application 2019 & 2032
- Table 44: Japan Hong Kong Data Center Power Market Revenue (Million) Forecast, by Application 2019 & 2032
- Table 45: South Korea Hong Kong Data Center Power Market Revenue (Million) Forecast, by Application 2019 & 2032
- Table 46: ASEAN Hong Kong Data Center Power Market Revenue (Million) Forecast, by Application 2019 & 2032
- Table 47: Oceania Hong Kong Data Center Power Market Revenue (Million) Forecast, by Application 2019 & 2032
- Table 48: Rest of Asia Pacific Hong Kong Data Center Power Market Revenue (Million) Forecast, by Application 2019 & 2032
Frequently Asked Questions
1. What is the projected Compound Annual Growth Rate (CAGR) of the Hong Kong Data Center Power Market?
The projected CAGR is approximately 7.20%.
2. Which companies are prominent players in the Hong Kong Data Center Power Market?
Key companies in the market include ABB Ltd, Rolls-Royce PLC, Legrand Group, Schneider Electric SE, Fujitsu Limited, Caterpillar Inc, Rittal GmbH & Co KG, Cisco Systems Inc *List Not Exhaustive, Cummins Inc, Vertiv Group Corp, Eaton Corporation.
3. What are the main segments of the Hong Kong Data Center Power Market?
The market segments include Power Infrastructure, End User.
4. Can you provide details about the market size?
The market size is estimated to be USD 311.70 Million as of 2022.
5. What are some drivers contributing to market growth?
Rising Adoption of Mega Data Centers and Cloud Computing; Increasing Demand to Reduce Operational Costs.
6. What are the notable trends driving market growth?
IT & Telecommunication Segment to Hold Major Share in the Market.
7. Are there any restraints impacting market growth?
High Cost of Installation and Maintenance.
8. Can you provide examples of recent developments in the market?
January 2024: Caterpillar Inc. partnered with Microsoft and Ballard Power Systems to test the use of large-format hydrogen fuel cells as a reliable and eco-friendly backup power source for multi-megawatt data centers. Hydrogen fuel cells are seen as a possible low-carbon alternative to diesel backup generators, which is expected to drive the growth of DC generators.
9. What pricing options are available for accessing the report?
Pricing options include single-user, multi-user, and enterprise licenses priced at USD 3800, USD 4500, and USD 5800 respectively.
10. Is the market size provided in terms of value or volume?
The market size is provided in terms of value, measured in Million.
11. Are there any specific market keywords associated with the report?
Yes, the market keyword associated with the report is "Hong Kong Data Center Power Market," which aids in identifying and referencing the specific market segment covered.
12. How do I determine which pricing option suits my needs best?
The pricing options vary based on user requirements and access needs. Individual users may opt for single-user licenses, while businesses requiring broader access may choose multi-user or enterprise licenses for cost-effective access to the report.
13. Are there any additional resources or data provided in the Hong Kong Data Center Power Market report?
While the report offers comprehensive insights, it's advisable to review the specific contents or supplementary materials provided to ascertain if additional resources or data are available.
14. How can I stay updated on further developments or reports in the Hong Kong Data Center Power Market?
To stay informed about further developments, trends, and reports in the Hong Kong Data Center Power Market, consider subscribing to industry newsletters, following relevant companies and organizations, or regularly checking reputable industry news sources and publications.
Methodology
Step 1 - Identification of Relevant Samples Size from Population Database


Step 2 - Approaches for Defining Global Market Size (Value, Volume* & Price*)

Note*: In applicable scenarios
Step 3 - Data Sources
Primary Research
- Web Analytics
- Survey Reports
- Research Institute
- Latest Research Reports
- Opinion Leaders
Secondary Research
- Annual Reports
- White Paper
- Latest Press Release
- Industry Association
- Paid Database
- Investor Presentations

Step 4 - Data Triangulation
Involves using different sources of information in order to increase the validity of a study
These sources are likely to be stakeholders in a program - participants, other researchers, program staff, other community members, and so on.
Then we put all data in single framework & apply various statistical tools to find out the dynamic on the market.
During the analysis stage, feedback from the stakeholder groups would be compared to determine areas of agreement as well as areas of divergence
