

Key Insights
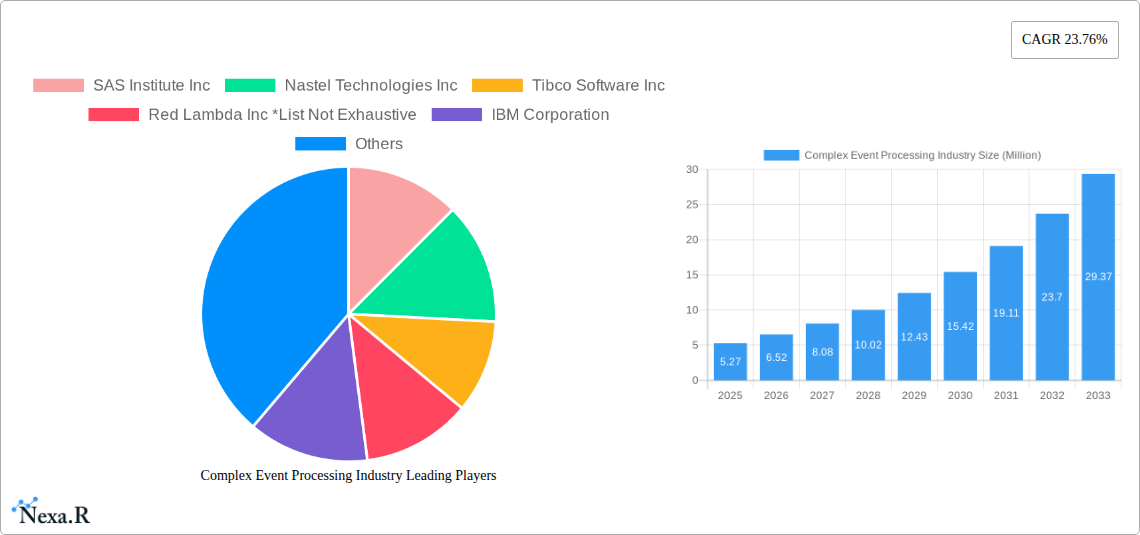
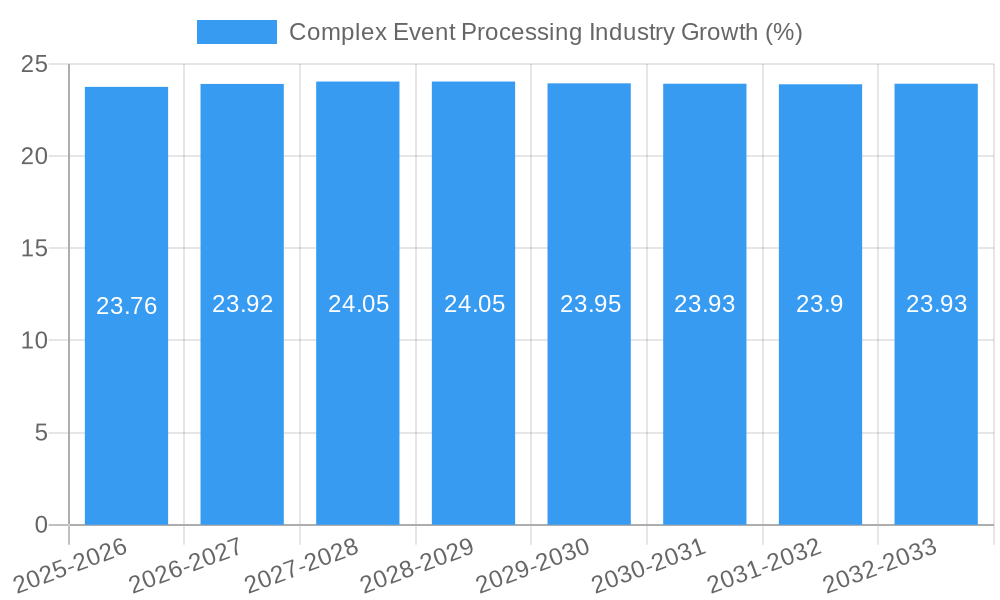
The Complex Event Processing (CEP) industry is poised for remarkable expansion, projected to reach an estimated USD 5.27 billion in 2025 with an impressive Compound Annual Growth Rate (CAGR) of 23.76%. This robust growth is primarily fueled by the increasing demand for real-time data analysis across various sectors to enable immediate decision-making and proactive responses. Key drivers include the surge in the Internet of Things (IoT) deployments, generating unprecedented volumes of data that require sophisticated processing capabilities. Furthermore, the growing need for advanced fraud detection, risk management, and predictive maintenance solutions within financial services, telecommunications, and manufacturing industries significantly propels the adoption of CEP technologies. The market is witnessing a strong trend towards cloud-based CEP solutions, offering enhanced scalability, flexibility, and cost-efficiency for businesses of all sizes.
The CEP market is characterized by a diverse range of offerings, encompassing both software and services, with a significant uptake observed across Small and Medium Enterprises (SMEs) as well as Large Enterprises. Dominant end-user verticals include BFSI, which leverages CEP for transactional monitoring and anomaly detection, and Telecom and IT, utilizing it for network management and service assurance. The retail sector is increasingly adopting CEP for inventory management and personalized customer experiences, while healthcare benefits from real-time patient monitoring and emergency response systems. Despite the optimistic outlook, certain restraints such as the complexity of integration with existing legacy systems and the shortage of skilled professionals in CEP technology implementation and management could pose challenges. However, ongoing advancements in AI and machine learning integration within CEP platforms are expected to mitigate these restraints and further accelerate market growth.
Complex Event Processing Industry Market Dynamics & Structure
The Complex Event Processing (CEP) industry is characterized by a dynamic market structure driven by continuous technological innovation and an increasing demand for real-time data analysis. Market concentration is moderate, with key players like IBM Corporation, Oracle Corporation, and Software AG holding significant shares. However, the presence of specialized vendors such as Tibco Software Inc., SAS Institute Inc., and Espertech Inc. fosters a competitive landscape. Technological innovation, particularly in AI and machine learning integration, serves as a primary driver, enabling sophisticated pattern recognition and predictive analytics within event streams. Regulatory frameworks, especially in sensitive sectors like BFSI and Healthcare, are also shaping market adoption, demanding robust data security and compliance features. Competitive product substitutes, including traditional stream processing engines and business intelligence tools, are being increasingly outpaced by CEP's real-time capabilities. End-user demographics are diversifying, with Small and Medium Enterprises (SMEs) showing growing interest alongside Large Enterprises. Mergers and Acquisitions (M&A) remain an active trend, with companies seeking to acquire advanced CEP technologies or expand their market reach. For instance, the market has seen several acquisitions aimed at consolidating advanced analytics and AI capabilities within CEP platforms.
- Market Concentration: Moderate, with established tech giants and specialized vendors.
- Technological Innovation Drivers: AI/ML integration, real-time analytics, IoT data processing.
- Regulatory Frameworks: Driving demand for compliance and security features in BFSI and Healthcare.
- Competitive Product Substitutes: Increasingly challenged by CEP's real-time event correlation.
- End-User Demographics: Growing adoption across both Large Enterprises and SMEs.
- M&A Trends: Active consolidation for technology acquisition and market expansion.
Complex Event Processing Industry Growth Trends & Insights
The Complex Event Processing (CEP) industry is projected for substantial growth, fueled by an escalating need for real-time insights across a multitude of sectors. Leveraging advanced analytics and machine learning algorithms, the CEP market is evolving from a niche solution to a critical component of modern enterprise infrastructure. The global CEP market is estimated to reach a valuation of approximately $7,800 million by 2033, exhibiting a robust Compound Annual Growth Rate (CAGR) of 18.5% from its base year of 2025. This impressive expansion is driven by the increasing volume and velocity of data generated from IoT devices, social media, and transactional systems. Adoption rates for CEP solutions are accelerating as organizations recognize their power in detecting fraud, optimizing operations, enhancing customer experiences, and enabling proactive decision-making. Technological disruptions, such as the integration of edge computing with CEP and the advancement of in-memory processing, are further enhancing performance and reducing latency. Consumer behavior shifts towards personalized and immediate interactions are also compelling businesses to adopt CEP for hyper-personalized marketing and service delivery. The market penetration of CEP solutions is expected to deepen significantly as its applications expand into new verticals and use cases, moving beyond traditional financial services and telecommunications to encompass manufacturing, healthcare, and smart city initiatives.
The historical period (2019–2024) laid the groundwork for this growth, witnessing initial adoption by larger enterprises and a gradual understanding of CEP's value proposition. The base year (2025) marks a pivotal point where the technology is maturing and finding broader application. The forecast period (2025–2033) is anticipated to be characterized by widespread integration of CEP into core business processes, driven by its ability to unlock actionable intelligence from complex data streams. Specific metrics indicate a significant market size evolution, with projections showing a substantial increase in market value and a consistently high CAGR throughout the forecast horizon. The increasing demand for proactive anomaly detection in cybersecurity and fraud prevention within the BFSI sector, coupled with the optimization of supply chains in retail and manufacturing, are key indicators of adoption acceleration. Furthermore, the growing adoption of AI-powered analytics within CEP platforms is a significant technological disruption, enabling more sophisticated pattern recognition and predictive capabilities. The increasing consumer expectation for real-time personalized services across all industries directly translates to a growing market for CEP solutions that can facilitate such experiences.
Dominant Regions, Countries, or Segments in Complex Event Processing Industry
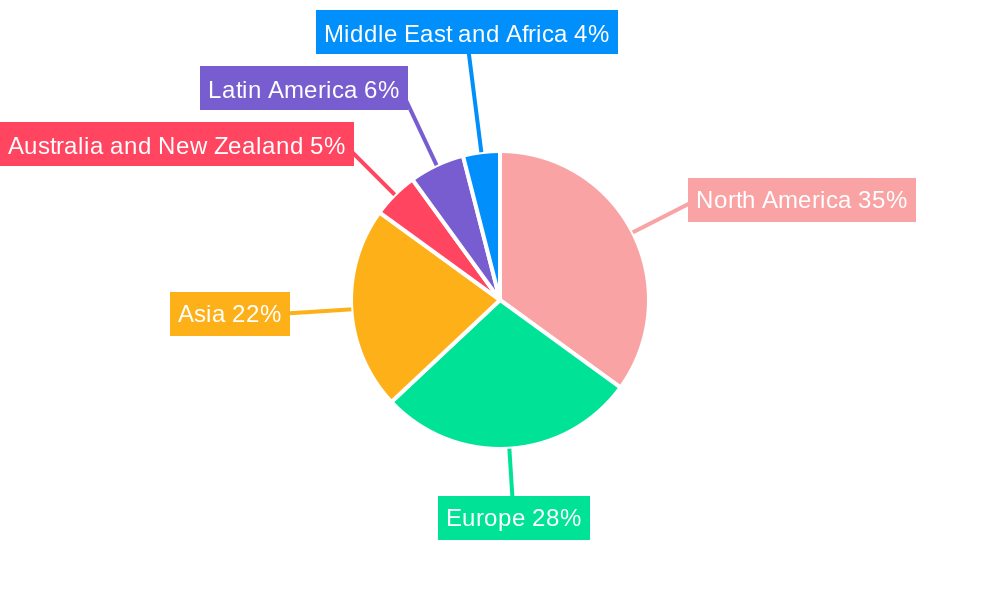
The North America region is poised to dominate the Complex Event Processing (CEP) industry during the forecast period, driven by a confluence of factors including robust technological infrastructure, a high concentration of large enterprises, and significant investments in advanced analytics and AI. The United States, in particular, will be a key growth engine within this region, accounting for a substantial portion of the market share. The presence of major technology companies and a strong emphasis on innovation within the BFSI and Healthcare sectors provide a fertile ground for CEP adoption. Economic policies that encourage digital transformation and investments in smart city initiatives further bolster the demand for real-time data processing capabilities.
- Key Drivers in North America:
- High concentration of Large Enterprises and BFSI sector.
- Significant R&D spending on AI and machine learning.
- Government initiatives supporting digital transformation.
- Developed IT infrastructure and high internet penetration.
- Increasing adoption of IoT devices.
Within the Type segment, Software is expected to lead the market, driven by the increasing demand for sophisticated CEP platforms that offer advanced analytical capabilities, scalability, and ease of integration. While Services will also see considerable growth due to the need for implementation, customization, and ongoing support, the core value proposition of CEP lies within its software capabilities.
- Dominance Factors for Software Segment:
- Enabling advanced pattern recognition and real-time analytics.
- Scalability and flexibility for diverse data streams.
- Integration with existing IT infrastructure.
- Continuous innovation in algorithms and features.
The BFSI (Banking, Financial Services, and Insurance) sector stands out as the most dominant end-user vertical. This dominance is attributed to the critical need for real-time fraud detection, algorithmic trading, risk management, and regulatory compliance within financial institutions. The sheer volume and velocity of transactions in this sector make CEP an indispensable tool for immediate insights and proactive intervention.
- Dominance Factors for BFSI Vertical:
- Real-time fraud detection and prevention (e.g., $500 million+ in fraud losses prevented annually).
- High-frequency trading and algorithmic execution.
- Dynamic risk assessment and management.
- Strict regulatory compliance requirements.
- Personalized customer service and product offerings.
The Large Enterprise segment within Enterprise Type will continue to hold a significant market share. These organizations typically generate vast amounts of complex data and have the resources and strategic imperative to invest in advanced solutions like CEP for competitive advantage. However, the growth of SMEs adopting cloud-based CEP solutions signifies a broadening market base.
- Dominance Factors for Large Enterprise Segment:
- Capacity for significant investment in advanced technology.
- Complex operational needs requiring real-time insights.
- Strategic focus on data-driven decision-making.
- Integration of CEP into core business processes.
Complex Event Processing Industry Product Landscape
The Complex Event Processing (CEP) industry product landscape is characterized by highly sophisticated software solutions and integrated platforms designed for real-time data analysis and correlation. Products feature advanced algorithms for detecting patterns, anomalies, and relationships within high-velocity, high-volume event streams. Key applications include fraud detection, real-time risk management, IoT data analytics, predictive maintenance, and personalized customer engagement. Unique selling propositions often revolve around low-latency processing, advanced pattern matching capabilities, and seamless integration with existing enterprise systems and data sources. Technological advancements are continuously pushing the boundaries, with innovations in AI-driven event correlation, in-memory computing for speed, and cloud-native architectures for scalability and flexibility.
Key Drivers, Barriers & Challenges in Complex Event Processing Industry
Key Drivers: The primary forces propelling the Complex Event Processing industry are the exponential growth of data, the increasing need for real-time decision-making across all sectors, and the pervasive adoption of IoT devices. The demand for enhanced cybersecurity, fraud prevention, and operational efficiency in industries like BFSI, Telecommunications, and Manufacturing directly fuels CEP adoption. Furthermore, the integration of AI and machine learning capabilities within CEP platforms unlocks more sophisticated analytical power, making it an indispensable tool for gaining competitive advantages.
Barriers & Challenges: Despite its growth, the CEP industry faces several challenges. The complexity of implementing and managing advanced CEP solutions can be a significant barrier, particularly for Small and Medium Enterprises (SMEs). High initial investment costs for sophisticated platforms and specialized talent can also deter adoption. Regulatory hurdles, especially concerning data privacy and security, require continuous adaptation of CEP solutions. Furthermore, the competitive landscape is intense, with established players and emerging startups vying for market share, leading to price pressures and the need for constant innovation. Supply chain disruptions, though less direct, can impact the availability of hardware components for on-premise deployments.
Emerging Opportunities in Complex Event Processing Industry
Emerging opportunities in the Complex Event Processing industry are significant, driven by evolving technological landscapes and new application areas. The expansion of edge computing presents a substantial opportunity for real-time data processing closer to the source, reducing latency and bandwidth requirements. Furthermore, the increasing adoption of AI and machine learning in various sectors creates a demand for CEP solutions that can intelligently process and correlate the outputs of these AI models for actionable insights. Untapped markets within smart city initiatives, autonomous vehicles, and predictive health monitoring are poised for rapid growth. The growing trend of personalized customer experiences across retail and media is also a fertile ground for CEP, enabling hyper-targeted interactions.
Growth Accelerators in the Complex Event Processing Industry Industry
Several catalysts are accelerating the long-term growth of the Complex Event Processing industry. Technological breakthroughs in areas like real-time stream analytics, in-memory computing, and AI-powered pattern recognition are enhancing the performance and capabilities of CEP solutions. Strategic partnerships between CEP vendors and cloud providers, as well as with AI and IoT technology companies, are expanding market reach and facilitating easier integration. Market expansion strategies, including the development of industry-specific CEP solutions and the simplification of deployment through SaaS models, are crucial for attracting a broader customer base. The increasing focus on data-driven digital transformation initiatives across enterprises globally is a fundamental driver of this accelerated growth.
Key Players Shaping the Complex Event Processing Industry Market
- SAS Institute Inc.
- Nastel Technologies Inc.
- Tibco Software Inc.
- Red Lambda Inc.
- IBM Corporation
- Software AG
- Cisco Systems Inc.
- Espertech Inc.
- Oracle Corporation
- Informatica Corporation
- SAP SE
Notable Milestones in Complex Event Processing Industry Sector
- June 2023: Cisco announced a significant initiative to reimagine human interaction with advanced AI technologies, leveraging major language models across its Collaboration and Security portfolios to enhance workforce productivity and simplicity. This development signals a deeper integration of AI and advanced analytics within enterprise solutions, a key trend for CEP.
- January 2023: Oracle introduced new logistics capabilities within its Oracle Fusion Cloud Supply Chain and Manufacturing (SCM) suite. Updates to Oracle Global Trade Management (GTM) and Oracle Transportation Management (OTM) aim to reduce costs, improve accuracy, automate compliance, and enhance logistics flexibility, highlighting the increasing demand for real-time operational intelligence in supply chains, a core CEP application area.
In-Depth Complex Event Processing Industry Market Outlook
The Complex Event Processing (CEP) industry outlook is exceptionally positive, driven by its indispensable role in harnessing the power of real-time data. Growth accelerators such as the pervasive adoption of IoT, the maturation of AI and machine learning, and the continuous digital transformation efforts of enterprises worldwide are creating immense market potential. Strategic opportunities lie in the development of more accessible, cloud-native CEP solutions tailored for SMEs, and the expansion into nascent but rapidly growing sectors like smart cities and personalized healthcare. The industry is poised for further innovation in areas like explainable AI for CEP, enabling greater trust and adoption in critical applications. The focus will remain on delivering actionable insights from the ever-increasing volume and velocity of data, solidifying CEP's position as a critical technology for competitive advantage in the digital age.
Complex Event Processing Industry Segmentation
-
1. Type
- 1.1. Software
- 1.2. Services
-
2. Enterprise Type
- 2.1. Small and Medium Enterprise
- 2.2. Large Enterprise
-
3. End-user Vertical
- 3.1. BFSI
- 3.2. Managed Mobility
- 3.3. Government and Defense
- 3.4. Retail
- 3.5. Healthcare
- 3.6. Telecom and IT Industry
- 3.7. Media and Entertainment
- 3.8. Manufacturing
- 3.9. Other End-user Verticals
Complex Event Processing Industry Segmentation By Geography
- 1. North America
- 2. Europe
- 3. Asia
- 4. Australia and New Zealand
- 5. Latin America
- 6. Middle East and Africa
Complex Event Processing Industry REPORT HIGHLIGHTS
| Aspects | Details |
|---|---|
| Study Period | 2019-2033 |
| Base Year | 2024 |
| Estimated Year | 2025 |
| Forecast Period | 2025-2033 |
| Historical Period | 2019-2024 |
| Growth Rate | CAGR of 23.76% from 2019-2033 |
| Segmentation |
|
Table of Contents
- 1. Introduction
- 1.1. Research Scope
- 1.2. Market Segmentation
- 1.3. Research Methodology
- 1.4. Definitions and Assumptions
- 2. Executive Summary
- 2.1. Introduction
- 3. Market Dynamics
- 3.1. Introduction
- 3.2. Market Drivers
- 3.2.1. Development in the Field of Machine Learning and Data Analytics; Growing Need for Real-time Analytics
- 3.3. Market Restrains
- 3.3.1. Lack of Consistency in Results
- 3.4. Market Trends
- 3.4.1. BFSI End-user Segment to Grow Significantly
- 4. Market Factor Analysis
- 4.1. Porters Five Forces
- 4.2. Supply/Value Chain
- 4.3. PESTEL analysis
- 4.4. Market Entropy
- 4.5. Patent/Trademark Analysis
- 5. Global Complex Event Processing Industry Analysis, Insights and Forecast, 2019-2031
- 5.1. Market Analysis, Insights and Forecast - by Type
- 5.1.1. Software
- 5.1.2. Services
- 5.2. Market Analysis, Insights and Forecast - by Enterprise Type
- 5.2.1. Small and Medium Enterprise
- 5.2.2. Large Enterprise
- 5.3. Market Analysis, Insights and Forecast - by End-user Vertical
- 5.3.1. BFSI
- 5.3.2. Managed Mobility
- 5.3.3. Government and Defense
- 5.3.4. Retail
- 5.3.5. Healthcare
- 5.3.6. Telecom and IT Industry
- 5.3.7. Media and Entertainment
- 5.3.8. Manufacturing
- 5.3.9. Other End-user Verticals
- 5.4. Market Analysis, Insights and Forecast - by Region
- 5.4.1. North America
- 5.4.2. Europe
- 5.4.3. Asia
- 5.4.4. Australia and New Zealand
- 5.4.5. Latin America
- 5.4.6. Middle East and Africa
- 5.1. Market Analysis, Insights and Forecast - by Type
- 6. North America Complex Event Processing Industry Analysis, Insights and Forecast, 2019-2031
- 6.1. Market Analysis, Insights and Forecast - by Type
- 6.1.1. Software
- 6.1.2. Services
- 6.2. Market Analysis, Insights and Forecast - by Enterprise Type
- 6.2.1. Small and Medium Enterprise
- 6.2.2. Large Enterprise
- 6.3. Market Analysis, Insights and Forecast - by End-user Vertical
- 6.3.1. BFSI
- 6.3.2. Managed Mobility
- 6.3.3. Government and Defense
- 6.3.4. Retail
- 6.3.5. Healthcare
- 6.3.6. Telecom and IT Industry
- 6.3.7. Media and Entertainment
- 6.3.8. Manufacturing
- 6.3.9. Other End-user Verticals
- 6.1. Market Analysis, Insights and Forecast - by Type
- 7. Europe Complex Event Processing Industry Analysis, Insights and Forecast, 2019-2031
- 7.1. Market Analysis, Insights and Forecast - by Type
- 7.1.1. Software
- 7.1.2. Services
- 7.2. Market Analysis, Insights and Forecast - by Enterprise Type
- 7.2.1. Small and Medium Enterprise
- 7.2.2. Large Enterprise
- 7.3. Market Analysis, Insights and Forecast - by End-user Vertical
- 7.3.1. BFSI
- 7.3.2. Managed Mobility
- 7.3.3. Government and Defense
- 7.3.4. Retail
- 7.3.5. Healthcare
- 7.3.6. Telecom and IT Industry
- 7.3.7. Media and Entertainment
- 7.3.8. Manufacturing
- 7.3.9. Other End-user Verticals
- 7.1. Market Analysis, Insights and Forecast - by Type
- 8. Asia Complex Event Processing Industry Analysis, Insights and Forecast, 2019-2031
- 8.1. Market Analysis, Insights and Forecast - by Type
- 8.1.1. Software
- 8.1.2. Services
- 8.2. Market Analysis, Insights and Forecast - by Enterprise Type
- 8.2.1. Small and Medium Enterprise
- 8.2.2. Large Enterprise
- 8.3. Market Analysis, Insights and Forecast - by End-user Vertical
- 8.3.1. BFSI
- 8.3.2. Managed Mobility
- 8.3.3. Government and Defense
- 8.3.4. Retail
- 8.3.5. Healthcare
- 8.3.6. Telecom and IT Industry
- 8.3.7. Media and Entertainment
- 8.3.8. Manufacturing
- 8.3.9. Other End-user Verticals
- 8.1. Market Analysis, Insights and Forecast - by Type
- 9. Australia and New Zealand Complex Event Processing Industry Analysis, Insights and Forecast, 2019-2031
- 9.1. Market Analysis, Insights and Forecast - by Type
- 9.1.1. Software
- 9.1.2. Services
- 9.2. Market Analysis, Insights and Forecast - by Enterprise Type
- 9.2.1. Small and Medium Enterprise
- 9.2.2. Large Enterprise
- 9.3. Market Analysis, Insights and Forecast - by End-user Vertical
- 9.3.1. BFSI
- 9.3.2. Managed Mobility
- 9.3.3. Government and Defense
- 9.3.4. Retail
- 9.3.5. Healthcare
- 9.3.6. Telecom and IT Industry
- 9.3.7. Media and Entertainment
- 9.3.8. Manufacturing
- 9.3.9. Other End-user Verticals
- 9.1. Market Analysis, Insights and Forecast - by Type
- 10. Latin America Complex Event Processing Industry Analysis, Insights and Forecast, 2019-2031
- 10.1. Market Analysis, Insights and Forecast - by Type
- 10.1.1. Software
- 10.1.2. Services
- 10.2. Market Analysis, Insights and Forecast - by Enterprise Type
- 10.2.1. Small and Medium Enterprise
- 10.2.2. Large Enterprise
- 10.3. Market Analysis, Insights and Forecast - by End-user Vertical
- 10.3.1. BFSI
- 10.3.2. Managed Mobility
- 10.3.3. Government and Defense
- 10.3.4. Retail
- 10.3.5. Healthcare
- 10.3.6. Telecom and IT Industry
- 10.3.7. Media and Entertainment
- 10.3.8. Manufacturing
- 10.3.9. Other End-user Verticals
- 10.1. Market Analysis, Insights and Forecast - by Type
- 11. Middle East and Africa Complex Event Processing Industry Analysis, Insights and Forecast, 2019-2031
- 11.1. Market Analysis, Insights and Forecast - by Type
- 11.1.1. Software
- 11.1.2. Services
- 11.2. Market Analysis, Insights and Forecast - by Enterprise Type
- 11.2.1. Small and Medium Enterprise
- 11.2.2. Large Enterprise
- 11.3. Market Analysis, Insights and Forecast - by End-user Vertical
- 11.3.1. BFSI
- 11.3.2. Managed Mobility
- 11.3.3. Government and Defense
- 11.3.4. Retail
- 11.3.5. Healthcare
- 11.3.6. Telecom and IT Industry
- 11.3.7. Media and Entertainment
- 11.3.8. Manufacturing
- 11.3.9. Other End-user Verticals
- 11.1. Market Analysis, Insights and Forecast - by Type
- 12. North America Complex Event Processing Industry Analysis, Insights and Forecast, 2019-2031
- 12.1. Market Analysis, Insights and Forecast - By Country/Sub-region
- 12.1.1 United States
- 12.1.2 Canada
- 12.1.3 Mexico
- 13. Europe Complex Event Processing Industry Analysis, Insights and Forecast, 2019-2031
- 13.1. Market Analysis, Insights and Forecast - By Country/Sub-region
- 13.1.1 Germany
- 13.1.2 United Kingdom
- 13.1.3 France
- 13.1.4 Spain
- 13.1.5 Italy
- 13.1.6 Spain
- 13.1.7 Belgium
- 13.1.8 Netherland
- 13.1.9 Nordics
- 13.1.10 Rest of Europe
- 14. Asia Pacific Complex Event Processing Industry Analysis, Insights and Forecast, 2019-2031
- 14.1. Market Analysis, Insights and Forecast - By Country/Sub-region
- 14.1.1 China
- 14.1.2 Japan
- 14.1.3 India
- 14.1.4 South Korea
- 14.1.5 Southeast Asia
- 14.1.6 Australia
- 14.1.7 Indonesia
- 14.1.8 Phillipes
- 14.1.9 Singapore
- 14.1.10 Thailandc
- 14.1.11 Rest of Asia Pacific
- 15. South America Complex Event Processing Industry Analysis, Insights and Forecast, 2019-2031
- 15.1. Market Analysis, Insights and Forecast - By Country/Sub-region
- 15.1.1 Brazil
- 15.1.2 Argentina
- 15.1.3 Peru
- 15.1.4 Chile
- 15.1.5 Colombia
- 15.1.6 Ecuador
- 15.1.7 Venezuela
- 15.1.8 Rest of South America
- 16. North America Complex Event Processing Industry Analysis, Insights and Forecast, 2019-2031
- 16.1. Market Analysis, Insights and Forecast - By Country/Sub-region
- 16.1.1 United States
- 16.1.2 Canada
- 16.1.3 Mexico
- 17. MEA Complex Event Processing Industry Analysis, Insights and Forecast, 2019-2031
- 17.1. Market Analysis, Insights and Forecast - By Country/Sub-region
- 17.1.1 United Arab Emirates
- 17.1.2 Saudi Arabia
- 17.1.3 South Africa
- 17.1.4 Rest of Middle East and Africa
- 18. Competitive Analysis
- 18.1. Global Market Share Analysis 2024
- 18.2. Company Profiles
- 18.2.1 SAS Institute Inc
- 18.2.1.1. Overview
- 18.2.1.2. Products
- 18.2.1.3. SWOT Analysis
- 18.2.1.4. Recent Developments
- 18.2.1.5. Financials (Based on Availability)
- 18.2.2 Nastel Technologies Inc
- 18.2.2.1. Overview
- 18.2.2.2. Products
- 18.2.2.3. SWOT Analysis
- 18.2.2.4. Recent Developments
- 18.2.2.5. Financials (Based on Availability)
- 18.2.3 Tibco Software Inc
- 18.2.3.1. Overview
- 18.2.3.2. Products
- 18.2.3.3. SWOT Analysis
- 18.2.3.4. Recent Developments
- 18.2.3.5. Financials (Based on Availability)
- 18.2.4 Red Lambda Inc *List Not Exhaustive
- 18.2.4.1. Overview
- 18.2.4.2. Products
- 18.2.4.3. SWOT Analysis
- 18.2.4.4. Recent Developments
- 18.2.4.5. Financials (Based on Availability)
- 18.2.5 IBM Corporation
- 18.2.5.1. Overview
- 18.2.5.2. Products
- 18.2.5.3. SWOT Analysis
- 18.2.5.4. Recent Developments
- 18.2.5.5. Financials (Based on Availability)
- 18.2.6 Software AG
- 18.2.6.1. Overview
- 18.2.6.2. Products
- 18.2.6.3. SWOT Analysis
- 18.2.6.4. Recent Developments
- 18.2.6.5. Financials (Based on Availability)
- 18.2.7 Cisco Systems Inc
- 18.2.7.1. Overview
- 18.2.7.2. Products
- 18.2.7.3. SWOT Analysis
- 18.2.7.4. Recent Developments
- 18.2.7.5. Financials (Based on Availability)
- 18.2.8 Espertech Inc
- 18.2.8.1. Overview
- 18.2.8.2. Products
- 18.2.8.3. SWOT Analysis
- 18.2.8.4. Recent Developments
- 18.2.8.5. Financials (Based on Availability)
- 18.2.9 Oracle Corporation
- 18.2.9.1. Overview
- 18.2.9.2. Products
- 18.2.9.3. SWOT Analysis
- 18.2.9.4. Recent Developments
- 18.2.9.5. Financials (Based on Availability)
- 18.2.10 Informatica Corporation
- 18.2.10.1. Overview
- 18.2.10.2. Products
- 18.2.10.3. SWOT Analysis
- 18.2.10.4. Recent Developments
- 18.2.10.5. Financials (Based on Availability)
- 18.2.11 SAP SE
- 18.2.11.1. Overview
- 18.2.11.2. Products
- 18.2.11.3. SWOT Analysis
- 18.2.11.4. Recent Developments
- 18.2.11.5. Financials (Based on Availability)
- 18.2.1 SAS Institute Inc
List of Figures
- Figure 1: Global Complex Event Processing Industry Revenue Breakdown (Million, %) by Region 2024 & 2032
- Figure 2: North America Complex Event Processing Industry Revenue (Million), by Country 2024 & 2032
- Figure 3: North America Complex Event Processing Industry Revenue Share (%), by Country 2024 & 2032
- Figure 4: Europe Complex Event Processing Industry Revenue (Million), by Country 2024 & 2032
- Figure 5: Europe Complex Event Processing Industry Revenue Share (%), by Country 2024 & 2032
- Figure 6: Asia Pacific Complex Event Processing Industry Revenue (Million), by Country 2024 & 2032
- Figure 7: Asia Pacific Complex Event Processing Industry Revenue Share (%), by Country 2024 & 2032
- Figure 8: South America Complex Event Processing Industry Revenue (Million), by Country 2024 & 2032
- Figure 9: South America Complex Event Processing Industry Revenue Share (%), by Country 2024 & 2032
- Figure 10: North America Complex Event Processing Industry Revenue (Million), by Country 2024 & 2032
- Figure 11: North America Complex Event Processing Industry Revenue Share (%), by Country 2024 & 2032
- Figure 12: MEA Complex Event Processing Industry Revenue (Million), by Country 2024 & 2032
- Figure 13: MEA Complex Event Processing Industry Revenue Share (%), by Country 2024 & 2032
- Figure 14: North America Complex Event Processing Industry Revenue (Million), by Type 2024 & 2032
- Figure 15: North America Complex Event Processing Industry Revenue Share (%), by Type 2024 & 2032
- Figure 16: North America Complex Event Processing Industry Revenue (Million), by Enterprise Type 2024 & 2032
- Figure 17: North America Complex Event Processing Industry Revenue Share (%), by Enterprise Type 2024 & 2032
- Figure 18: North America Complex Event Processing Industry Revenue (Million), by End-user Vertical 2024 & 2032
- Figure 19: North America Complex Event Processing Industry Revenue Share (%), by End-user Vertical 2024 & 2032
- Figure 20: North America Complex Event Processing Industry Revenue (Million), by Country 2024 & 2032
- Figure 21: North America Complex Event Processing Industry Revenue Share (%), by Country 2024 & 2032
- Figure 22: Europe Complex Event Processing Industry Revenue (Million), by Type 2024 & 2032
- Figure 23: Europe Complex Event Processing Industry Revenue Share (%), by Type 2024 & 2032
- Figure 24: Europe Complex Event Processing Industry Revenue (Million), by Enterprise Type 2024 & 2032
- Figure 25: Europe Complex Event Processing Industry Revenue Share (%), by Enterprise Type 2024 & 2032
- Figure 26: Europe Complex Event Processing Industry Revenue (Million), by End-user Vertical 2024 & 2032
- Figure 27: Europe Complex Event Processing Industry Revenue Share (%), by End-user Vertical 2024 & 2032
- Figure 28: Europe Complex Event Processing Industry Revenue (Million), by Country 2024 & 2032
- Figure 29: Europe Complex Event Processing Industry Revenue Share (%), by Country 2024 & 2032
- Figure 30: Asia Complex Event Processing Industry Revenue (Million), by Type 2024 & 2032
- Figure 31: Asia Complex Event Processing Industry Revenue Share (%), by Type 2024 & 2032
- Figure 32: Asia Complex Event Processing Industry Revenue (Million), by Enterprise Type 2024 & 2032
- Figure 33: Asia Complex Event Processing Industry Revenue Share (%), by Enterprise Type 2024 & 2032
- Figure 34: Asia Complex Event Processing Industry Revenue (Million), by End-user Vertical 2024 & 2032
- Figure 35: Asia Complex Event Processing Industry Revenue Share (%), by End-user Vertical 2024 & 2032
- Figure 36: Asia Complex Event Processing Industry Revenue (Million), by Country 2024 & 2032
- Figure 37: Asia Complex Event Processing Industry Revenue Share (%), by Country 2024 & 2032
- Figure 38: Australia and New Zealand Complex Event Processing Industry Revenue (Million), by Type 2024 & 2032
- Figure 39: Australia and New Zealand Complex Event Processing Industry Revenue Share (%), by Type 2024 & 2032
- Figure 40: Australia and New Zealand Complex Event Processing Industry Revenue (Million), by Enterprise Type 2024 & 2032
- Figure 41: Australia and New Zealand Complex Event Processing Industry Revenue Share (%), by Enterprise Type 2024 & 2032
- Figure 42: Australia and New Zealand Complex Event Processing Industry Revenue (Million), by End-user Vertical 2024 & 2032
- Figure 43: Australia and New Zealand Complex Event Processing Industry Revenue Share (%), by End-user Vertical 2024 & 2032
- Figure 44: Australia and New Zealand Complex Event Processing Industry Revenue (Million), by Country 2024 & 2032
- Figure 45: Australia and New Zealand Complex Event Processing Industry Revenue Share (%), by Country 2024 & 2032
- Figure 46: Latin America Complex Event Processing Industry Revenue (Million), by Type 2024 & 2032
- Figure 47: Latin America Complex Event Processing Industry Revenue Share (%), by Type 2024 & 2032
- Figure 48: Latin America Complex Event Processing Industry Revenue (Million), by Enterprise Type 2024 & 2032
- Figure 49: Latin America Complex Event Processing Industry Revenue Share (%), by Enterprise Type 2024 & 2032
- Figure 50: Latin America Complex Event Processing Industry Revenue (Million), by End-user Vertical 2024 & 2032
- Figure 51: Latin America Complex Event Processing Industry Revenue Share (%), by End-user Vertical 2024 & 2032
- Figure 52: Latin America Complex Event Processing Industry Revenue (Million), by Country 2024 & 2032
- Figure 53: Latin America Complex Event Processing Industry Revenue Share (%), by Country 2024 & 2032
- Figure 54: Middle East and Africa Complex Event Processing Industry Revenue (Million), by Type 2024 & 2032
- Figure 55: Middle East and Africa Complex Event Processing Industry Revenue Share (%), by Type 2024 & 2032
- Figure 56: Middle East and Africa Complex Event Processing Industry Revenue (Million), by Enterprise Type 2024 & 2032
- Figure 57: Middle East and Africa Complex Event Processing Industry Revenue Share (%), by Enterprise Type 2024 & 2032
- Figure 58: Middle East and Africa Complex Event Processing Industry Revenue (Million), by End-user Vertical 2024 & 2032
- Figure 59: Middle East and Africa Complex Event Processing Industry Revenue Share (%), by End-user Vertical 2024 & 2032
- Figure 60: Middle East and Africa Complex Event Processing Industry Revenue (Million), by Country 2024 & 2032
- Figure 61: Middle East and Africa Complex Event Processing Industry Revenue Share (%), by Country 2024 & 2032
List of Tables
- Table 1: Global Complex Event Processing Industry Revenue Million Forecast, by Region 2019 & 2032
- Table 2: Global Complex Event Processing Industry Revenue Million Forecast, by Type 2019 & 2032
- Table 3: Global Complex Event Processing Industry Revenue Million Forecast, by Enterprise Type 2019 & 2032
- Table 4: Global Complex Event Processing Industry Revenue Million Forecast, by End-user Vertical 2019 & 2032
- Table 5: Global Complex Event Processing Industry Revenue Million Forecast, by Region 2019 & 2032
- Table 6: Global Complex Event Processing Industry Revenue Million Forecast, by Country 2019 & 2032
- Table 7: United States Complex Event Processing Industry Revenue (Million) Forecast, by Application 2019 & 2032
- Table 8: Canada Complex Event Processing Industry Revenue (Million) Forecast, by Application 2019 & 2032
- Table 9: Mexico Complex Event Processing Industry Revenue (Million) Forecast, by Application 2019 & 2032
- Table 10: Global Complex Event Processing Industry Revenue Million Forecast, by Country 2019 & 2032
- Table 11: Germany Complex Event Processing Industry Revenue (Million) Forecast, by Application 2019 & 2032
- Table 12: United Kingdom Complex Event Processing Industry Revenue (Million) Forecast, by Application 2019 & 2032
- Table 13: France Complex Event Processing Industry Revenue (Million) Forecast, by Application 2019 & 2032
- Table 14: Spain Complex Event Processing Industry Revenue (Million) Forecast, by Application 2019 & 2032
- Table 15: Italy Complex Event Processing Industry Revenue (Million) Forecast, by Application 2019 & 2032
- Table 16: Spain Complex Event Processing Industry Revenue (Million) Forecast, by Application 2019 & 2032
- Table 17: Belgium Complex Event Processing Industry Revenue (Million) Forecast, by Application 2019 & 2032
- Table 18: Netherland Complex Event Processing Industry Revenue (Million) Forecast, by Application 2019 & 2032
- Table 19: Nordics Complex Event Processing Industry Revenue (Million) Forecast, by Application 2019 & 2032
- Table 20: Rest of Europe Complex Event Processing Industry Revenue (Million) Forecast, by Application 2019 & 2032
- Table 21: Global Complex Event Processing Industry Revenue Million Forecast, by Country 2019 & 2032
- Table 22: China Complex Event Processing Industry Revenue (Million) Forecast, by Application 2019 & 2032
- Table 23: Japan Complex Event Processing Industry Revenue (Million) Forecast, by Application 2019 & 2032
- Table 24: India Complex Event Processing Industry Revenue (Million) Forecast, by Application 2019 & 2032
- Table 25: South Korea Complex Event Processing Industry Revenue (Million) Forecast, by Application 2019 & 2032
- Table 26: Southeast Asia Complex Event Processing Industry Revenue (Million) Forecast, by Application 2019 & 2032
- Table 27: Australia Complex Event Processing Industry Revenue (Million) Forecast, by Application 2019 & 2032
- Table 28: Indonesia Complex Event Processing Industry Revenue (Million) Forecast, by Application 2019 & 2032
- Table 29: Phillipes Complex Event Processing Industry Revenue (Million) Forecast, by Application 2019 & 2032
- Table 30: Singapore Complex Event Processing Industry Revenue (Million) Forecast, by Application 2019 & 2032
- Table 31: Thailandc Complex Event Processing Industry Revenue (Million) Forecast, by Application 2019 & 2032
- Table 32: Rest of Asia Pacific Complex Event Processing Industry Revenue (Million) Forecast, by Application 2019 & 2032
- Table 33: Global Complex Event Processing Industry Revenue Million Forecast, by Country 2019 & 2032
- Table 34: Brazil Complex Event Processing Industry Revenue (Million) Forecast, by Application 2019 & 2032
- Table 35: Argentina Complex Event Processing Industry Revenue (Million) Forecast, by Application 2019 & 2032
- Table 36: Peru Complex Event Processing Industry Revenue (Million) Forecast, by Application 2019 & 2032
- Table 37: Chile Complex Event Processing Industry Revenue (Million) Forecast, by Application 2019 & 2032
- Table 38: Colombia Complex Event Processing Industry Revenue (Million) Forecast, by Application 2019 & 2032
- Table 39: Ecuador Complex Event Processing Industry Revenue (Million) Forecast, by Application 2019 & 2032
- Table 40: Venezuela Complex Event Processing Industry Revenue (Million) Forecast, by Application 2019 & 2032
- Table 41: Rest of South America Complex Event Processing Industry Revenue (Million) Forecast, by Application 2019 & 2032
- Table 42: Global Complex Event Processing Industry Revenue Million Forecast, by Country 2019 & 2032
- Table 43: United States Complex Event Processing Industry Revenue (Million) Forecast, by Application 2019 & 2032
- Table 44: Canada Complex Event Processing Industry Revenue (Million) Forecast, by Application 2019 & 2032
- Table 45: Mexico Complex Event Processing Industry Revenue (Million) Forecast, by Application 2019 & 2032
- Table 46: Global Complex Event Processing Industry Revenue Million Forecast, by Country 2019 & 2032
- Table 47: United Arab Emirates Complex Event Processing Industry Revenue (Million) Forecast, by Application 2019 & 2032
- Table 48: Saudi Arabia Complex Event Processing Industry Revenue (Million) Forecast, by Application 2019 & 2032
- Table 49: South Africa Complex Event Processing Industry Revenue (Million) Forecast, by Application 2019 & 2032
- Table 50: Rest of Middle East and Africa Complex Event Processing Industry Revenue (Million) Forecast, by Application 2019 & 2032
- Table 51: Global Complex Event Processing Industry Revenue Million Forecast, by Type 2019 & 2032
- Table 52: Global Complex Event Processing Industry Revenue Million Forecast, by Enterprise Type 2019 & 2032
- Table 53: Global Complex Event Processing Industry Revenue Million Forecast, by End-user Vertical 2019 & 2032
- Table 54: Global Complex Event Processing Industry Revenue Million Forecast, by Country 2019 & 2032
- Table 55: Global Complex Event Processing Industry Revenue Million Forecast, by Type 2019 & 2032
- Table 56: Global Complex Event Processing Industry Revenue Million Forecast, by Enterprise Type 2019 & 2032
- Table 57: Global Complex Event Processing Industry Revenue Million Forecast, by End-user Vertical 2019 & 2032
- Table 58: Global Complex Event Processing Industry Revenue Million Forecast, by Country 2019 & 2032
- Table 59: Global Complex Event Processing Industry Revenue Million Forecast, by Type 2019 & 2032
- Table 60: Global Complex Event Processing Industry Revenue Million Forecast, by Enterprise Type 2019 & 2032
- Table 61: Global Complex Event Processing Industry Revenue Million Forecast, by End-user Vertical 2019 & 2032
- Table 62: Global Complex Event Processing Industry Revenue Million Forecast, by Country 2019 & 2032
- Table 63: Global Complex Event Processing Industry Revenue Million Forecast, by Type 2019 & 2032
- Table 64: Global Complex Event Processing Industry Revenue Million Forecast, by Enterprise Type 2019 & 2032
- Table 65: Global Complex Event Processing Industry Revenue Million Forecast, by End-user Vertical 2019 & 2032
- Table 66: Global Complex Event Processing Industry Revenue Million Forecast, by Country 2019 & 2032
- Table 67: Global Complex Event Processing Industry Revenue Million Forecast, by Type 2019 & 2032
- Table 68: Global Complex Event Processing Industry Revenue Million Forecast, by Enterprise Type 2019 & 2032
- Table 69: Global Complex Event Processing Industry Revenue Million Forecast, by End-user Vertical 2019 & 2032
- Table 70: Global Complex Event Processing Industry Revenue Million Forecast, by Country 2019 & 2032
- Table 71: Global Complex Event Processing Industry Revenue Million Forecast, by Type 2019 & 2032
- Table 72: Global Complex Event Processing Industry Revenue Million Forecast, by Enterprise Type 2019 & 2032
- Table 73: Global Complex Event Processing Industry Revenue Million Forecast, by End-user Vertical 2019 & 2032
- Table 74: Global Complex Event Processing Industry Revenue Million Forecast, by Country 2019 & 2032
Frequently Asked Questions
1. What is the projected Compound Annual Growth Rate (CAGR) of the Complex Event Processing Industry?
The projected CAGR is approximately 23.76%.
2. Which companies are prominent players in the Complex Event Processing Industry?
Key companies in the market include SAS Institute Inc, Nastel Technologies Inc, Tibco Software Inc, Red Lambda Inc *List Not Exhaustive, IBM Corporation, Software AG, Cisco Systems Inc, Espertech Inc, Oracle Corporation, Informatica Corporation, SAP SE.
3. What are the main segments of the Complex Event Processing Industry?
The market segments include Type, Enterprise Type, End-user Vertical.
4. Can you provide details about the market size?
The market size is estimated to be USD 5.27 Million as of 2022.
5. What are some drivers contributing to market growth?
Development in the Field of Machine Learning and Data Analytics; Growing Need for Real-time Analytics.
6. What are the notable trends driving market growth?
BFSI End-user Segment to Grow Significantly.
7. Are there any restraints impacting market growth?
Lack of Consistency in Results.
8. Can you provide examples of recent developments in the market?
June 2023 - Cisco said it is reimagining how people interact with the new, advanced artificial intelligence technologies. In order to help organizations achieve productivity and simplicity in their workforce, Cisco will take advantage of major language models for Collaboration and Security across its portfolio.
9. What pricing options are available for accessing the report?
Pricing options include single-user, multi-user, and enterprise licenses priced at USD 4750, USD 5250, and USD 8750 respectively.
10. Is the market size provided in terms of value or volume?
The market size is provided in terms of value, measured in Million.
11. Are there any specific market keywords associated with the report?
Yes, the market keyword associated with the report is "Complex Event Processing Industry," which aids in identifying and referencing the specific market segment covered.
12. How do I determine which pricing option suits my needs best?
The pricing options vary based on user requirements and access needs. Individual users may opt for single-user licenses, while businesses requiring broader access may choose multi-user or enterprise licenses for cost-effective access to the report.
13. Are there any additional resources or data provided in the Complex Event Processing Industry report?
While the report offers comprehensive insights, it's advisable to review the specific contents or supplementary materials provided to ascertain if additional resources or data are available.
14. How can I stay updated on further developments or reports in the Complex Event Processing Industry?
To stay informed about further developments, trends, and reports in the Complex Event Processing Industry, consider subscribing to industry newsletters, following relevant companies and organizations, or regularly checking reputable industry news sources and publications.
Methodology
Step 1 - Identification of Relevant Samples Size from Population Database


Step 2 - Approaches for Defining Global Market Size (Value, Volume* & Price*)

Note*: In applicable scenarios
Step 3 - Data Sources
Primary Research
- Web Analytics
- Survey Reports
- Research Institute
- Latest Research Reports
- Opinion Leaders
Secondary Research
- Annual Reports
- White Paper
- Latest Press Release
- Industry Association
- Paid Database
- Investor Presentations

Step 4 - Data Triangulation
Involves using different sources of information in order to increase the validity of a study
These sources are likely to be stakeholders in a program - participants, other researchers, program staff, other community members, and so on.
Then we put all data in single framework & apply various statistical tools to find out the dynamic on the market.
During the analysis stage, feedback from the stakeholder groups would be compared to determine areas of agreement as well as areas of divergence
