

Key Insights
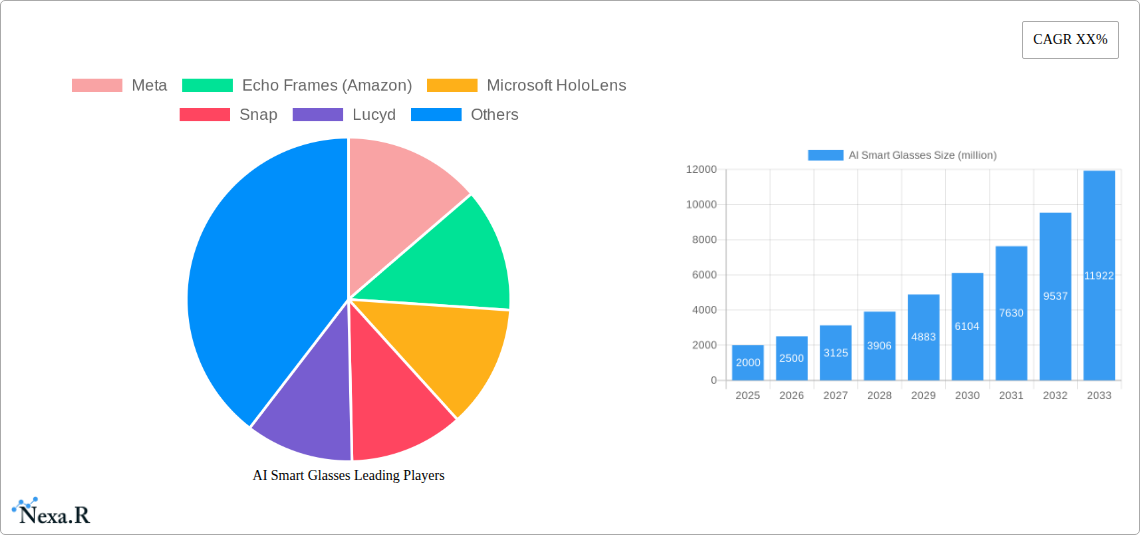
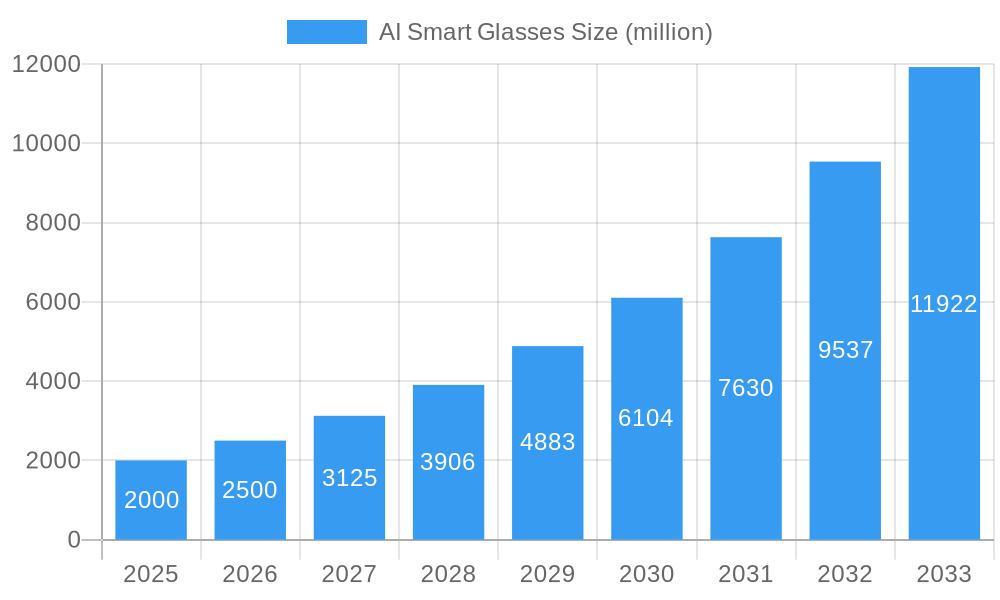
The AI smart glasses market is experiencing significant growth, driven by advancements in artificial intelligence, miniaturization of components, and increasing demand for hands-free computing and augmented reality experiences. The market, currently valued at approximately $2 billion in 2025, is projected to experience a Compound Annual Growth Rate (CAGR) of 25% between 2025 and 2033, reaching an estimated market value of $12 billion by 2033. Key drivers include the integration of AI for enhanced image recognition, real-time translation, and personalized user experiences. Emerging trends such as improved battery life, lighter and more comfortable designs, and the integration of advanced sensors like LiDAR for spatial mapping are further fueling market expansion. However, high production costs, privacy concerns related to data collection, and the need for robust infrastructure to support AI functionalities are restraining factors that need to be addressed for wider market adoption. Leading companies such as Meta, Amazon, Microsoft, Snap, and Google are heavily invested in research and development, leading to a competitive landscape characterized by ongoing innovation and product diversification. The market is segmented based on technology (e.g., computer vision, natural language processing), application (e.g., healthcare, industrial, consumer), and distribution channel (e.g., online, retail). Regional variations exist, with North America and Europe currently holding the largest market share, followed by Asia-Pacific, which is anticipated to show robust growth in the coming years.
AI Smart Glasses Market Size (In Billion)
The competitive landscape is dynamic, with established tech giants and innovative startups vying for market share. Strategic partnerships and acquisitions are expected to play a significant role in shaping the market’s future. Future growth will depend on addressing consumer concerns regarding privacy and data security, expanding the range of applications, improving user experience, and reducing production costs. Successful players will be those who can effectively balance technological advancement with consumer needs and societal expectations regarding data privacy and ethical AI practices. The development of more affordable and feature-rich devices will be crucial to driving mass-market adoption.
AI Smart Glasses Company Market Share
This comprehensive report provides an in-depth analysis of the burgeoning AI Smart Glasses market, encompassing market dynamics, growth trends, regional dominance, product landscape, key players, and future outlook. The study period covers 2019-2033, with 2025 as the base and estimated year. The forecast period spans 2025-2033, while the historical period encompasses 2019-2024. This report is a critical resource for industry professionals, investors, and anyone seeking to understand the transformative potential of AI-powered eyewear. The market is segmented by key players including Meta, Echo Frames (Amazon), Microsoft HoloLens, Snap, Lucyd, Brilliant Labs, Google, Apple, and Envision, allowing for granular analysis of competitive dynamics and market share. The parent market is considered to be the broader smart wearable technology market while the child market is specifically focused on AI enabled smart glasses. The report predicts a market size of xx million units by 2033.
AI Smart Glasses Market Dynamics & Structure
The AI smart glasses market is characterized by intense competition amongst established tech giants and emerging players. Market concentration is currently moderate, with a few dominant players holding significant shares, but fragmentation is expected to increase with new entrants. Technological innovation, driven by advancements in AI, computer vision, and miniaturization, is a primary growth driver. Regulatory frameworks concerning data privacy and safety are evolving and pose both challenges and opportunities. Competitive substitutes, such as traditional eyewear with integrated smart features, pose a moderate threat. End-user demographics are broadening, encompassing professionals, consumers, and specific niche industries. M&A activity has been moderate, with larger companies strategically acquiring smaller players to enhance their technological capabilities and market reach.
- Market Concentration: Moderately concentrated, shifting towards fragmentation (xx% market share for top 3 players in 2025).
- Technological Innovation: Rapid advancements in AI, computer vision, and miniaturization are key drivers.
- Regulatory Frameworks: Data privacy regulations (GDPR, CCPA) are influencing market development and adoption.
- Competitive Substitutes: Smart contact lenses and traditional eyewear with augmented features represent a moderate competitive threat.
- End-User Demographics: Expanding beyond early adopters to include professionals, consumers, and niche industries (e.g., healthcare, manufacturing).
- M&A Trends: Moderate activity, driven by strategic acquisitions of specialized technology companies (xx M&A deals in the historical period).
AI Smart Glasses Growth Trends & Insights
The AI smart glasses market is experiencing significant growth, driven by increasing consumer demand, technological advancements, and the expansion of applications across diverse sectors. The market size has grown from xx million units in 2019 to xx million units in 2024. The Compound Annual Growth Rate (CAGR) during the historical period (2019-2024) was xx%, and is projected to be xx% during the forecast period (2025-2033). Market penetration remains relatively low, but is expected to increase significantly as technology matures and prices decrease. Technological disruptions, such as the development of more powerful and energy-efficient processors, improved display technologies, and advanced AI algorithms, are accelerating market growth. Consumer behavior is shifting towards increased adoption of smart wearable technology, fueled by the desire for seamless connectivity, enhanced productivity, and improved accessibility.
Dominant Regions, Countries, or Segments in AI Smart Glasses
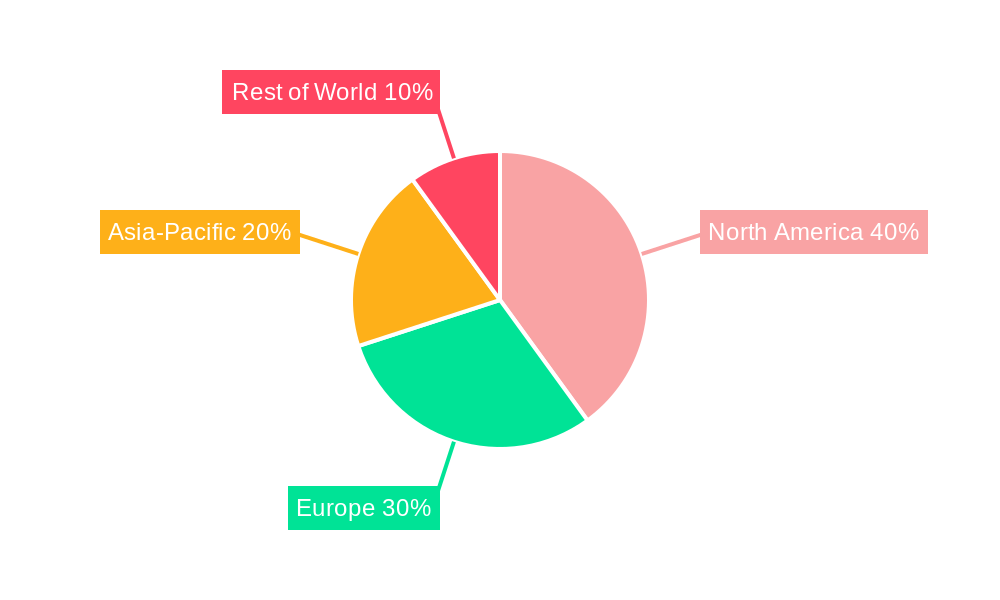
North America currently dominates the AI smart glasses market due to high consumer adoption rates, advanced technological infrastructure, and the presence of major market players. However, the Asia-Pacific region is expected to experience rapid growth in the forecast period driven by increasing smartphone penetration, rising disposable incomes, and a burgeoning tech-savvy population. The enterprise segment shows strong growth potential in numerous sectors including healthcare, manufacturing, and logistics.
- North America: High adoption rates, strong tech infrastructure, and presence of major players drive market dominance.
- Asia-Pacific: Rapid growth expected due to increasing smartphone penetration and rising disposable incomes.
- Europe: Steady growth driven by increased adoption in specific industries, such as healthcare and logistics.
- Enterprise Segment: High potential for growth due to increasing use cases in various industries (e.g., hands-free operation, remote assistance).
AI Smart Glasses Product Landscape
AI smart glasses are evolving rapidly, with new products featuring improved optical quality, enhanced AI capabilities, and longer battery life. Products vary from sleek, consumer-focused devices to rugged, industrial-grade models. Key features include augmented reality overlays, voice control, real-time translation, image recognition, and biometric authentication. Unique selling propositions often focus on specific applications, such as hands-free communication, navigation assistance, or specialized industry-specific tools. Technological advancements focus on improving battery life, processing power, and the user experience.
Key Drivers, Barriers & Challenges in AI Smart Glasses
Key Drivers:
- Advancements in AI and computer vision technologies.
- Increasing demand for hands-free computing and augmented reality experiences.
- Growing adoption of smart wearable technology across various industries.
- Development of more comfortable and aesthetically pleasing designs.
Challenges & Restraints:
- High manufacturing costs and limited production capacity, impacting pricing and accessibility.
- Concerns about privacy and data security, requiring robust security protocols.
- Limited battery life and computational power of current-generation devices.
- Lack of standardization in AI algorithms and development platforms. The supply chain vulnerability in component sourcing also impacts production.
Emerging Opportunities in AI Smart Glasses
- Expansion into untapped markets, such as developing countries with growing smartphone penetration.
- Development of niche applications in healthcare, manufacturing, and logistics.
- Integration of AI smart glasses with other IoT devices and platforms.
- Leveraging personalized data insights to improve user experience and offer targeted services.
Growth Accelerators in the AI Smart Glasses Industry
Technological breakthroughs, such as the development of more powerful and energy-efficient processors, are key growth catalysts. Strategic partnerships between tech giants and specialized companies will accelerate innovation and market adoption. Market expansion strategies focused on penetrating new markets and industry segments will further drive growth.
Key Players Shaping the AI Smart Glasses Market
- Meta
- Echo Frames (Amazon)
- Microsoft HoloLens
- Snap
- Lucyd
- Brilliant Labs
- Apple
- Envision
Notable Milestones in AI Smart Glasses Sector
- 2020-03: Meta unveils prototype of its AI smart glasses.
- 2021-11: Amazon launches Echo Frames, focusing on audio integration.
- 2022-05: Microsoft HoloLens 2 undergoes significant software updates, expanding enterprise applications.
- 2023-09: Snap releases Spectacles with improved augmented reality features.
In-Depth AI Smart Glasses Market Outlook
The AI smart glasses market is poised for significant growth, driven by continuous technological innovation and increasing consumer adoption. Strategic partnerships and expansion into new markets will shape the industry landscape. Emerging applications in healthcare, industrial settings and enhanced user experiences will unlock significant market potential. The market is expected to reach xx million units by 2033, representing substantial growth and opportunity for both established players and new entrants.
AI Smart Glasses Segmentation
-
1. Application
- 1.1. Home
- 1.2. Commercial
- 1.3. Others
-
2. Types
- 2.1. With Camera
- 2.2. Without Camera
AI Smart Glasses Segmentation By Geography
-
1. North America
- 1.1. United States
- 1.2. Canada
- 1.3. Mexico
-
2. South America
- 2.1. Brazil
- 2.2. Argentina
- 2.3. Rest of South America
-
3. Europe
- 3.1. United Kingdom
- 3.2. Germany
- 3.3. France
- 3.4. Italy
- 3.5. Spain
- 3.6. Russia
- 3.7. Benelux
- 3.8. Nordics
- 3.9. Rest of Europe
-
4. Middle East & Africa
- 4.1. Turkey
- 4.2. Israel
- 4.3. GCC
- 4.4. North Africa
- 4.5. South Africa
- 4.6. Rest of Middle East & Africa
-
5. Asia Pacific
- 5.1. China
- 5.2. India
- 5.3. Japan
- 5.4. South Korea
- 5.5. ASEAN
- 5.6. Oceania
- 5.7. Rest of Asia Pacific
AI Smart Glasses Regional Market Share
Geographic Coverage of AI Smart Glasses
AI Smart Glasses REPORT HIGHLIGHTS
| Aspects | Details |
|---|---|
| Study Period | 2020-2034 |
| Base Year | 2025 |
| Estimated Year | 2026 |
| Forecast Period | 2026-2034 |
| Historical Period | 2020-2025 |
| Growth Rate | CAGR of 10.8% from 2020-2034 |
| Segmentation |
|
Table of Contents
- 1. Introduction
- 1.1. Research Scope
- 1.2. Market Segmentation
- 1.3. Research Methodology
- 1.4. Definitions and Assumptions
- 2. Executive Summary
- 2.1. Introduction
- 3. Market Dynamics
- 3.1. Introduction
- 3.2. Market Drivers
- 3.3. Market Restrains
- 3.4. Market Trends
- 4. Market Factor Analysis
- 4.1. Porters Five Forces
- 4.2. Supply/Value Chain
- 4.3. PESTEL analysis
- 4.4. Market Entropy
- 4.5. Patent/Trademark Analysis
- 5. Global AI Smart Glasses Analysis, Insights and Forecast, 2020-2032
- 5.1. Market Analysis, Insights and Forecast - by Application
- 5.1.1. Home
- 5.1.2. Commercial
- 5.1.3. Others
- 5.2. Market Analysis, Insights and Forecast - by Types
- 5.2.1. With Camera
- 5.2.2. Without Camera
- 5.3. Market Analysis, Insights and Forecast - by Region
- 5.3.1. North America
- 5.3.2. South America
- 5.3.3. Europe
- 5.3.4. Middle East & Africa
- 5.3.5. Asia Pacific
- 5.1. Market Analysis, Insights and Forecast - by Application
- 6. North America AI Smart Glasses Analysis, Insights and Forecast, 2020-2032
- 6.1. Market Analysis, Insights and Forecast - by Application
- 6.1.1. Home
- 6.1.2. Commercial
- 6.1.3. Others
- 6.2. Market Analysis, Insights and Forecast - by Types
- 6.2.1. With Camera
- 6.2.2. Without Camera
- 6.1. Market Analysis, Insights and Forecast - by Application
- 7. South America AI Smart Glasses Analysis, Insights and Forecast, 2020-2032
- 7.1. Market Analysis, Insights and Forecast - by Application
- 7.1.1. Home
- 7.1.2. Commercial
- 7.1.3. Others
- 7.2. Market Analysis, Insights and Forecast - by Types
- 7.2.1. With Camera
- 7.2.2. Without Camera
- 7.1. Market Analysis, Insights and Forecast - by Application
- 8. Europe AI Smart Glasses Analysis, Insights and Forecast, 2020-2032
- 8.1. Market Analysis, Insights and Forecast - by Application
- 8.1.1. Home
- 8.1.2. Commercial
- 8.1.3. Others
- 8.2. Market Analysis, Insights and Forecast - by Types
- 8.2.1. With Camera
- 8.2.2. Without Camera
- 8.1. Market Analysis, Insights and Forecast - by Application
- 9. Middle East & Africa AI Smart Glasses Analysis, Insights and Forecast, 2020-2032
- 9.1. Market Analysis, Insights and Forecast - by Application
- 9.1.1. Home
- 9.1.2. Commercial
- 9.1.3. Others
- 9.2. Market Analysis, Insights and Forecast - by Types
- 9.2.1. With Camera
- 9.2.2. Without Camera
- 9.1. Market Analysis, Insights and Forecast - by Application
- 10. Asia Pacific AI Smart Glasses Analysis, Insights and Forecast, 2020-2032
- 10.1. Market Analysis, Insights and Forecast - by Application
- 10.1.1. Home
- 10.1.2. Commercial
- 10.1.3. Others
- 10.2. Market Analysis, Insights and Forecast - by Types
- 10.2.1. With Camera
- 10.2.2. Without Camera
- 10.1. Market Analysis, Insights and Forecast - by Application
- 11. Competitive Analysis
- 11.1. Global Market Share Analysis 2025
- 11.2. Company Profiles
- 11.2.1 Meta
- 11.2.1.1. Overview
- 11.2.1.2. Products
- 11.2.1.3. SWOT Analysis
- 11.2.1.4. Recent Developments
- 11.2.1.5. Financials (Based on Availability)
- 11.2.2 Echo Frames (Amazon)
- 11.2.2.1. Overview
- 11.2.2.2. Products
- 11.2.2.3. SWOT Analysis
- 11.2.2.4. Recent Developments
- 11.2.2.5. Financials (Based on Availability)
- 11.2.3 Microsoft HoloLens
- 11.2.3.1. Overview
- 11.2.3.2. Products
- 11.2.3.3. SWOT Analysis
- 11.2.3.4. Recent Developments
- 11.2.3.5. Financials (Based on Availability)
- 11.2.4 Snap
- 11.2.4.1. Overview
- 11.2.4.2. Products
- 11.2.4.3. SWOT Analysis
- 11.2.4.4. Recent Developments
- 11.2.4.5. Financials (Based on Availability)
- 11.2.5 Lucyd
- 11.2.5.1. Overview
- 11.2.5.2. Products
- 11.2.5.3. SWOT Analysis
- 11.2.5.4. Recent Developments
- 11.2.5.5. Financials (Based on Availability)
- 11.2.6 Brilliant Labs
- 11.2.6.1. Overview
- 11.2.6.2. Products
- 11.2.6.3. SWOT Analysis
- 11.2.6.4. Recent Developments
- 11.2.6.5. Financials (Based on Availability)
- 11.2.7 Google
- 11.2.7.1. Overview
- 11.2.7.2. Products
- 11.2.7.3. SWOT Analysis
- 11.2.7.4. Recent Developments
- 11.2.7.5. Financials (Based on Availability)
- 11.2.8 Apple
- 11.2.8.1. Overview
- 11.2.8.2. Products
- 11.2.8.3. SWOT Analysis
- 11.2.8.4. Recent Developments
- 11.2.8.5. Financials (Based on Availability)
- 11.2.9 Envision
- 11.2.9.1. Overview
- 11.2.9.2. Products
- 11.2.9.3. SWOT Analysis
- 11.2.9.4. Recent Developments
- 11.2.9.5. Financials (Based on Availability)
- 11.2.1 Meta
List of Figures
- Figure 1: Global AI Smart Glasses Revenue Breakdown (undefined, %) by Region 2025 & 2033
- Figure 2: Global AI Smart Glasses Volume Breakdown (K, %) by Region 2025 & 2033
- Figure 3: North America AI Smart Glasses Revenue (undefined), by Application 2025 & 2033
- Figure 4: North America AI Smart Glasses Volume (K), by Application 2025 & 2033
- Figure 5: North America AI Smart Glasses Revenue Share (%), by Application 2025 & 2033
- Figure 6: North America AI Smart Glasses Volume Share (%), by Application 2025 & 2033
- Figure 7: North America AI Smart Glasses Revenue (undefined), by Types 2025 & 2033
- Figure 8: North America AI Smart Glasses Volume (K), by Types 2025 & 2033
- Figure 9: North America AI Smart Glasses Revenue Share (%), by Types 2025 & 2033
- Figure 10: North America AI Smart Glasses Volume Share (%), by Types 2025 & 2033
- Figure 11: North America AI Smart Glasses Revenue (undefined), by Country 2025 & 2033
- Figure 12: North America AI Smart Glasses Volume (K), by Country 2025 & 2033
- Figure 13: North America AI Smart Glasses Revenue Share (%), by Country 2025 & 2033
- Figure 14: North America AI Smart Glasses Volume Share (%), by Country 2025 & 2033
- Figure 15: South America AI Smart Glasses Revenue (undefined), by Application 2025 & 2033
- Figure 16: South America AI Smart Glasses Volume (K), by Application 2025 & 2033
- Figure 17: South America AI Smart Glasses Revenue Share (%), by Application 2025 & 2033
- Figure 18: South America AI Smart Glasses Volume Share (%), by Application 2025 & 2033
- Figure 19: South America AI Smart Glasses Revenue (undefined), by Types 2025 & 2033
- Figure 20: South America AI Smart Glasses Volume (K), by Types 2025 & 2033
- Figure 21: South America AI Smart Glasses Revenue Share (%), by Types 2025 & 2033
- Figure 22: South America AI Smart Glasses Volume Share (%), by Types 2025 & 2033
- Figure 23: South America AI Smart Glasses Revenue (undefined), by Country 2025 & 2033
- Figure 24: South America AI Smart Glasses Volume (K), by Country 2025 & 2033
- Figure 25: South America AI Smart Glasses Revenue Share (%), by Country 2025 & 2033
- Figure 26: South America AI Smart Glasses Volume Share (%), by Country 2025 & 2033
- Figure 27: Europe AI Smart Glasses Revenue (undefined), by Application 2025 & 2033
- Figure 28: Europe AI Smart Glasses Volume (K), by Application 2025 & 2033
- Figure 29: Europe AI Smart Glasses Revenue Share (%), by Application 2025 & 2033
- Figure 30: Europe AI Smart Glasses Volume Share (%), by Application 2025 & 2033
- Figure 31: Europe AI Smart Glasses Revenue (undefined), by Types 2025 & 2033
- Figure 32: Europe AI Smart Glasses Volume (K), by Types 2025 & 2033
- Figure 33: Europe AI Smart Glasses Revenue Share (%), by Types 2025 & 2033
- Figure 34: Europe AI Smart Glasses Volume Share (%), by Types 2025 & 2033
- Figure 35: Europe AI Smart Glasses Revenue (undefined), by Country 2025 & 2033
- Figure 36: Europe AI Smart Glasses Volume (K), by Country 2025 & 2033
- Figure 37: Europe AI Smart Glasses Revenue Share (%), by Country 2025 & 2033
- Figure 38: Europe AI Smart Glasses Volume Share (%), by Country 2025 & 2033
- Figure 39: Middle East & Africa AI Smart Glasses Revenue (undefined), by Application 2025 & 2033
- Figure 40: Middle East & Africa AI Smart Glasses Volume (K), by Application 2025 & 2033
- Figure 41: Middle East & Africa AI Smart Glasses Revenue Share (%), by Application 2025 & 2033
- Figure 42: Middle East & Africa AI Smart Glasses Volume Share (%), by Application 2025 & 2033
- Figure 43: Middle East & Africa AI Smart Glasses Revenue (undefined), by Types 2025 & 2033
- Figure 44: Middle East & Africa AI Smart Glasses Volume (K), by Types 2025 & 2033
- Figure 45: Middle East & Africa AI Smart Glasses Revenue Share (%), by Types 2025 & 2033
- Figure 46: Middle East & Africa AI Smart Glasses Volume Share (%), by Types 2025 & 2033
- Figure 47: Middle East & Africa AI Smart Glasses Revenue (undefined), by Country 2025 & 2033
- Figure 48: Middle East & Africa AI Smart Glasses Volume (K), by Country 2025 & 2033
- Figure 49: Middle East & Africa AI Smart Glasses Revenue Share (%), by Country 2025 & 2033
- Figure 50: Middle East & Africa AI Smart Glasses Volume Share (%), by Country 2025 & 2033
- Figure 51: Asia Pacific AI Smart Glasses Revenue (undefined), by Application 2025 & 2033
- Figure 52: Asia Pacific AI Smart Glasses Volume (K), by Application 2025 & 2033
- Figure 53: Asia Pacific AI Smart Glasses Revenue Share (%), by Application 2025 & 2033
- Figure 54: Asia Pacific AI Smart Glasses Volume Share (%), by Application 2025 & 2033
- Figure 55: Asia Pacific AI Smart Glasses Revenue (undefined), by Types 2025 & 2033
- Figure 56: Asia Pacific AI Smart Glasses Volume (K), by Types 2025 & 2033
- Figure 57: Asia Pacific AI Smart Glasses Revenue Share (%), by Types 2025 & 2033
- Figure 58: Asia Pacific AI Smart Glasses Volume Share (%), by Types 2025 & 2033
- Figure 59: Asia Pacific AI Smart Glasses Revenue (undefined), by Country 2025 & 2033
- Figure 60: Asia Pacific AI Smart Glasses Volume (K), by Country 2025 & 2033
- Figure 61: Asia Pacific AI Smart Glasses Revenue Share (%), by Country 2025 & 2033
- Figure 62: Asia Pacific AI Smart Glasses Volume Share (%), by Country 2025 & 2033
List of Tables
- Table 1: Global AI Smart Glasses Revenue undefined Forecast, by Application 2020 & 2033
- Table 2: Global AI Smart Glasses Volume K Forecast, by Application 2020 & 2033
- Table 3: Global AI Smart Glasses Revenue undefined Forecast, by Types 2020 & 2033
- Table 4: Global AI Smart Glasses Volume K Forecast, by Types 2020 & 2033
- Table 5: Global AI Smart Glasses Revenue undefined Forecast, by Region 2020 & 2033
- Table 6: Global AI Smart Glasses Volume K Forecast, by Region 2020 & 2033
- Table 7: Global AI Smart Glasses Revenue undefined Forecast, by Application 2020 & 2033
- Table 8: Global AI Smart Glasses Volume K Forecast, by Application 2020 & 2033
- Table 9: Global AI Smart Glasses Revenue undefined Forecast, by Types 2020 & 2033
- Table 10: Global AI Smart Glasses Volume K Forecast, by Types 2020 & 2033
- Table 11: Global AI Smart Glasses Revenue undefined Forecast, by Country 2020 & 2033
- Table 12: Global AI Smart Glasses Volume K Forecast, by Country 2020 & 2033
- Table 13: United States AI Smart Glasses Revenue (undefined) Forecast, by Application 2020 & 2033
- Table 14: United States AI Smart Glasses Volume (K) Forecast, by Application 2020 & 2033
- Table 15: Canada AI Smart Glasses Revenue (undefined) Forecast, by Application 2020 & 2033
- Table 16: Canada AI Smart Glasses Volume (K) Forecast, by Application 2020 & 2033
- Table 17: Mexico AI Smart Glasses Revenue (undefined) Forecast, by Application 2020 & 2033
- Table 18: Mexico AI Smart Glasses Volume (K) Forecast, by Application 2020 & 2033
- Table 19: Global AI Smart Glasses Revenue undefined Forecast, by Application 2020 & 2033
- Table 20: Global AI Smart Glasses Volume K Forecast, by Application 2020 & 2033
- Table 21: Global AI Smart Glasses Revenue undefined Forecast, by Types 2020 & 2033
- Table 22: Global AI Smart Glasses Volume K Forecast, by Types 2020 & 2033
- Table 23: Global AI Smart Glasses Revenue undefined Forecast, by Country 2020 & 2033
- Table 24: Global AI Smart Glasses Volume K Forecast, by Country 2020 & 2033
- Table 25: Brazil AI Smart Glasses Revenue (undefined) Forecast, by Application 2020 & 2033
- Table 26: Brazil AI Smart Glasses Volume (K) Forecast, by Application 2020 & 2033
- Table 27: Argentina AI Smart Glasses Revenue (undefined) Forecast, by Application 2020 & 2033
- Table 28: Argentina AI Smart Glasses Volume (K) Forecast, by Application 2020 & 2033
- Table 29: Rest of South America AI Smart Glasses Revenue (undefined) Forecast, by Application 2020 & 2033
- Table 30: Rest of South America AI Smart Glasses Volume (K) Forecast, by Application 2020 & 2033
- Table 31: Global AI Smart Glasses Revenue undefined Forecast, by Application 2020 & 2033
- Table 32: Global AI Smart Glasses Volume K Forecast, by Application 2020 & 2033
- Table 33: Global AI Smart Glasses Revenue undefined Forecast, by Types 2020 & 2033
- Table 34: Global AI Smart Glasses Volume K Forecast, by Types 2020 & 2033
- Table 35: Global AI Smart Glasses Revenue undefined Forecast, by Country 2020 & 2033
- Table 36: Global AI Smart Glasses Volume K Forecast, by Country 2020 & 2033
- Table 37: United Kingdom AI Smart Glasses Revenue (undefined) Forecast, by Application 2020 & 2033
- Table 38: United Kingdom AI Smart Glasses Volume (K) Forecast, by Application 2020 & 2033
- Table 39: Germany AI Smart Glasses Revenue (undefined) Forecast, by Application 2020 & 2033
- Table 40: Germany AI Smart Glasses Volume (K) Forecast, by Application 2020 & 2033
- Table 41: France AI Smart Glasses Revenue (undefined) Forecast, by Application 2020 & 2033
- Table 42: France AI Smart Glasses Volume (K) Forecast, by Application 2020 & 2033
- Table 43: Italy AI Smart Glasses Revenue (undefined) Forecast, by Application 2020 & 2033
- Table 44: Italy AI Smart Glasses Volume (K) Forecast, by Application 2020 & 2033
- Table 45: Spain AI Smart Glasses Revenue (undefined) Forecast, by Application 2020 & 2033
- Table 46: Spain AI Smart Glasses Volume (K) Forecast, by Application 2020 & 2033
- Table 47: Russia AI Smart Glasses Revenue (undefined) Forecast, by Application 2020 & 2033
- Table 48: Russia AI Smart Glasses Volume (K) Forecast, by Application 2020 & 2033
- Table 49: Benelux AI Smart Glasses Revenue (undefined) Forecast, by Application 2020 & 2033
- Table 50: Benelux AI Smart Glasses Volume (K) Forecast, by Application 2020 & 2033
- Table 51: Nordics AI Smart Glasses Revenue (undefined) Forecast, by Application 2020 & 2033
- Table 52: Nordics AI Smart Glasses Volume (K) Forecast, by Application 2020 & 2033
- Table 53: Rest of Europe AI Smart Glasses Revenue (undefined) Forecast, by Application 2020 & 2033
- Table 54: Rest of Europe AI Smart Glasses Volume (K) Forecast, by Application 2020 & 2033
- Table 55: Global AI Smart Glasses Revenue undefined Forecast, by Application 2020 & 2033
- Table 56: Global AI Smart Glasses Volume K Forecast, by Application 2020 & 2033
- Table 57: Global AI Smart Glasses Revenue undefined Forecast, by Types 2020 & 2033
- Table 58: Global AI Smart Glasses Volume K Forecast, by Types 2020 & 2033
- Table 59: Global AI Smart Glasses Revenue undefined Forecast, by Country 2020 & 2033
- Table 60: Global AI Smart Glasses Volume K Forecast, by Country 2020 & 2033
- Table 61: Turkey AI Smart Glasses Revenue (undefined) Forecast, by Application 2020 & 2033
- Table 62: Turkey AI Smart Glasses Volume (K) Forecast, by Application 2020 & 2033
- Table 63: Israel AI Smart Glasses Revenue (undefined) Forecast, by Application 2020 & 2033
- Table 64: Israel AI Smart Glasses Volume (K) Forecast, by Application 2020 & 2033
- Table 65: GCC AI Smart Glasses Revenue (undefined) Forecast, by Application 2020 & 2033
- Table 66: GCC AI Smart Glasses Volume (K) Forecast, by Application 2020 & 2033
- Table 67: North Africa AI Smart Glasses Revenue (undefined) Forecast, by Application 2020 & 2033
- Table 68: North Africa AI Smart Glasses Volume (K) Forecast, by Application 2020 & 2033
- Table 69: South Africa AI Smart Glasses Revenue (undefined) Forecast, by Application 2020 & 2033
- Table 70: South Africa AI Smart Glasses Volume (K) Forecast, by Application 2020 & 2033
- Table 71: Rest of Middle East & Africa AI Smart Glasses Revenue (undefined) Forecast, by Application 2020 & 2033
- Table 72: Rest of Middle East & Africa AI Smart Glasses Volume (K) Forecast, by Application 2020 & 2033
- Table 73: Global AI Smart Glasses Revenue undefined Forecast, by Application 2020 & 2033
- Table 74: Global AI Smart Glasses Volume K Forecast, by Application 2020 & 2033
- Table 75: Global AI Smart Glasses Revenue undefined Forecast, by Types 2020 & 2033
- Table 76: Global AI Smart Glasses Volume K Forecast, by Types 2020 & 2033
- Table 77: Global AI Smart Glasses Revenue undefined Forecast, by Country 2020 & 2033
- Table 78: Global AI Smart Glasses Volume K Forecast, by Country 2020 & 2033
- Table 79: China AI Smart Glasses Revenue (undefined) Forecast, by Application 2020 & 2033
- Table 80: China AI Smart Glasses Volume (K) Forecast, by Application 2020 & 2033
- Table 81: India AI Smart Glasses Revenue (undefined) Forecast, by Application 2020 & 2033
- Table 82: India AI Smart Glasses Volume (K) Forecast, by Application 2020 & 2033
- Table 83: Japan AI Smart Glasses Revenue (undefined) Forecast, by Application 2020 & 2033
- Table 84: Japan AI Smart Glasses Volume (K) Forecast, by Application 2020 & 2033
- Table 85: South Korea AI Smart Glasses Revenue (undefined) Forecast, by Application 2020 & 2033
- Table 86: South Korea AI Smart Glasses Volume (K) Forecast, by Application 2020 & 2033
- Table 87: ASEAN AI Smart Glasses Revenue (undefined) Forecast, by Application 2020 & 2033
- Table 88: ASEAN AI Smart Glasses Volume (K) Forecast, by Application 2020 & 2033
- Table 89: Oceania AI Smart Glasses Revenue (undefined) Forecast, by Application 2020 & 2033
- Table 90: Oceania AI Smart Glasses Volume (K) Forecast, by Application 2020 & 2033
- Table 91: Rest of Asia Pacific AI Smart Glasses Revenue (undefined) Forecast, by Application 2020 & 2033
- Table 92: Rest of Asia Pacific AI Smart Glasses Volume (K) Forecast, by Application 2020 & 2033
Frequently Asked Questions
1. What is the projected Compound Annual Growth Rate (CAGR) of the AI Smart Glasses?
The projected CAGR is approximately 10.8%.
2. Which companies are prominent players in the AI Smart Glasses?
Key companies in the market include Meta, Echo Frames (Amazon), Microsoft HoloLens, Snap, Lucyd, Brilliant Labs, Google, Apple, Envision.
3. What are the main segments of the AI Smart Glasses?
The market segments include Application, Types.
4. Can you provide details about the market size?
The market size is estimated to be USD XXX N/A as of 2022.
5. What are some drivers contributing to market growth?
N/A
6. What are the notable trends driving market growth?
N/A
7. Are there any restraints impacting market growth?
N/A
8. Can you provide examples of recent developments in the market?
N/A
9. What pricing options are available for accessing the report?
Pricing options include single-user, multi-user, and enterprise licenses priced at USD 3950.00, USD 5925.00, and USD 7900.00 respectively.
10. Is the market size provided in terms of value or volume?
The market size is provided in terms of value, measured in N/A and volume, measured in K.
11. Are there any specific market keywords associated with the report?
Yes, the market keyword associated with the report is "AI Smart Glasses," which aids in identifying and referencing the specific market segment covered.
12. How do I determine which pricing option suits my needs best?
The pricing options vary based on user requirements and access needs. Individual users may opt for single-user licenses, while businesses requiring broader access may choose multi-user or enterprise licenses for cost-effective access to the report.
13. Are there any additional resources or data provided in the AI Smart Glasses report?
While the report offers comprehensive insights, it's advisable to review the specific contents or supplementary materials provided to ascertain if additional resources or data are available.
14. How can I stay updated on further developments or reports in the AI Smart Glasses?
To stay informed about further developments, trends, and reports in the AI Smart Glasses, consider subscribing to industry newsletters, following relevant companies and organizations, or regularly checking reputable industry news sources and publications.
Methodology
Step 1 - Identification of Relevant Samples Size from Population Database


Step 2 - Approaches for Defining Global Market Size (Value, Volume* & Price*)

Note*: In applicable scenarios
Step 3 - Data Sources
Primary Research
- Web Analytics
- Survey Reports
- Research Institute
- Latest Research Reports
- Opinion Leaders
Secondary Research
- Annual Reports
- White Paper
- Latest Press Release
- Industry Association
- Paid Database
- Investor Presentations

Step 4 - Data Triangulation
Involves using different sources of information in order to increase the validity of a study
These sources are likely to be stakeholders in a program - participants, other researchers, program staff, other community members, and so on.
Then we put all data in single framework & apply various statistical tools to find out the dynamic on the market.
During the analysis stage, feedback from the stakeholder groups would be compared to determine areas of agreement as well as areas of divergence