

Key Insights
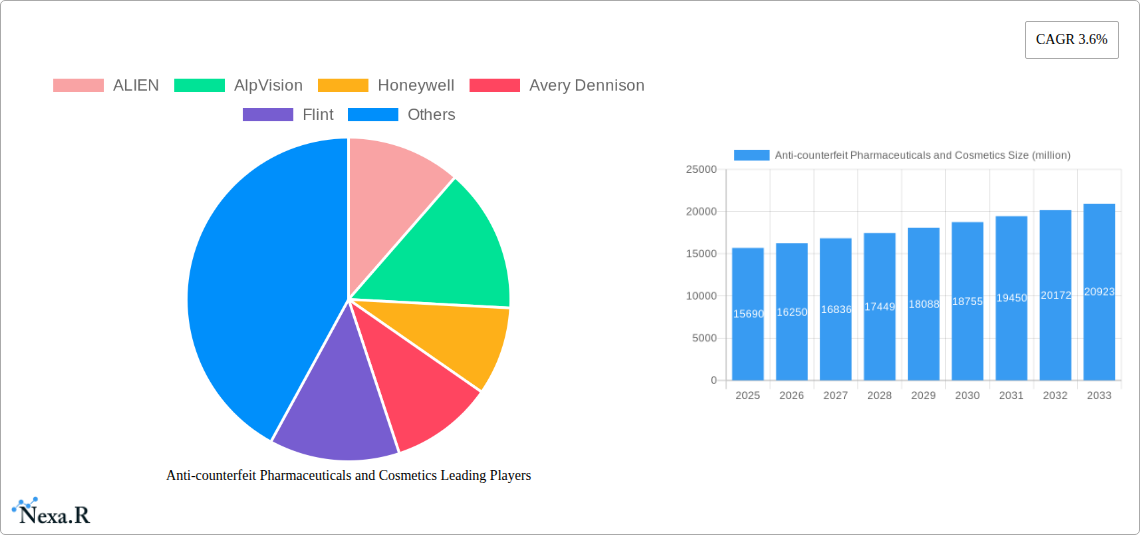
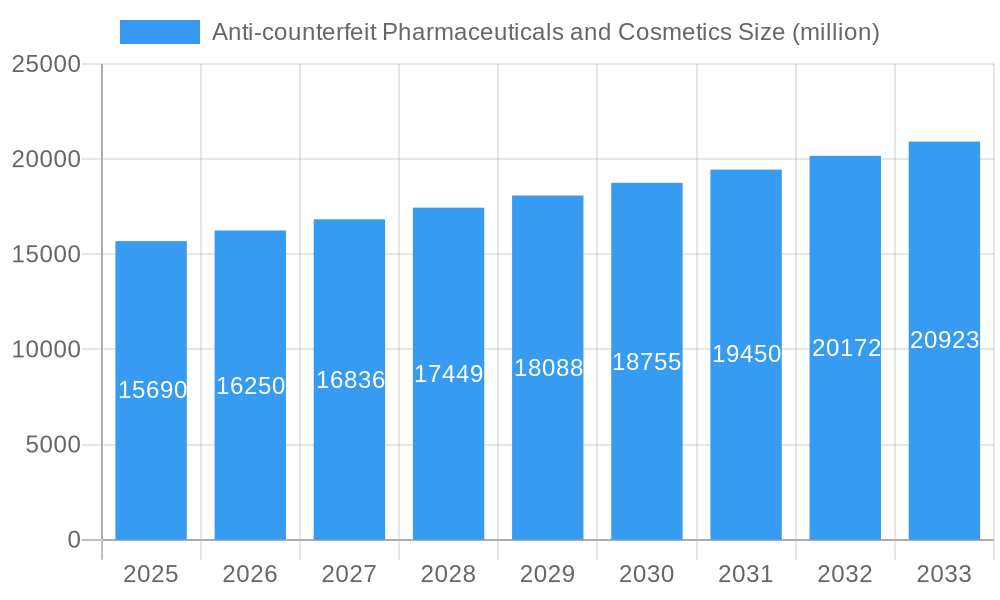
The global anti-counterfeit pharmaceuticals and cosmetics market, valued at $15.69 billion in 2025, is projected to experience robust growth, driven by a Compound Annual Growth Rate (CAGR) of 3.6% from 2025 to 2033. This expansion is fueled by several key factors. Increasing consumer awareness of counterfeit products and their potential health risks, particularly within the pharmaceutical sector, is a primary driver. Simultaneously, the rising sophistication of counterfeiting techniques necessitates the development and adoption of more advanced anti-counterfeiting technologies, stimulating market demand. Regulatory pressures from governments worldwide, aiming to protect public health and consumer rights, further contribute to market growth. The market is segmented by technology type (e.g., track and trace systems, holograms, RFID tags, and specialized inks), product type (pharmaceuticals and cosmetics), and geography. Competition is intense, with established players like Honeywell and Avery Dennison alongside innovative companies like AlpVision and Impinj vying for market share. The growth, however, may be somewhat constrained by the high initial investment costs associated with implementing anti-counterfeiting solutions, especially for smaller companies. Further, the effectiveness of certain technologies against increasingly sophisticated counterfeiting methods remains a challenge. The market's future trajectory hinges on continued technological advancements, regulatory enforcement, and sustained consumer awareness.
Anti-counterfeit Pharmaceuticals and Cosmetics Market Size (In Billion)
The forecast period (2025-2033) anticipates steady market expansion, with growth potentially accelerating in emerging economies due to increasing purchasing power and stricter regulatory environments. Companies are strategically focusing on developing integrated solutions combining various anti-counterfeiting technologies to offer comprehensive protection. This includes leveraging digital technologies like blockchain for improved supply chain transparency and traceability. Geographic expansion remains a key strategy for market players, particularly into regions with high levels of counterfeiting activity. The market is expected to witness a shift towards more sophisticated and interconnected anti-counterfeiting solutions, driven by the need for greater security and verification capabilities. This will involve a continuous interplay between technological innovation and regulatory changes shaping the landscape of the anti-counterfeit market.
Anti-counterfeit Pharmaceuticals and Cosmetics Company Market Share
Anti-counterfeit Pharmaceuticals and Cosmetics Market Report: 2019-2033
This comprehensive report provides a detailed analysis of the anti-counterfeit pharmaceuticals and cosmetics market, offering invaluable insights for industry professionals, investors, and strategists. Covering the period from 2019 to 2033, with a focus on 2025, this report unveils market dynamics, growth trends, regional dominance, and key players shaping this crucial sector. The parent market is the broader anti-counterfeiting industry, while the child market is specifically focused on pharmaceuticals and cosmetics.
Anti-counterfeit Pharmaceuticals and Cosmetics Market Dynamics & Structure
The anti-counterfeit pharmaceuticals and cosmetics market is characterized by increasing market concentration among leading technology providers. Technological innovation, driven by advancements in digital authentication and traceability solutions, is a key driver. Stringent regulatory frameworks across various jurisdictions are further shaping market dynamics, while the emergence of sophisticated counterfeits necessitates continuous innovation. The market sees significant M&A activity as larger companies acquire smaller specialized firms.
- Market Concentration: The top 5 players hold an estimated xx% market share in 2025.
- Technological Innovation: Focus on AI-powered solutions, blockchain technology, and advanced material science for enhanced security features is driving growth.
- Regulatory Landscape: Stringent regulations in regions like the EU and North America are pushing adoption of anti-counterfeiting measures.
- Competitive Substitutes: Traditional methods like holograms face competition from advanced digital authentication techniques.
- End-User Demographics: Pharmaceutical companies and high-end cosmetic brands are the primary adopters.
- M&A Trends: An average of xx M&A deals per year were observed during 2019-2024. This is expected to rise to xx deals per year by 2033. Innovation barriers include high R&D costs and regulatory approvals.
Anti-counterfeit Pharmaceuticals and Cosmetics Growth Trends & Insights
The anti-counterfeit pharmaceuticals and cosmetics market exhibits robust growth, driven by escalating concerns over product authenticity and consumer safety. The market size expanded from xx million units in 2019 to an estimated xx million units in 2025. This growth is fueled by increased adoption of advanced anti-counterfeiting technologies across the supply chain, rising consumer awareness, and stricter regulatory enforcement. Technological disruptions, such as the integration of blockchain and AI, are further accelerating market expansion. Consumer behavior shifts towards greater preference for brands with robust authenticity assurances contribute significantly to growth. The CAGR from 2025 to 2033 is projected at xx%. Market penetration in the pharmaceutical segment is estimated at xx% in 2025, while the cosmetic segment stands at xx%.
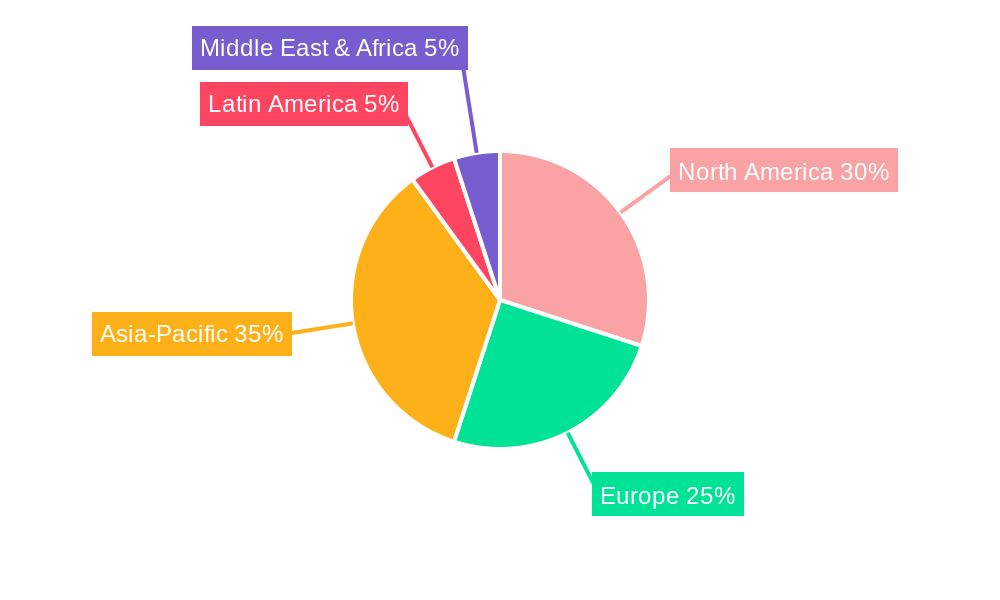
Dominant Regions, Countries, or Segments in Anti-counterfeit Pharmaceuticals and Cosmetics
North America and Europe currently dominate the anti-counterfeit pharmaceuticals and cosmetics market due to stringent regulations, robust consumer awareness, and a high prevalence of counterfeits. However, the Asia-Pacific region exhibits the highest growth potential driven by rapid economic expansion and rising consumer spending on premium products.
- Key Drivers in North America: Strong regulatory frameworks, high consumer awareness of counterfeits, and a strong pharmaceutical and cosmetic industry.
- Key Drivers in Europe: Similar to North America, coupled with unified regulatory standards across member states.
- Key Drivers in Asia-Pacific: Rapid economic growth, increasing disposable incomes, and growing demand for premium products.
- Market Share: North America holds xx% market share in 2025, while Europe holds xx% and Asia-Pacific holds xx%.
Anti-counterfeit Pharmaceuticals and Cosmetics Product Landscape
The product landscape is diverse, ranging from traditional security features like holograms and watermarks to advanced technologies such as RFID tags, blockchain-based solutions, and unique serialization codes. These technologies are integrated into product packaging and labels to enhance product traceability and authentication. Unique selling propositions center around enhanced security, ease of verification, and seamless integration into existing supply chains. Technological advancements continuously improve the robustness and sophistication of anti-counterfeiting measures.
Key Drivers, Barriers & Challenges in Anti-counterfeit Pharmaceuticals and Cosmetics
Key Drivers: The rising prevalence of counterfeit products posing significant health and safety risks, increasing consumer demand for authentic products, and stringent government regulations are primary drivers. Technological advancements enabling more sophisticated and cost-effective authentication methods also play a crucial role.
Key Challenges and Restraints: High implementation costs associated with advanced technologies can hinder adoption, particularly among smaller companies. Complex regulatory landscapes and supply chain integration complexities present further challenges. Counterfeiters also adapt their methods, requiring continuous innovation in anti-counterfeiting techniques. Supply chain disruptions can significantly impact the effectiveness of anti-counterfeiting measures.
Emerging Opportunities in Anti-counterfeit Pharmaceuticals and Cosmetics
Untapped markets in developing economies offer significant growth opportunities. The integration of IoT sensors and data analytics opens new avenues for real-time product tracking and verification. Growing consumer demand for transparency and traceability creates opportunities for innovative authentication solutions that provide end-to-end product provenance.
Growth Accelerators in the Anti-counterfeit Pharmaceuticals and Cosmetics Industry
Technological breakthroughs, particularly in AI and blockchain, are accelerating market growth. Strategic partnerships between technology providers, pharmaceutical and cosmetic companies, and regulatory bodies foster collaborative innovation and wider adoption of anti-counterfeiting solutions. Market expansion into emerging economies and the development of tailored solutions for specific product types are also key growth accelerators.
Notable Milestones in Anti-counterfeit Pharmaceuticals and Cosmetics Sector
- 2020: Introduction of blockchain-based traceability solutions by several major pharmaceutical companies.
- 2022: Implementation of stricter regulations on serialization and track and trace systems in several countries.
- 2023: Launch of new AI-powered authentication technologies capable of detecting advanced counterfeits.
- 2024: Several significant M&A activities among key players in the anti-counterfeiting technology space.
In-Depth Anti-counterfeit Pharmaceuticals and Cosmetics Market Outlook
The anti-counterfeit pharmaceuticals and cosmetics market is poised for continued expansion, driven by sustained technological innovation, growing consumer demand, and increased regulatory scrutiny. Strategic partnerships and expansion into emerging markets will play a crucial role in shaping future market dynamics. The long-term outlook is positive, with significant opportunities for companies that can deliver innovative and effective anti-counterfeiting solutions.
Anti-counterfeit Pharmaceuticals and Cosmetics Segmentation
-
1. Application
- 1.1. Pharma & Healthcare
- 1.2. Cosmetics
- 1.3. Others
-
2. Types
- 2.1. Anti-counterfeit Pharmaceutical
- 2.2. Anti-counterfeit Cosmetics
Anti-counterfeit Pharmaceuticals and Cosmetics Segmentation By Geography
-
1. North America
- 1.1. United States
- 1.2. Canada
- 1.3. Mexico
-
2. South America
- 2.1. Brazil
- 2.2. Argentina
- 2.3. Rest of South America
-
3. Europe
- 3.1. United Kingdom
- 3.2. Germany
- 3.3. France
- 3.4. Italy
- 3.5. Spain
- 3.6. Russia
- 3.7. Benelux
- 3.8. Nordics
- 3.9. Rest of Europe
-
4. Middle East & Africa
- 4.1. Turkey
- 4.2. Israel
- 4.3. GCC
- 4.4. North Africa
- 4.5. South Africa
- 4.6. Rest of Middle East & Africa
-
5. Asia Pacific
- 5.1. China
- 5.2. India
- 5.3. Japan
- 5.4. South Korea
- 5.5. ASEAN
- 5.6. Oceania
- 5.7. Rest of Asia Pacific
Anti-counterfeit Pharmaceuticals and Cosmetics Regional Market Share
Geographic Coverage of Anti-counterfeit Pharmaceuticals and Cosmetics
Anti-counterfeit Pharmaceuticals and Cosmetics REPORT HIGHLIGHTS
| Aspects | Details |
|---|---|
| Study Period | 2020-2034 |
| Base Year | 2025 |
| Estimated Year | 2026 |
| Forecast Period | 2026-2034 |
| Historical Period | 2020-2025 |
| Growth Rate | CAGR of 3.6% from 2020-2034 |
| Segmentation |
|
Table of Contents
- 1. Introduction
- 1.1. Research Scope
- 1.2. Market Segmentation
- 1.3. Research Methodology
- 1.4. Definitions and Assumptions
- 2. Executive Summary
- 2.1. Introduction
- 3. Market Dynamics
- 3.1. Introduction
- 3.2. Market Drivers
- 3.3. Market Restrains
- 3.4. Market Trends
- 4. Market Factor Analysis
- 4.1. Porters Five Forces
- 4.2. Supply/Value Chain
- 4.3. PESTEL analysis
- 4.4. Market Entropy
- 4.5. Patent/Trademark Analysis
- 5. Global Anti-counterfeit Pharmaceuticals and Cosmetics Analysis, Insights and Forecast, 2020-2032
- 5.1. Market Analysis, Insights and Forecast - by Application
- 5.1.1. Pharma & Healthcare
- 5.1.2. Cosmetics
- 5.1.3. Others
- 5.2. Market Analysis, Insights and Forecast - by Types
- 5.2.1. Anti-counterfeit Pharmaceutical
- 5.2.2. Anti-counterfeit Cosmetics
- 5.3. Market Analysis, Insights and Forecast - by Region
- 5.3.1. North America
- 5.3.2. South America
- 5.3.3. Europe
- 5.3.4. Middle East & Africa
- 5.3.5. Asia Pacific
- 5.1. Market Analysis, Insights and Forecast - by Application
- 6. North America Anti-counterfeit Pharmaceuticals and Cosmetics Analysis, Insights and Forecast, 2020-2032
- 6.1. Market Analysis, Insights and Forecast - by Application
- 6.1.1. Pharma & Healthcare
- 6.1.2. Cosmetics
- 6.1.3. Others
- 6.2. Market Analysis, Insights and Forecast - by Types
- 6.2.1. Anti-counterfeit Pharmaceutical
- 6.2.2. Anti-counterfeit Cosmetics
- 6.1. Market Analysis, Insights and Forecast - by Application
- 7. South America Anti-counterfeit Pharmaceuticals and Cosmetics Analysis, Insights and Forecast, 2020-2032
- 7.1. Market Analysis, Insights and Forecast - by Application
- 7.1.1. Pharma & Healthcare
- 7.1.2. Cosmetics
- 7.1.3. Others
- 7.2. Market Analysis, Insights and Forecast - by Types
- 7.2.1. Anti-counterfeit Pharmaceutical
- 7.2.2. Anti-counterfeit Cosmetics
- 7.1. Market Analysis, Insights and Forecast - by Application
- 8. Europe Anti-counterfeit Pharmaceuticals and Cosmetics Analysis, Insights and Forecast, 2020-2032
- 8.1. Market Analysis, Insights and Forecast - by Application
- 8.1.1. Pharma & Healthcare
- 8.1.2. Cosmetics
- 8.1.3. Others
- 8.2. Market Analysis, Insights and Forecast - by Types
- 8.2.1. Anti-counterfeit Pharmaceutical
- 8.2.2. Anti-counterfeit Cosmetics
- 8.1. Market Analysis, Insights and Forecast - by Application
- 9. Middle East & Africa Anti-counterfeit Pharmaceuticals and Cosmetics Analysis, Insights and Forecast, 2020-2032
- 9.1. Market Analysis, Insights and Forecast - by Application
- 9.1.1. Pharma & Healthcare
- 9.1.2. Cosmetics
- 9.1.3. Others
- 9.2. Market Analysis, Insights and Forecast - by Types
- 9.2.1. Anti-counterfeit Pharmaceutical
- 9.2.2. Anti-counterfeit Cosmetics
- 9.1. Market Analysis, Insights and Forecast - by Application
- 10. Asia Pacific Anti-counterfeit Pharmaceuticals and Cosmetics Analysis, Insights and Forecast, 2020-2032
- 10.1. Market Analysis, Insights and Forecast - by Application
- 10.1.1. Pharma & Healthcare
- 10.1.2. Cosmetics
- 10.1.3. Others
- 10.2. Market Analysis, Insights and Forecast - by Types
- 10.2.1. Anti-counterfeit Pharmaceutical
- 10.2.2. Anti-counterfeit Cosmetics
- 10.1. Market Analysis, Insights and Forecast - by Application
- 11. Competitive Analysis
- 11.1. Global Market Share Analysis 2025
- 11.2. Company Profiles
- 11.2.1 ALIEN
- 11.2.1.1. Overview
- 11.2.1.2. Products
- 11.2.1.3. SWOT Analysis
- 11.2.1.4. Recent Developments
- 11.2.1.5. Financials (Based on Availability)
- 11.2.2 AlpVision
- 11.2.2.1. Overview
- 11.2.2.2. Products
- 11.2.2.3. SWOT Analysis
- 11.2.2.4. Recent Developments
- 11.2.2.5. Financials (Based on Availability)
- 11.2.3 Honeywell
- 11.2.3.1. Overview
- 11.2.3.2. Products
- 11.2.3.3. SWOT Analysis
- 11.2.3.4. Recent Developments
- 11.2.3.5. Financials (Based on Availability)
- 11.2.4 Avery Dennison
- 11.2.4.1. Overview
- 11.2.4.2. Products
- 11.2.4.3. SWOT Analysis
- 11.2.4.4. Recent Developments
- 11.2.4.5. Financials (Based on Availability)
- 11.2.5 Flint
- 11.2.5.1. Overview
- 11.2.5.2. Products
- 11.2.5.3. SWOT Analysis
- 11.2.5.4. Recent Developments
- 11.2.5.5. Financials (Based on Availability)
- 11.2.6 SICPA
- 11.2.6.1. Overview
- 11.2.6.2. Products
- 11.2.6.3. SWOT Analysis
- 11.2.6.4. Recent Developments
- 11.2.6.5. Financials (Based on Availability)
- 11.2.7 IMPINJ
- 11.2.7.1. Overview
- 11.2.7.2. Products
- 11.2.7.3. SWOT Analysis
- 11.2.7.4. Recent Developments
- 11.2.7.5. Financials (Based on Availability)
- 11.2.8 Authentix
- 11.2.8.1. Overview
- 11.2.8.2. Products
- 11.2.8.3. SWOT Analysis
- 11.2.8.4. Recent Developments
- 11.2.8.5. Financials (Based on Availability)
- 11.2.9 InkSure
- 11.2.9.1. Overview
- 11.2.9.2. Products
- 11.2.9.3. SWOT Analysis
- 11.2.9.4. Recent Developments
- 11.2.9.5. Financials (Based on Availability)
- 11.2.10 ZEBRA
- 11.2.10.1. Overview
- 11.2.10.2. Products
- 11.2.10.3. SWOT Analysis
- 11.2.10.4. Recent Developments
- 11.2.10.5. Financials (Based on Availability)
- 11.2.11 LONGYING
- 11.2.11.1. Overview
- 11.2.11.2. Products
- 11.2.11.3. SWOT Analysis
- 11.2.11.4. Recent Developments
- 11.2.11.5. Financials (Based on Availability)
- 11.2.12 YONGZHENG
- 11.2.12.1. Overview
- 11.2.12.2. Products
- 11.2.12.3. SWOT Analysis
- 11.2.12.4. Recent Developments
- 11.2.12.5. Financials (Based on Availability)
- 11.2.13 TONGLI
- 11.2.13.1. Overview
- 11.2.13.2. Products
- 11.2.13.3. SWOT Analysis
- 11.2.13.4. Recent Developments
- 11.2.13.5. Financials (Based on Availability)
- 11.2.14 ZHONGCHAO
- 11.2.14.1. Overview
- 11.2.14.2. Products
- 11.2.14.3. SWOT Analysis
- 11.2.14.4. Recent Developments
- 11.2.14.5. Financials (Based on Availability)
- 11.2.1 ALIEN
List of Figures
- Figure 1: Global Anti-counterfeit Pharmaceuticals and Cosmetics Revenue Breakdown (million, %) by Region 2025 & 2033
- Figure 2: Global Anti-counterfeit Pharmaceuticals and Cosmetics Volume Breakdown (K, %) by Region 2025 & 2033
- Figure 3: North America Anti-counterfeit Pharmaceuticals and Cosmetics Revenue (million), by Application 2025 & 2033
- Figure 4: North America Anti-counterfeit Pharmaceuticals and Cosmetics Volume (K), by Application 2025 & 2033
- Figure 5: North America Anti-counterfeit Pharmaceuticals and Cosmetics Revenue Share (%), by Application 2025 & 2033
- Figure 6: North America Anti-counterfeit Pharmaceuticals and Cosmetics Volume Share (%), by Application 2025 & 2033
- Figure 7: North America Anti-counterfeit Pharmaceuticals and Cosmetics Revenue (million), by Types 2025 & 2033
- Figure 8: North America Anti-counterfeit Pharmaceuticals and Cosmetics Volume (K), by Types 2025 & 2033
- Figure 9: North America Anti-counterfeit Pharmaceuticals and Cosmetics Revenue Share (%), by Types 2025 & 2033
- Figure 10: North America Anti-counterfeit Pharmaceuticals and Cosmetics Volume Share (%), by Types 2025 & 2033
- Figure 11: North America Anti-counterfeit Pharmaceuticals and Cosmetics Revenue (million), by Country 2025 & 2033
- Figure 12: North America Anti-counterfeit Pharmaceuticals and Cosmetics Volume (K), by Country 2025 & 2033
- Figure 13: North America Anti-counterfeit Pharmaceuticals and Cosmetics Revenue Share (%), by Country 2025 & 2033
- Figure 14: North America Anti-counterfeit Pharmaceuticals and Cosmetics Volume Share (%), by Country 2025 & 2033
- Figure 15: South America Anti-counterfeit Pharmaceuticals and Cosmetics Revenue (million), by Application 2025 & 2033
- Figure 16: South America Anti-counterfeit Pharmaceuticals and Cosmetics Volume (K), by Application 2025 & 2033
- Figure 17: South America Anti-counterfeit Pharmaceuticals and Cosmetics Revenue Share (%), by Application 2025 & 2033
- Figure 18: South America Anti-counterfeit Pharmaceuticals and Cosmetics Volume Share (%), by Application 2025 & 2033
- Figure 19: South America Anti-counterfeit Pharmaceuticals and Cosmetics Revenue (million), by Types 2025 & 2033
- Figure 20: South America Anti-counterfeit Pharmaceuticals and Cosmetics Volume (K), by Types 2025 & 2033
- Figure 21: South America Anti-counterfeit Pharmaceuticals and Cosmetics Revenue Share (%), by Types 2025 & 2033
- Figure 22: South America Anti-counterfeit Pharmaceuticals and Cosmetics Volume Share (%), by Types 2025 & 2033
- Figure 23: South America Anti-counterfeit Pharmaceuticals and Cosmetics Revenue (million), by Country 2025 & 2033
- Figure 24: South America Anti-counterfeit Pharmaceuticals and Cosmetics Volume (K), by Country 2025 & 2033
- Figure 25: South America Anti-counterfeit Pharmaceuticals and Cosmetics Revenue Share (%), by Country 2025 & 2033
- Figure 26: South America Anti-counterfeit Pharmaceuticals and Cosmetics Volume Share (%), by Country 2025 & 2033
- Figure 27: Europe Anti-counterfeit Pharmaceuticals and Cosmetics Revenue (million), by Application 2025 & 2033
- Figure 28: Europe Anti-counterfeit Pharmaceuticals and Cosmetics Volume (K), by Application 2025 & 2033
- Figure 29: Europe Anti-counterfeit Pharmaceuticals and Cosmetics Revenue Share (%), by Application 2025 & 2033
- Figure 30: Europe Anti-counterfeit Pharmaceuticals and Cosmetics Volume Share (%), by Application 2025 & 2033
- Figure 31: Europe Anti-counterfeit Pharmaceuticals and Cosmetics Revenue (million), by Types 2025 & 2033
- Figure 32: Europe Anti-counterfeit Pharmaceuticals and Cosmetics Volume (K), by Types 2025 & 2033
- Figure 33: Europe Anti-counterfeit Pharmaceuticals and Cosmetics Revenue Share (%), by Types 2025 & 2033
- Figure 34: Europe Anti-counterfeit Pharmaceuticals and Cosmetics Volume Share (%), by Types 2025 & 2033
- Figure 35: Europe Anti-counterfeit Pharmaceuticals and Cosmetics Revenue (million), by Country 2025 & 2033
- Figure 36: Europe Anti-counterfeit Pharmaceuticals and Cosmetics Volume (K), by Country 2025 & 2033
- Figure 37: Europe Anti-counterfeit Pharmaceuticals and Cosmetics Revenue Share (%), by Country 2025 & 2033
- Figure 38: Europe Anti-counterfeit Pharmaceuticals and Cosmetics Volume Share (%), by Country 2025 & 2033
- Figure 39: Middle East & Africa Anti-counterfeit Pharmaceuticals and Cosmetics Revenue (million), by Application 2025 & 2033
- Figure 40: Middle East & Africa Anti-counterfeit Pharmaceuticals and Cosmetics Volume (K), by Application 2025 & 2033
- Figure 41: Middle East & Africa Anti-counterfeit Pharmaceuticals and Cosmetics Revenue Share (%), by Application 2025 & 2033
- Figure 42: Middle East & Africa Anti-counterfeit Pharmaceuticals and Cosmetics Volume Share (%), by Application 2025 & 2033
- Figure 43: Middle East & Africa Anti-counterfeit Pharmaceuticals and Cosmetics Revenue (million), by Types 2025 & 2033
- Figure 44: Middle East & Africa Anti-counterfeit Pharmaceuticals and Cosmetics Volume (K), by Types 2025 & 2033
- Figure 45: Middle East & Africa Anti-counterfeit Pharmaceuticals and Cosmetics Revenue Share (%), by Types 2025 & 2033
- Figure 46: Middle East & Africa Anti-counterfeit Pharmaceuticals and Cosmetics Volume Share (%), by Types 2025 & 2033
- Figure 47: Middle East & Africa Anti-counterfeit Pharmaceuticals and Cosmetics Revenue (million), by Country 2025 & 2033
- Figure 48: Middle East & Africa Anti-counterfeit Pharmaceuticals and Cosmetics Volume (K), by Country 2025 & 2033
- Figure 49: Middle East & Africa Anti-counterfeit Pharmaceuticals and Cosmetics Revenue Share (%), by Country 2025 & 2033
- Figure 50: Middle East & Africa Anti-counterfeit Pharmaceuticals and Cosmetics Volume Share (%), by Country 2025 & 2033
- Figure 51: Asia Pacific Anti-counterfeit Pharmaceuticals and Cosmetics Revenue (million), by Application 2025 & 2033
- Figure 52: Asia Pacific Anti-counterfeit Pharmaceuticals and Cosmetics Volume (K), by Application 2025 & 2033
- Figure 53: Asia Pacific Anti-counterfeit Pharmaceuticals and Cosmetics Revenue Share (%), by Application 2025 & 2033
- Figure 54: Asia Pacific Anti-counterfeit Pharmaceuticals and Cosmetics Volume Share (%), by Application 2025 & 2033
- Figure 55: Asia Pacific Anti-counterfeit Pharmaceuticals and Cosmetics Revenue (million), by Types 2025 & 2033
- Figure 56: Asia Pacific Anti-counterfeit Pharmaceuticals and Cosmetics Volume (K), by Types 2025 & 2033
- Figure 57: Asia Pacific Anti-counterfeit Pharmaceuticals and Cosmetics Revenue Share (%), by Types 2025 & 2033
- Figure 58: Asia Pacific Anti-counterfeit Pharmaceuticals and Cosmetics Volume Share (%), by Types 2025 & 2033
- Figure 59: Asia Pacific Anti-counterfeit Pharmaceuticals and Cosmetics Revenue (million), by Country 2025 & 2033
- Figure 60: Asia Pacific Anti-counterfeit Pharmaceuticals and Cosmetics Volume (K), by Country 2025 & 2033
- Figure 61: Asia Pacific Anti-counterfeit Pharmaceuticals and Cosmetics Revenue Share (%), by Country 2025 & 2033
- Figure 62: Asia Pacific Anti-counterfeit Pharmaceuticals and Cosmetics Volume Share (%), by Country 2025 & 2033
List of Tables
- Table 1: Global Anti-counterfeit Pharmaceuticals and Cosmetics Revenue million Forecast, by Application 2020 & 2033
- Table 2: Global Anti-counterfeit Pharmaceuticals and Cosmetics Volume K Forecast, by Application 2020 & 2033
- Table 3: Global Anti-counterfeit Pharmaceuticals and Cosmetics Revenue million Forecast, by Types 2020 & 2033
- Table 4: Global Anti-counterfeit Pharmaceuticals and Cosmetics Volume K Forecast, by Types 2020 & 2033
- Table 5: Global Anti-counterfeit Pharmaceuticals and Cosmetics Revenue million Forecast, by Region 2020 & 2033
- Table 6: Global Anti-counterfeit Pharmaceuticals and Cosmetics Volume K Forecast, by Region 2020 & 2033
- Table 7: Global Anti-counterfeit Pharmaceuticals and Cosmetics Revenue million Forecast, by Application 2020 & 2033
- Table 8: Global Anti-counterfeit Pharmaceuticals and Cosmetics Volume K Forecast, by Application 2020 & 2033
- Table 9: Global Anti-counterfeit Pharmaceuticals and Cosmetics Revenue million Forecast, by Types 2020 & 2033
- Table 10: Global Anti-counterfeit Pharmaceuticals and Cosmetics Volume K Forecast, by Types 2020 & 2033
- Table 11: Global Anti-counterfeit Pharmaceuticals and Cosmetics Revenue million Forecast, by Country 2020 & 2033
- Table 12: Global Anti-counterfeit Pharmaceuticals and Cosmetics Volume K Forecast, by Country 2020 & 2033
- Table 13: United States Anti-counterfeit Pharmaceuticals and Cosmetics Revenue (million) Forecast, by Application 2020 & 2033
- Table 14: United States Anti-counterfeit Pharmaceuticals and Cosmetics Volume (K) Forecast, by Application 2020 & 2033
- Table 15: Canada Anti-counterfeit Pharmaceuticals and Cosmetics Revenue (million) Forecast, by Application 2020 & 2033
- Table 16: Canada Anti-counterfeit Pharmaceuticals and Cosmetics Volume (K) Forecast, by Application 2020 & 2033
- Table 17: Mexico Anti-counterfeit Pharmaceuticals and Cosmetics Revenue (million) Forecast, by Application 2020 & 2033
- Table 18: Mexico Anti-counterfeit Pharmaceuticals and Cosmetics Volume (K) Forecast, by Application 2020 & 2033
- Table 19: Global Anti-counterfeit Pharmaceuticals and Cosmetics Revenue million Forecast, by Application 2020 & 2033
- Table 20: Global Anti-counterfeit Pharmaceuticals and Cosmetics Volume K Forecast, by Application 2020 & 2033
- Table 21: Global Anti-counterfeit Pharmaceuticals and Cosmetics Revenue million Forecast, by Types 2020 & 2033
- Table 22: Global Anti-counterfeit Pharmaceuticals and Cosmetics Volume K Forecast, by Types 2020 & 2033
- Table 23: Global Anti-counterfeit Pharmaceuticals and Cosmetics Revenue million Forecast, by Country 2020 & 2033
- Table 24: Global Anti-counterfeit Pharmaceuticals and Cosmetics Volume K Forecast, by Country 2020 & 2033
- Table 25: Brazil Anti-counterfeit Pharmaceuticals and Cosmetics Revenue (million) Forecast, by Application 2020 & 2033
- Table 26: Brazil Anti-counterfeit Pharmaceuticals and Cosmetics Volume (K) Forecast, by Application 2020 & 2033
- Table 27: Argentina Anti-counterfeit Pharmaceuticals and Cosmetics Revenue (million) Forecast, by Application 2020 & 2033
- Table 28: Argentina Anti-counterfeit Pharmaceuticals and Cosmetics Volume (K) Forecast, by Application 2020 & 2033
- Table 29: Rest of South America Anti-counterfeit Pharmaceuticals and Cosmetics Revenue (million) Forecast, by Application 2020 & 2033
- Table 30: Rest of South America Anti-counterfeit Pharmaceuticals and Cosmetics Volume (K) Forecast, by Application 2020 & 2033
- Table 31: Global Anti-counterfeit Pharmaceuticals and Cosmetics Revenue million Forecast, by Application 2020 & 2033
- Table 32: Global Anti-counterfeit Pharmaceuticals and Cosmetics Volume K Forecast, by Application 2020 & 2033
- Table 33: Global Anti-counterfeit Pharmaceuticals and Cosmetics Revenue million Forecast, by Types 2020 & 2033
- Table 34: Global Anti-counterfeit Pharmaceuticals and Cosmetics Volume K Forecast, by Types 2020 & 2033
- Table 35: Global Anti-counterfeit Pharmaceuticals and Cosmetics Revenue million Forecast, by Country 2020 & 2033
- Table 36: Global Anti-counterfeit Pharmaceuticals and Cosmetics Volume K Forecast, by Country 2020 & 2033
- Table 37: United Kingdom Anti-counterfeit Pharmaceuticals and Cosmetics Revenue (million) Forecast, by Application 2020 & 2033
- Table 38: United Kingdom Anti-counterfeit Pharmaceuticals and Cosmetics Volume (K) Forecast, by Application 2020 & 2033
- Table 39: Germany Anti-counterfeit Pharmaceuticals and Cosmetics Revenue (million) Forecast, by Application 2020 & 2033
- Table 40: Germany Anti-counterfeit Pharmaceuticals and Cosmetics Volume (K) Forecast, by Application 2020 & 2033
- Table 41: France Anti-counterfeit Pharmaceuticals and Cosmetics Revenue (million) Forecast, by Application 2020 & 2033
- Table 42: France Anti-counterfeit Pharmaceuticals and Cosmetics Volume (K) Forecast, by Application 2020 & 2033
- Table 43: Italy Anti-counterfeit Pharmaceuticals and Cosmetics Revenue (million) Forecast, by Application 2020 & 2033
- Table 44: Italy Anti-counterfeit Pharmaceuticals and Cosmetics Volume (K) Forecast, by Application 2020 & 2033
- Table 45: Spain Anti-counterfeit Pharmaceuticals and Cosmetics Revenue (million) Forecast, by Application 2020 & 2033
- Table 46: Spain Anti-counterfeit Pharmaceuticals and Cosmetics Volume (K) Forecast, by Application 2020 & 2033
- Table 47: Russia Anti-counterfeit Pharmaceuticals and Cosmetics Revenue (million) Forecast, by Application 2020 & 2033
- Table 48: Russia Anti-counterfeit Pharmaceuticals and Cosmetics Volume (K) Forecast, by Application 2020 & 2033
- Table 49: Benelux Anti-counterfeit Pharmaceuticals and Cosmetics Revenue (million) Forecast, by Application 2020 & 2033
- Table 50: Benelux Anti-counterfeit Pharmaceuticals and Cosmetics Volume (K) Forecast, by Application 2020 & 2033
- Table 51: Nordics Anti-counterfeit Pharmaceuticals and Cosmetics Revenue (million) Forecast, by Application 2020 & 2033
- Table 52: Nordics Anti-counterfeit Pharmaceuticals and Cosmetics Volume (K) Forecast, by Application 2020 & 2033
- Table 53: Rest of Europe Anti-counterfeit Pharmaceuticals and Cosmetics Revenue (million) Forecast, by Application 2020 & 2033
- Table 54: Rest of Europe Anti-counterfeit Pharmaceuticals and Cosmetics Volume (K) Forecast, by Application 2020 & 2033
- Table 55: Global Anti-counterfeit Pharmaceuticals and Cosmetics Revenue million Forecast, by Application 2020 & 2033
- Table 56: Global Anti-counterfeit Pharmaceuticals and Cosmetics Volume K Forecast, by Application 2020 & 2033
- Table 57: Global Anti-counterfeit Pharmaceuticals and Cosmetics Revenue million Forecast, by Types 2020 & 2033
- Table 58: Global Anti-counterfeit Pharmaceuticals and Cosmetics Volume K Forecast, by Types 2020 & 2033
- Table 59: Global Anti-counterfeit Pharmaceuticals and Cosmetics Revenue million Forecast, by Country 2020 & 2033
- Table 60: Global Anti-counterfeit Pharmaceuticals and Cosmetics Volume K Forecast, by Country 2020 & 2033
- Table 61: Turkey Anti-counterfeit Pharmaceuticals and Cosmetics Revenue (million) Forecast, by Application 2020 & 2033
- Table 62: Turkey Anti-counterfeit Pharmaceuticals and Cosmetics Volume (K) Forecast, by Application 2020 & 2033
- Table 63: Israel Anti-counterfeit Pharmaceuticals and Cosmetics Revenue (million) Forecast, by Application 2020 & 2033
- Table 64: Israel Anti-counterfeit Pharmaceuticals and Cosmetics Volume (K) Forecast, by Application 2020 & 2033
- Table 65: GCC Anti-counterfeit Pharmaceuticals and Cosmetics Revenue (million) Forecast, by Application 2020 & 2033
- Table 66: GCC Anti-counterfeit Pharmaceuticals and Cosmetics Volume (K) Forecast, by Application 2020 & 2033
- Table 67: North Africa Anti-counterfeit Pharmaceuticals and Cosmetics Revenue (million) Forecast, by Application 2020 & 2033
- Table 68: North Africa Anti-counterfeit Pharmaceuticals and Cosmetics Volume (K) Forecast, by Application 2020 & 2033
- Table 69: South Africa Anti-counterfeit Pharmaceuticals and Cosmetics Revenue (million) Forecast, by Application 2020 & 2033
- Table 70: South Africa Anti-counterfeit Pharmaceuticals and Cosmetics Volume (K) Forecast, by Application 2020 & 2033
- Table 71: Rest of Middle East & Africa Anti-counterfeit Pharmaceuticals and Cosmetics Revenue (million) Forecast, by Application 2020 & 2033
- Table 72: Rest of Middle East & Africa Anti-counterfeit Pharmaceuticals and Cosmetics Volume (K) Forecast, by Application 2020 & 2033
- Table 73: Global Anti-counterfeit Pharmaceuticals and Cosmetics Revenue million Forecast, by Application 2020 & 2033
- Table 74: Global Anti-counterfeit Pharmaceuticals and Cosmetics Volume K Forecast, by Application 2020 & 2033
- Table 75: Global Anti-counterfeit Pharmaceuticals and Cosmetics Revenue million Forecast, by Types 2020 & 2033
- Table 76: Global Anti-counterfeit Pharmaceuticals and Cosmetics Volume K Forecast, by Types 2020 & 2033
- Table 77: Global Anti-counterfeit Pharmaceuticals and Cosmetics Revenue million Forecast, by Country 2020 & 2033
- Table 78: Global Anti-counterfeit Pharmaceuticals and Cosmetics Volume K Forecast, by Country 2020 & 2033
- Table 79: China Anti-counterfeit Pharmaceuticals and Cosmetics Revenue (million) Forecast, by Application 2020 & 2033
- Table 80: China Anti-counterfeit Pharmaceuticals and Cosmetics Volume (K) Forecast, by Application 2020 & 2033
- Table 81: India Anti-counterfeit Pharmaceuticals and Cosmetics Revenue (million) Forecast, by Application 2020 & 2033
- Table 82: India Anti-counterfeit Pharmaceuticals and Cosmetics Volume (K) Forecast, by Application 2020 & 2033
- Table 83: Japan Anti-counterfeit Pharmaceuticals and Cosmetics Revenue (million) Forecast, by Application 2020 & 2033
- Table 84: Japan Anti-counterfeit Pharmaceuticals and Cosmetics Volume (K) Forecast, by Application 2020 & 2033
- Table 85: South Korea Anti-counterfeit Pharmaceuticals and Cosmetics Revenue (million) Forecast, by Application 2020 & 2033
- Table 86: South Korea Anti-counterfeit Pharmaceuticals and Cosmetics Volume (K) Forecast, by Application 2020 & 2033
- Table 87: ASEAN Anti-counterfeit Pharmaceuticals and Cosmetics Revenue (million) Forecast, by Application 2020 & 2033
- Table 88: ASEAN Anti-counterfeit Pharmaceuticals and Cosmetics Volume (K) Forecast, by Application 2020 & 2033
- Table 89: Oceania Anti-counterfeit Pharmaceuticals and Cosmetics Revenue (million) Forecast, by Application 2020 & 2033
- Table 90: Oceania Anti-counterfeit Pharmaceuticals and Cosmetics Volume (K) Forecast, by Application 2020 & 2033
- Table 91: Rest of Asia Pacific Anti-counterfeit Pharmaceuticals and Cosmetics Revenue (million) Forecast, by Application 2020 & 2033
- Table 92: Rest of Asia Pacific Anti-counterfeit Pharmaceuticals and Cosmetics Volume (K) Forecast, by Application 2020 & 2033
Frequently Asked Questions
1. What is the projected Compound Annual Growth Rate (CAGR) of the Anti-counterfeit Pharmaceuticals and Cosmetics?
The projected CAGR is approximately 3.6%.
2. Which companies are prominent players in the Anti-counterfeit Pharmaceuticals and Cosmetics?
Key companies in the market include ALIEN, AlpVision, Honeywell, Avery Dennison, Flint, SICPA, IMPINJ, Authentix, InkSure, ZEBRA, LONGYING, YONGZHENG, TONGLI, ZHONGCHAO.
3. What are the main segments of the Anti-counterfeit Pharmaceuticals and Cosmetics?
The market segments include Application, Types.
4. Can you provide details about the market size?
The market size is estimated to be USD 15690 million as of 2022.
5. What are some drivers contributing to market growth?
N/A
6. What are the notable trends driving market growth?
N/A
7. Are there any restraints impacting market growth?
N/A
8. Can you provide examples of recent developments in the market?
N/A
9. What pricing options are available for accessing the report?
Pricing options include single-user, multi-user, and enterprise licenses priced at USD 3950.00, USD 5925.00, and USD 7900.00 respectively.
10. Is the market size provided in terms of value or volume?
The market size is provided in terms of value, measured in million and volume, measured in K.
11. Are there any specific market keywords associated with the report?
Yes, the market keyword associated with the report is "Anti-counterfeit Pharmaceuticals and Cosmetics," which aids in identifying and referencing the specific market segment covered.
12. How do I determine which pricing option suits my needs best?
The pricing options vary based on user requirements and access needs. Individual users may opt for single-user licenses, while businesses requiring broader access may choose multi-user or enterprise licenses for cost-effective access to the report.
13. Are there any additional resources or data provided in the Anti-counterfeit Pharmaceuticals and Cosmetics report?
While the report offers comprehensive insights, it's advisable to review the specific contents or supplementary materials provided to ascertain if additional resources or data are available.
14. How can I stay updated on further developments or reports in the Anti-counterfeit Pharmaceuticals and Cosmetics?
To stay informed about further developments, trends, and reports in the Anti-counterfeit Pharmaceuticals and Cosmetics, consider subscribing to industry newsletters, following relevant companies and organizations, or regularly checking reputable industry news sources and publications.
Methodology
Step 1 - Identification of Relevant Samples Size from Population Database


Step 2 - Approaches for Defining Global Market Size (Value, Volume* & Price*)

Note*: In applicable scenarios
Step 3 - Data Sources
Primary Research
- Web Analytics
- Survey Reports
- Research Institute
- Latest Research Reports
- Opinion Leaders
Secondary Research
- Annual Reports
- White Paper
- Latest Press Release
- Industry Association
- Paid Database
- Investor Presentations

Step 4 - Data Triangulation
Involves using different sources of information in order to increase the validity of a study
These sources are likely to be stakeholders in a program - participants, other researchers, program staff, other community members, and so on.
Then we put all data in single framework & apply various statistical tools to find out the dynamic on the market.
During the analysis stage, feedback from the stakeholder groups would be compared to determine areas of agreement as well as areas of divergence