

Key Insights
The global Artificial Intelligence (AI) PCs market is poised for substantial expansion, projected to reach an estimated market size of approximately $65,000 million by 2025, with a remarkable Compound Annual Growth Rate (CAGR) of 22% anticipated through 2033. This rapid ascent is propelled by a confluence of powerful drivers, most notably the increasing integration of advanced AI capabilities directly into personal computing devices. The demand for enhanced productivity, personalized user experiences, and sophisticated data processing at the edge is fueling the adoption of AI-equipped laptops and desktops. Key applications like online sales, benefiting from AI-powered personalization and predictive analytics, and offline sales, seeing improvements in in-store customer engagement through AI, are expected to witness significant growth. Furthermore, the evolution of AI hardware and software is enabling more powerful AI functionalities across various device types, including popular 14-inch and 16-inch form factors, thereby broadening market appeal.
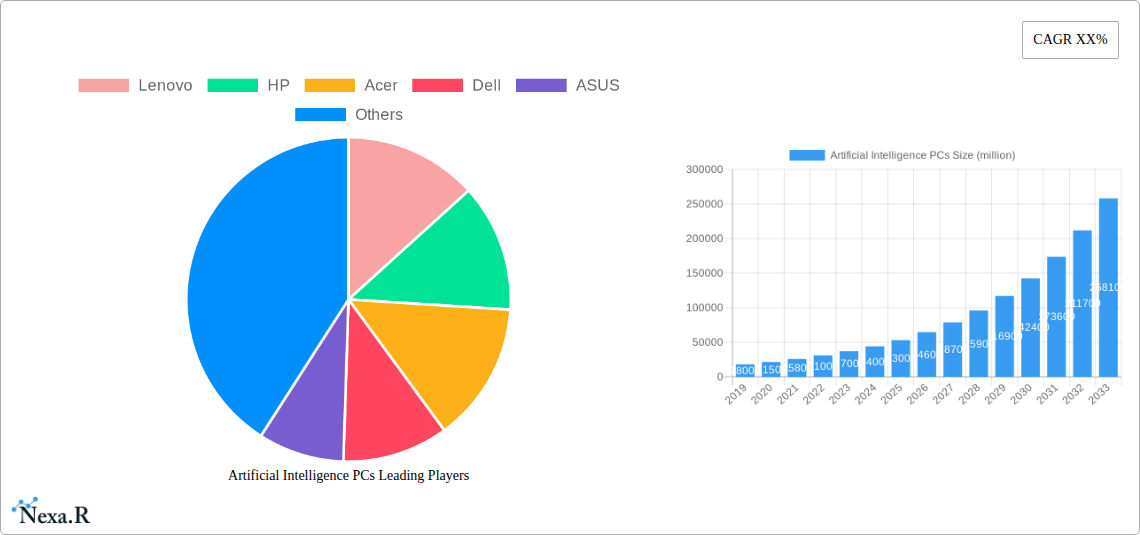
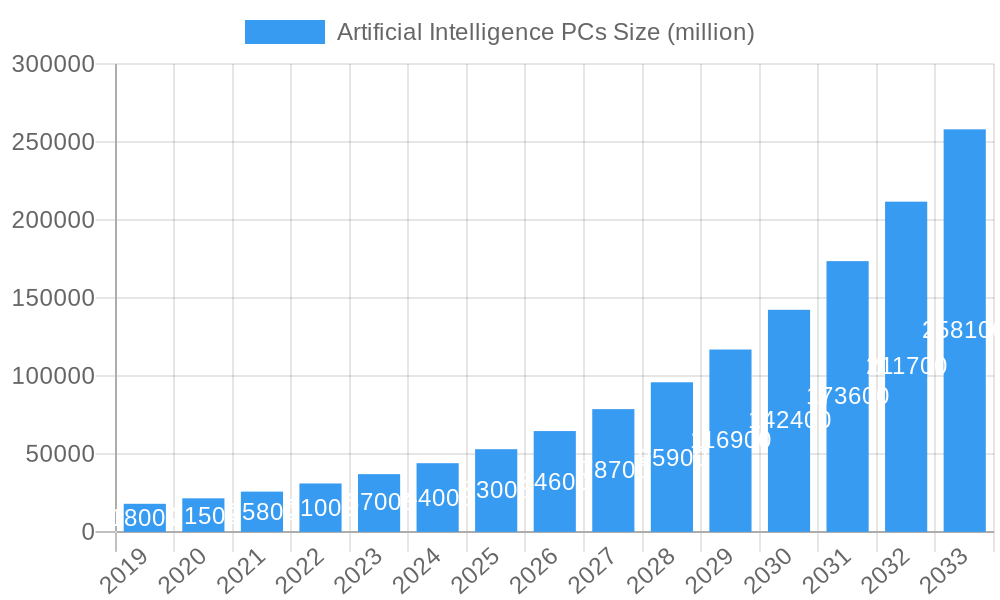
Artificial Intelligence PCs Market Size (In Billion)
This transformative growth trajectory is underscored by emerging trends such as the development of dedicated AI accelerators within processors, enabling faster and more efficient AI operations. The proliferation of AI-powered software suites, from content creation tools to advanced security solutions, further solidifies the value proposition of AI PCs for both consumers and businesses. While the market enjoys strong momentum, certain restraints could temper its pace. These include the initial higher cost of AI-enabled hardware compared to traditional PCs, potential consumer concerns regarding data privacy and security with increased AI processing, and the ongoing need for widespread developer support to create a robust ecosystem of AI-native applications. Nevertheless, the commitment of major players like Lenovo, HP, Acer, Dell, and ASUS to innovate and integrate AI features positions the market for sustained and dynamic expansion in the coming years, with Asia Pacific expected to lead the charge due to its vast consumer base and rapid technological adoption.
Artificial Intelligence PCs Company Market Share
Comprehensive Report: Artificial Intelligence PCs Market Analysis & Future Outlook (2019-2033)
Unlock the future of computing with our in-depth report on the Artificial Intelligence (AI) PCs market. This definitive guide offers a strategic roadmap for industry professionals, investors, and technology leaders, detailing market dynamics, growth trajectories, and key players shaping the AI-powered personal computing landscape. Covering the period from 2019 to 2033, with a base year of 2025, this report provides unparalleled insights into market size evolution, technological advancements, and emerging opportunities across major applications, product types, and regions.
Artificial Intelligence PCs Market Dynamics & Structure
The Artificial Intelligence (AI) PCs market is characterized by a dynamic interplay of rapid technological innovation, evolving consumer demands, and strategic corporate maneuvers. Market concentration is currently moderate, with key players like Lenovo, HP, Acer, Dell, and ASUS actively investing in R&D to integrate advanced AI capabilities into their product lines. Technological innovation drivers are primarily fueled by advancements in AI chips (NPUs), machine learning algorithms, and edge computing, enabling on-device AI processing for enhanced speed, privacy, and efficiency. Regulatory frameworks, while still nascent, are beginning to focus on AI ethics, data privacy, and responsible AI deployment, potentially influencing product development and market entry strategies. Competitive product substitutes are emerging from traditional high-performance computing and specialized AI accelerators, but AI PCs offer a unique blend of integrated AI features for everyday tasks. End-user demographics are expanding beyond early adopters to include mainstream consumers and businesses seeking productivity gains, personalized experiences, and enhanced security through AI. Mergers & Acquisitions (M&A) trends are expected to accelerate as companies seek to acquire specialized AI talent, proprietary technologies, and to consolidate market positions.
- Technological Innovation Drivers: Integration of dedicated NPUs, advanced ML algorithms, on-device AI processing, enhanced power efficiency.
- Regulatory Considerations: Emerging focus on AI ethics, data privacy compliance, and responsible AI development guidelines.
- Competitive Landscape: Competition from high-performance computing, cloud-based AI services, and specialized AI hardware.
- End-User Segmentation: Growing adoption by mainstream consumers, professionals, content creators, and enterprise users.
- M&A Activity: Strategic acquisitions aimed at bolstering AI IP, talent acquisition, and market share expansion.
Artificial Intelligence PCs Growth Trends & Insights
The global Artificial Intelligence (AI) PCs market is poised for exponential growth, driven by increasing demand for intelligent computing experiences and rapid technological advancements. The market size is projected to witness a significant surge from approximately 150 million units in 2025 to an estimated 600 million units by 2033, reflecting a compound annual growth rate (CAGR) of around 18%. This robust expansion is underpinned by a confluence of factors, including the widespread integration of dedicated Neural Processing Units (NPUs) into mainstream processors, enabling sophisticated AI functionalities directly on the device without relying solely on cloud connectivity. Adoption rates are accelerating as consumers and businesses recognize the tangible benefits of AI-powered features, such as enhanced productivity tools, intelligent content creation, personalized user experiences, and improved security measures. Technological disruptions, including advancements in generative AI models and their seamless integration into operating systems and applications, are fundamentally reshaping the PC experience, making AI PCs indispensable for future computing. Consumer behavior shifts are marked by an increasing expectation for intuitive, proactive, and personalized interactions with their devices, which AI PCs are uniquely positioned to deliver.
The market penetration of AI PCs is anticipated to climb from an estimated 25% in 2025 to over 70% by 2033. This upward trend is supported by decreasing costs of AI-enabled hardware, a growing ecosystem of AI-powered software applications, and effective marketing strategies by leading manufacturers like Lenovo, HP, Acer, Dell, and ASUS, highlighting the transformative capabilities of these devices. The evolution of AI applications, from advanced image and video editing to real-time language translation and sophisticated cybersecurity defenses, is creating compelling use cases that resonate with a broad spectrum of users. Furthermore, the growing awareness of AI's potential to automate mundane tasks, augment creativity, and enhance decision-making processes is driving demand across both consumer and enterprise segments. The strategic focus on developing energy-efficient AI hardware is also crucial, ensuring that these powerful capabilities can be delivered without compromising battery life or increasing thermal concerns, further fueling widespread adoption. The continuous innovation in AI algorithms and their practical implementation in everyday computing scenarios will be a key determinant of sustained market growth and penetration.
Dominant Regions, Countries, or Segments in Artificial Intelligence PCs
North America is emerging as a dominant region in the Artificial Intelligence (AI) PCs market, driven by its robust technological infrastructure, high disposable incomes, and a strong early adopter culture for cutting-edge technologies. The region's significant market share, estimated at 30% in 2025, is further bolstered by aggressive market penetration strategies from leading PC manufacturers and a burgeoning ecosystem of AI software developers. Economic policies that foster innovation and significant investments in research and development by both private enterprises and government initiatives create a fertile ground for AI PC adoption. Furthermore, the presence of major technology hubs and a highly skilled workforce contribute to the rapid integration of AI technologies into personal computing devices.
Within North America, the United States stands out as the leading country, accounting for an estimated 22% of the global AI PC market in 2025. This dominance is fueled by widespread enterprise adoption of AI for productivity enhancements, a strong consumer demand for premium and feature-rich devices, and extensive online sales channels. The availability of advanced AI-powered applications and the consistent introduction of new AI PC models by companies like HP, Dell, and Lenovo contribute to this leadership.
In terms of application, Online Sales are a significant growth driver, estimated to account for 60% of the total AI PC market share in 2025. This segment's dominance is attributed to the convenience, wider selection, and competitive pricing offered through e-commerce platforms. Consumers are increasingly comfortable researching, comparing, and purchasing complex technological products online, making it a preferred channel for AI PC acquisitions.
Regarding product types, 14-inch AI PCs are anticipated to hold the largest market share, estimated at 45% in 2025. These devices strike an optimal balance between portability and performance, catering to a broad user base, including students, professionals, and frequent travelers. The growing emphasis on lightweight yet powerful laptops with integrated AI capabilities for on-the-go productivity and content creation further solidifies the dominance of the 14-inch segment.
- Dominant Region: North America
- Key Drivers: Strong technological infrastructure, high disposable income, early adoption of technology, supportive economic policies, and R&D investments.
- Market Share (North America): ~30% (2025)
- Leading Country: United States
- Dominance Factors: Enterprise AI adoption, strong consumer demand, extensive online sales infrastructure, AI software ecosystem.
- Market Share (United States): ~22% (2025)
- Dominant Application: Online Sales
- Growth Drivers: Convenience, wider product selection, competitive pricing, ease of comparison and purchase.
- Market Share (Online Sales): ~60% (2025)
- Dominant Product Type: 14 Inches
- Appeal: Optimal balance of portability and performance, suitability for students, professionals, and travelers.
- Market Share (14 Inches): ~45% (2025)
Artificial Intelligence PCs Product Landscape
The AI PC product landscape is rapidly evolving with a focus on enhanced performance, intelligent features, and seamless user experiences. Key innovations include the integration of dedicated Neural Processing Units (NPUs) within CPUs, enabling significant gains in AI inferencing tasks such as real-time image processing, natural language understanding, and generative AI applications directly on the device. Laptops are increasingly offering specialized AI-driven features for content creation, such as AI-assisted video editing, intelligent noise cancellation for audio, and AI-powered image enhancement. Performance metrics are being redefined by AI-specific benchmarks, showcasing faster task completion for AI workloads and improved power efficiency for battery-intensive AI operations. Unique selling propositions revolve around on-device privacy, reduced latency, and personalized computing experiences that adapt to user behavior.
Key Drivers, Barriers & Challenges in Artificial Intelligence PCs
The Artificial Intelligence (AI) PCs market is propelled by several key drivers, foremost among them being the technological advancements in AI hardware, particularly the integration of powerful NPUs and the continuous improvement of AI algorithms. This enables on-device processing for enhanced speed, privacy, and efficiency. Growing consumer and enterprise demand for intelligent features, productivity enhancements, and personalized computing experiences further fuels growth. Strategic initiatives by major players like Lenovo, HP, Acer, Dell, and ASUS to incorporate AI capabilities across their product portfolios also act as significant drivers.
However, the market faces several barriers and challenges. High initial manufacturing costs for AI-enabled components can lead to premium pricing, potentially limiting mass adoption, especially in price-sensitive segments. Consumer awareness and education regarding the tangible benefits of AI PCs remain a challenge; many users are still unaware of the full potential and practical applications. Software ecosystem maturity is another hurdle, as the widespread availability and optimization of AI-powered applications across various use cases are still developing. Supply chain complexities for specialized AI chips and components can also pose risks to production volumes and timely delivery, impacting market expansion. Furthermore, data privacy concerns and ethical considerations surrounding AI usage necessitate robust security measures and transparent policies, which can add to development complexity and cost.
Emerging Opportunities in Artificial Intelligence PCs
Emerging opportunities in the Artificial Intelligence (AI) PCs sector lie in the untapped potential of personalized AI assistants that can proactively manage user workflows, optimize system performance, and offer predictive support. The integration of AI in gaming is another fertile ground, with AI-powered graphics rendering, intelligent NPC behavior, and adaptive game difficulty offering a more immersive and engaging experience. Furthermore, the burgeoning field of on-device generative AI applications, such as AI-powered writing assistants and creative content generation tools, presents a significant opportunity for differentiation and market capture. The expansion of AI PCs into specialized professional fields, like AI-assisted medical diagnostics and engineering design, also represents a considerable untapped market.
Growth Accelerators in the Artificial Intelligence PCs Industry
Several catalysts are accelerating the long-term growth of the Artificial Intelligence (AI) PCs industry. Continued technological breakthroughs in AI chip design, focusing on increased performance and energy efficiency, will lower costs and expand capabilities. Strategic partnerships between chip manufacturers, PC OEMs, and software developers are crucial for building a robust AI-powered ecosystem and driving application innovation. Government initiatives promoting AI adoption and research can further stimulate market growth by providing funding and regulatory support. The increasing consumer demand for more intuitive, personalized, and intelligent computing experiences, coupled with the expanding range of AI-driven software applications, will solidify AI PCs as a mainstream computing standard.
Key Players Shaping the Artificial Intelligence PCs Market
- Lenovo
- HP
- Acer
- Dell
- ASUS
Notable Milestones in Artificial Intelligence PCs Sector
- 2023 Q4: Launch of Intel Core Ultra processors featuring dedicated NPUs, marking a significant step towards mainstream AI PCs.
- 2024 Q1: Qualcomm announces Snapdragon X Elite platform, bringing advanced AI capabilities to Windows laptops.
- 2024 Q2: Microsoft integrates AI-powered features like Copilot more deeply into Windows operating system, enhancing user experience.
- 2024 Q3: NVIDIA announces new AI-focused GPUs for consumer laptops, boosting AI performance for creative and gaming applications.
- 2025 onwards: Anticipated widespread adoption of AI PCs across all major OEMs, with dedicated AI features becoming standard.
In-Depth Artificial Intelligence PCs Market Outlook
The outlook for the Artificial Intelligence (AI) PCs market is exceptionally promising, driven by sustained technological innovation and an expanding ecosystem of AI-powered applications. Growth accelerators, including advancements in NPUs, strategic OEM partnerships, and increasing consumer appetite for intelligent computing, will ensure robust market expansion. The future of personal computing is undeniably AI-centric, with AI PCs poised to become the standard, offering unparalleled productivity, creativity, and personalized experiences. Professionals and consumers alike will increasingly rely on these devices for seamless task automation, enhanced content creation, and advanced data processing, paving the way for significant market potential and strategic opportunities.
Artificial Intelligence PCs Segmentation
-
1. Application
- 1.1. Online Sales
- 1.2. Offline Sales
-
2. Types
- 2.1. 14 Inches
- 2.2. 16 Inches
- 2.3. Other
Artificial Intelligence PCs Segmentation By Geography
-
1. North America
- 1.1. United States
- 1.2. Canada
- 1.3. Mexico
-
2. South America
- 2.1. Brazil
- 2.2. Argentina
- 2.3. Rest of South America
-
3. Europe
- 3.1. United Kingdom
- 3.2. Germany
- 3.3. France
- 3.4. Italy
- 3.5. Spain
- 3.6. Russia
- 3.7. Benelux
- 3.8. Nordics
- 3.9. Rest of Europe
-
4. Middle East & Africa
- 4.1. Turkey
- 4.2. Israel
- 4.3. GCC
- 4.4. North Africa
- 4.5. South Africa
- 4.6. Rest of Middle East & Africa
-
5. Asia Pacific
- 5.1. China
- 5.2. India
- 5.3. Japan
- 5.4. South Korea
- 5.5. ASEAN
- 5.6. Oceania
- 5.7. Rest of Asia Pacific
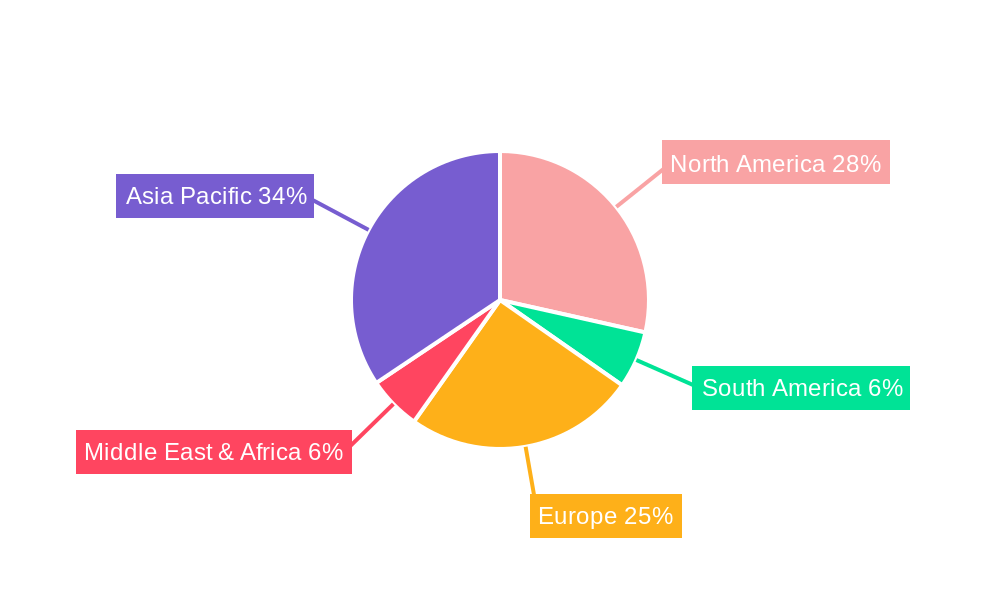
Artificial Intelligence PCs Regional Market Share
Geographic Coverage of Artificial Intelligence PCs
Artificial Intelligence PCs REPORT HIGHLIGHTS
| Aspects | Details |
|---|---|
| Study Period | 2020-2034 |
| Base Year | 2025 |
| Estimated Year | 2026 |
| Forecast Period | 2026-2034 |
| Historical Period | 2020-2025 |
| Growth Rate | CAGR of 19.1% from 2020-2034 |
| Segmentation |
|
Table of Contents
- 1. Introduction
- 1.1. Research Scope
- 1.2. Market Segmentation
- 1.3. Research Objective
- 1.4. Definitions and Assumptions
- 2. Executive Summary
- 2.1. Market Snapshot
- 3. Market Dynamics
- 3.1. Market Drivers
- 3.2. Market Restrains
- 3.3. Market Trends
- 3.4. Market Opportunities
- 4. Market Factor Analysis
- 4.1. Porters Five Forces
- 4.1.1. Bargaining Power of Suppliers
- 4.1.2. Bargaining Power of Buyers
- 4.1.3. Threat of New Entrants
- 4.1.4. Threat of Substitutes
- 4.1.5. Competitive Rivalry
- 4.2. PESTEL analysis
- 4.3. BCG Analysis
- 4.3.1. Stars (High Growth, High Market Share)
- 4.3.2. Cash Cows (Low Growth, High Market Share)
- 4.3.3. Question Mark (High Growth, Low Market Share)
- 4.3.4. Dogs (Low Growth, Low Market Share)
- 4.4. Ansoff Matrix Analysis
- 4.5. Supply Chain Analysis
- 4.6. Regulatory Landscape
- 4.7. Current Market Potential and Opportunity Assessment (TAM–SAM–SOM Framework)
- 4.8. NRP Analyst Note
- 4.1. Porters Five Forces
- 5. Market Analysis, Insights and Forecast 2021-2033
- 5.1. Market Analysis, Insights and Forecast - by Application
- 5.1.1. Online Sales
- 5.1.2. Offline Sales
- 5.2. Market Analysis, Insights and Forecast - by Types
- 5.2.1. 14 Inches
- 5.2.2. 16 Inches
- 5.2.3. Other
- 5.3. Market Analysis, Insights and Forecast - by Region
- 5.3.1. North America
- 5.3.2. South America
- 5.3.3. Europe
- 5.3.4. Middle East & Africa
- 5.3.5. Asia Pacific
- 5.1. Market Analysis, Insights and Forecast - by Application
- 6. Global Artificial Intelligence PCs Analysis, Insights and Forecast, 2021-2033
- 6.1. Market Analysis, Insights and Forecast - by Application
- 6.1.1. Online Sales
- 6.1.2. Offline Sales
- 6.2. Market Analysis, Insights and Forecast - by Types
- 6.2.1. 14 Inches
- 6.2.2. 16 Inches
- 6.2.3. Other
- 6.1. Market Analysis, Insights and Forecast - by Application
- 7. North America Artificial Intelligence PCs Analysis, Insights and Forecast, 2020-2032
- 7.1. Market Analysis, Insights and Forecast - by Application
- 7.1.1. Online Sales
- 7.1.2. Offline Sales
- 7.2. Market Analysis, Insights and Forecast - by Types
- 7.2.1. 14 Inches
- 7.2.2. 16 Inches
- 7.2.3. Other
- 7.1. Market Analysis, Insights and Forecast - by Application
- 8. South America Artificial Intelligence PCs Analysis, Insights and Forecast, 2020-2032
- 8.1. Market Analysis, Insights and Forecast - by Application
- 8.1.1. Online Sales
- 8.1.2. Offline Sales
- 8.2. Market Analysis, Insights and Forecast - by Types
- 8.2.1. 14 Inches
- 8.2.2. 16 Inches
- 8.2.3. Other
- 8.1. Market Analysis, Insights and Forecast - by Application
- 9. Europe Artificial Intelligence PCs Analysis, Insights and Forecast, 2020-2032
- 9.1. Market Analysis, Insights and Forecast - by Application
- 9.1.1. Online Sales
- 9.1.2. Offline Sales
- 9.2. Market Analysis, Insights and Forecast - by Types
- 9.2.1. 14 Inches
- 9.2.2. 16 Inches
- 9.2.3. Other
- 9.1. Market Analysis, Insights and Forecast - by Application
- 10. Middle East & Africa Artificial Intelligence PCs Analysis, Insights and Forecast, 2020-2032
- 10.1. Market Analysis, Insights and Forecast - by Application
- 10.1.1. Online Sales
- 10.1.2. Offline Sales
- 10.2. Market Analysis, Insights and Forecast - by Types
- 10.2.1. 14 Inches
- 10.2.2. 16 Inches
- 10.2.3. Other
- 10.1. Market Analysis, Insights and Forecast - by Application
- 11. Asia Pacific Artificial Intelligence PCs Analysis, Insights and Forecast, 2020-2032
- 11.1. Market Analysis, Insights and Forecast - by Application
- 11.1.1. Online Sales
- 11.1.2. Offline Sales
- 11.2. Market Analysis, Insights and Forecast - by Types
- 11.2.1. 14 Inches
- 11.2.2. 16 Inches
- 11.2.3. Other
- 11.1. Market Analysis, Insights and Forecast - by Application
- 12. Competitive Analysis
- 12.1. Company Profiles
- 12.1.1 Lenovo
- 12.1.1.1. Company Overview
- 12.1.1.2. Products
- 12.1.1.3. Company Financials
- 12.1.1.4. SWOT Analysis
- 12.1.2 HP
- 12.1.2.1. Company Overview
- 12.1.2.2. Products
- 12.1.2.3. Company Financials
- 12.1.2.4. SWOT Analysis
- 12.1.3 Acer
- 12.1.3.1. Company Overview
- 12.1.3.2. Products
- 12.1.3.3. Company Financials
- 12.1.3.4. SWOT Analysis
- 12.1.4 Dell
- 12.1.4.1. Company Overview
- 12.1.4.2. Products
- 12.1.4.3. Company Financials
- 12.1.4.4. SWOT Analysis
- 12.1.5 ASUS
- 12.1.5.1. Company Overview
- 12.1.5.2. Products
- 12.1.5.3. Company Financials
- 12.1.5.4. SWOT Analysis
- 12.1.1 Lenovo
- 12.2. Market Entropy
- 12.2.1 Company's Key Areas Served
- 12.2.2 Recent Developments
- 12.3. Company Market Share Analysis 2025
- 12.3.1 Top 5 Companies Market Share Analysis
- 12.3.2 Top 3 Companies Market Share Analysis
- 12.4. List of Potential Customers
- 13. Research Methodology
List of Figures
- Figure 1: Global Artificial Intelligence PCs Revenue Breakdown (billion, %) by Region 2025 & 2033
- Figure 2: Global Artificial Intelligence PCs Volume Breakdown (K, %) by Region 2025 & 2033
- Figure 3: North America Artificial Intelligence PCs Revenue (billion), by Application 2025 & 2033
- Figure 4: North America Artificial Intelligence PCs Volume (K), by Application 2025 & 2033
- Figure 5: North America Artificial Intelligence PCs Revenue Share (%), by Application 2025 & 2033
- Figure 6: North America Artificial Intelligence PCs Volume Share (%), by Application 2025 & 2033
- Figure 7: North America Artificial Intelligence PCs Revenue (billion), by Types 2025 & 2033
- Figure 8: North America Artificial Intelligence PCs Volume (K), by Types 2025 & 2033
- Figure 9: North America Artificial Intelligence PCs Revenue Share (%), by Types 2025 & 2033
- Figure 10: North America Artificial Intelligence PCs Volume Share (%), by Types 2025 & 2033
- Figure 11: North America Artificial Intelligence PCs Revenue (billion), by Country 2025 & 2033
- Figure 12: North America Artificial Intelligence PCs Volume (K), by Country 2025 & 2033
- Figure 13: North America Artificial Intelligence PCs Revenue Share (%), by Country 2025 & 2033
- Figure 14: North America Artificial Intelligence PCs Volume Share (%), by Country 2025 & 2033
- Figure 15: South America Artificial Intelligence PCs Revenue (billion), by Application 2025 & 2033
- Figure 16: South America Artificial Intelligence PCs Volume (K), by Application 2025 & 2033
- Figure 17: South America Artificial Intelligence PCs Revenue Share (%), by Application 2025 & 2033
- Figure 18: South America Artificial Intelligence PCs Volume Share (%), by Application 2025 & 2033
- Figure 19: South America Artificial Intelligence PCs Revenue (billion), by Types 2025 & 2033
- Figure 20: South America Artificial Intelligence PCs Volume (K), by Types 2025 & 2033
- Figure 21: South America Artificial Intelligence PCs Revenue Share (%), by Types 2025 & 2033
- Figure 22: South America Artificial Intelligence PCs Volume Share (%), by Types 2025 & 2033
- Figure 23: South America Artificial Intelligence PCs Revenue (billion), by Country 2025 & 2033
- Figure 24: South America Artificial Intelligence PCs Volume (K), by Country 2025 & 2033
- Figure 25: South America Artificial Intelligence PCs Revenue Share (%), by Country 2025 & 2033
- Figure 26: South America Artificial Intelligence PCs Volume Share (%), by Country 2025 & 2033
- Figure 27: Europe Artificial Intelligence PCs Revenue (billion), by Application 2025 & 2033
- Figure 28: Europe Artificial Intelligence PCs Volume (K), by Application 2025 & 2033
- Figure 29: Europe Artificial Intelligence PCs Revenue Share (%), by Application 2025 & 2033
- Figure 30: Europe Artificial Intelligence PCs Volume Share (%), by Application 2025 & 2033
- Figure 31: Europe Artificial Intelligence PCs Revenue (billion), by Types 2025 & 2033
- Figure 32: Europe Artificial Intelligence PCs Volume (K), by Types 2025 & 2033
- Figure 33: Europe Artificial Intelligence PCs Revenue Share (%), by Types 2025 & 2033
- Figure 34: Europe Artificial Intelligence PCs Volume Share (%), by Types 2025 & 2033
- Figure 35: Europe Artificial Intelligence PCs Revenue (billion), by Country 2025 & 2033
- Figure 36: Europe Artificial Intelligence PCs Volume (K), by Country 2025 & 2033
- Figure 37: Europe Artificial Intelligence PCs Revenue Share (%), by Country 2025 & 2033
- Figure 38: Europe Artificial Intelligence PCs Volume Share (%), by Country 2025 & 2033
- Figure 39: Middle East & Africa Artificial Intelligence PCs Revenue (billion), by Application 2025 & 2033
- Figure 40: Middle East & Africa Artificial Intelligence PCs Volume (K), by Application 2025 & 2033
- Figure 41: Middle East & Africa Artificial Intelligence PCs Revenue Share (%), by Application 2025 & 2033
- Figure 42: Middle East & Africa Artificial Intelligence PCs Volume Share (%), by Application 2025 & 2033
- Figure 43: Middle East & Africa Artificial Intelligence PCs Revenue (billion), by Types 2025 & 2033
- Figure 44: Middle East & Africa Artificial Intelligence PCs Volume (K), by Types 2025 & 2033
- Figure 45: Middle East & Africa Artificial Intelligence PCs Revenue Share (%), by Types 2025 & 2033
- Figure 46: Middle East & Africa Artificial Intelligence PCs Volume Share (%), by Types 2025 & 2033
- Figure 47: Middle East & Africa Artificial Intelligence PCs Revenue (billion), by Country 2025 & 2033
- Figure 48: Middle East & Africa Artificial Intelligence PCs Volume (K), by Country 2025 & 2033
- Figure 49: Middle East & Africa Artificial Intelligence PCs Revenue Share (%), by Country 2025 & 2033
- Figure 50: Middle East & Africa Artificial Intelligence PCs Volume Share (%), by Country 2025 & 2033
- Figure 51: Asia Pacific Artificial Intelligence PCs Revenue (billion), by Application 2025 & 2033
- Figure 52: Asia Pacific Artificial Intelligence PCs Volume (K), by Application 2025 & 2033
- Figure 53: Asia Pacific Artificial Intelligence PCs Revenue Share (%), by Application 2025 & 2033
- Figure 54: Asia Pacific Artificial Intelligence PCs Volume Share (%), by Application 2025 & 2033
- Figure 55: Asia Pacific Artificial Intelligence PCs Revenue (billion), by Types 2025 & 2033
- Figure 56: Asia Pacific Artificial Intelligence PCs Volume (K), by Types 2025 & 2033
- Figure 57: Asia Pacific Artificial Intelligence PCs Revenue Share (%), by Types 2025 & 2033
- Figure 58: Asia Pacific Artificial Intelligence PCs Volume Share (%), by Types 2025 & 2033
- Figure 59: Asia Pacific Artificial Intelligence PCs Revenue (billion), by Country 2025 & 2033
- Figure 60: Asia Pacific Artificial Intelligence PCs Volume (K), by Country 2025 & 2033
- Figure 61: Asia Pacific Artificial Intelligence PCs Revenue Share (%), by Country 2025 & 2033
- Figure 62: Asia Pacific Artificial Intelligence PCs Volume Share (%), by Country 2025 & 2033
List of Tables
- Table 1: Global Artificial Intelligence PCs Revenue billion Forecast, by Application 2020 & 2033
- Table 2: Global Artificial Intelligence PCs Volume K Forecast, by Application 2020 & 2033
- Table 3: Global Artificial Intelligence PCs Revenue billion Forecast, by Types 2020 & 2033
- Table 4: Global Artificial Intelligence PCs Volume K Forecast, by Types 2020 & 2033
- Table 5: Global Artificial Intelligence PCs Revenue billion Forecast, by Region 2020 & 2033
- Table 6: Global Artificial Intelligence PCs Volume K Forecast, by Region 2020 & 2033
- Table 7: Global Artificial Intelligence PCs Revenue billion Forecast, by Application 2020 & 2033
- Table 8: Global Artificial Intelligence PCs Volume K Forecast, by Application 2020 & 2033
- Table 9: Global Artificial Intelligence PCs Revenue billion Forecast, by Types 2020 & 2033
- Table 10: Global Artificial Intelligence PCs Volume K Forecast, by Types 2020 & 2033
- Table 11: Global Artificial Intelligence PCs Revenue billion Forecast, by Country 2020 & 2033
- Table 12: Global Artificial Intelligence PCs Volume K Forecast, by Country 2020 & 2033
- Table 13: United States Artificial Intelligence PCs Revenue (billion) Forecast, by Application 2020 & 2033
- Table 14: United States Artificial Intelligence PCs Volume (K) Forecast, by Application 2020 & 2033
- Table 15: Canada Artificial Intelligence PCs Revenue (billion) Forecast, by Application 2020 & 2033
- Table 16: Canada Artificial Intelligence PCs Volume (K) Forecast, by Application 2020 & 2033
- Table 17: Mexico Artificial Intelligence PCs Revenue (billion) Forecast, by Application 2020 & 2033
- Table 18: Mexico Artificial Intelligence PCs Volume (K) Forecast, by Application 2020 & 2033
- Table 19: Global Artificial Intelligence PCs Revenue billion Forecast, by Application 2020 & 2033
- Table 20: Global Artificial Intelligence PCs Volume K Forecast, by Application 2020 & 2033
- Table 21: Global Artificial Intelligence PCs Revenue billion Forecast, by Types 2020 & 2033
- Table 22: Global Artificial Intelligence PCs Volume K Forecast, by Types 2020 & 2033
- Table 23: Global Artificial Intelligence PCs Revenue billion Forecast, by Country 2020 & 2033
- Table 24: Global Artificial Intelligence PCs Volume K Forecast, by Country 2020 & 2033
- Table 25: Brazil Artificial Intelligence PCs Revenue (billion) Forecast, by Application 2020 & 2033
- Table 26: Brazil Artificial Intelligence PCs Volume (K) Forecast, by Application 2020 & 2033
- Table 27: Argentina Artificial Intelligence PCs Revenue (billion) Forecast, by Application 2020 & 2033
- Table 28: Argentina Artificial Intelligence PCs Volume (K) Forecast, by Application 2020 & 2033
- Table 29: Rest of South America Artificial Intelligence PCs Revenue (billion) Forecast, by Application 2020 & 2033
- Table 30: Rest of South America Artificial Intelligence PCs Volume (K) Forecast, by Application 2020 & 2033
- Table 31: Global Artificial Intelligence PCs Revenue billion Forecast, by Application 2020 & 2033
- Table 32: Global Artificial Intelligence PCs Volume K Forecast, by Application 2020 & 2033
- Table 33: Global Artificial Intelligence PCs Revenue billion Forecast, by Types 2020 & 2033
- Table 34: Global Artificial Intelligence PCs Volume K Forecast, by Types 2020 & 2033
- Table 35: Global Artificial Intelligence PCs Revenue billion Forecast, by Country 2020 & 2033
- Table 36: Global Artificial Intelligence PCs Volume K Forecast, by Country 2020 & 2033
- Table 37: United Kingdom Artificial Intelligence PCs Revenue (billion) Forecast, by Application 2020 & 2033
- Table 38: United Kingdom Artificial Intelligence PCs Volume (K) Forecast, by Application 2020 & 2033
- Table 39: Germany Artificial Intelligence PCs Revenue (billion) Forecast, by Application 2020 & 2033
- Table 40: Germany Artificial Intelligence PCs Volume (K) Forecast, by Application 2020 & 2033
- Table 41: France Artificial Intelligence PCs Revenue (billion) Forecast, by Application 2020 & 2033
- Table 42: France Artificial Intelligence PCs Volume (K) Forecast, by Application 2020 & 2033
- Table 43: Italy Artificial Intelligence PCs Revenue (billion) Forecast, by Application 2020 & 2033
- Table 44: Italy Artificial Intelligence PCs Volume (K) Forecast, by Application 2020 & 2033
- Table 45: Spain Artificial Intelligence PCs Revenue (billion) Forecast, by Application 2020 & 2033
- Table 46: Spain Artificial Intelligence PCs Volume (K) Forecast, by Application 2020 & 2033
- Table 47: Russia Artificial Intelligence PCs Revenue (billion) Forecast, by Application 2020 & 2033
- Table 48: Russia Artificial Intelligence PCs Volume (K) Forecast, by Application 2020 & 2033
- Table 49: Benelux Artificial Intelligence PCs Revenue (billion) Forecast, by Application 2020 & 2033
- Table 50: Benelux Artificial Intelligence PCs Volume (K) Forecast, by Application 2020 & 2033
- Table 51: Nordics Artificial Intelligence PCs Revenue (billion) Forecast, by Application 2020 & 2033
- Table 52: Nordics Artificial Intelligence PCs Volume (K) Forecast, by Application 2020 & 2033
- Table 53: Rest of Europe Artificial Intelligence PCs Revenue (billion) Forecast, by Application 2020 & 2033
- Table 54: Rest of Europe Artificial Intelligence PCs Volume (K) Forecast, by Application 2020 & 2033
- Table 55: Global Artificial Intelligence PCs Revenue billion Forecast, by Application 2020 & 2033
- Table 56: Global Artificial Intelligence PCs Volume K Forecast, by Application 2020 & 2033
- Table 57: Global Artificial Intelligence PCs Revenue billion Forecast, by Types 2020 & 2033
- Table 58: Global Artificial Intelligence PCs Volume K Forecast, by Types 2020 & 2033
- Table 59: Global Artificial Intelligence PCs Revenue billion Forecast, by Country 2020 & 2033
- Table 60: Global Artificial Intelligence PCs Volume K Forecast, by Country 2020 & 2033
- Table 61: Turkey Artificial Intelligence PCs Revenue (billion) Forecast, by Application 2020 & 2033
- Table 62: Turkey Artificial Intelligence PCs Volume (K) Forecast, by Application 2020 & 2033
- Table 63: Israel Artificial Intelligence PCs Revenue (billion) Forecast, by Application 2020 & 2033
- Table 64: Israel Artificial Intelligence PCs Volume (K) Forecast, by Application 2020 & 2033
- Table 65: GCC Artificial Intelligence PCs Revenue (billion) Forecast, by Application 2020 & 2033
- Table 66: GCC Artificial Intelligence PCs Volume (K) Forecast, by Application 2020 & 2033
- Table 67: North Africa Artificial Intelligence PCs Revenue (billion) Forecast, by Application 2020 & 2033
- Table 68: North Africa Artificial Intelligence PCs Volume (K) Forecast, by Application 2020 & 2033
- Table 69: South Africa Artificial Intelligence PCs Revenue (billion) Forecast, by Application 2020 & 2033
- Table 70: South Africa Artificial Intelligence PCs Volume (K) Forecast, by Application 2020 & 2033
- Table 71: Rest of Middle East & Africa Artificial Intelligence PCs Revenue (billion) Forecast, by Application 2020 & 2033
- Table 72: Rest of Middle East & Africa Artificial Intelligence PCs Volume (K) Forecast, by Application 2020 & 2033
- Table 73: Global Artificial Intelligence PCs Revenue billion Forecast, by Application 2020 & 2033
- Table 74: Global Artificial Intelligence PCs Volume K Forecast, by Application 2020 & 2033
- Table 75: Global Artificial Intelligence PCs Revenue billion Forecast, by Types 2020 & 2033
- Table 76: Global Artificial Intelligence PCs Volume K Forecast, by Types 2020 & 2033
- Table 77: Global Artificial Intelligence PCs Revenue billion Forecast, by Country 2020 & 2033
- Table 78: Global Artificial Intelligence PCs Volume K Forecast, by Country 2020 & 2033
- Table 79: China Artificial Intelligence PCs Revenue (billion) Forecast, by Application 2020 & 2033
- Table 80: China Artificial Intelligence PCs Volume (K) Forecast, by Application 2020 & 2033
- Table 81: India Artificial Intelligence PCs Revenue (billion) Forecast, by Application 2020 & 2033
- Table 82: India Artificial Intelligence PCs Volume (K) Forecast, by Application 2020 & 2033
- Table 83: Japan Artificial Intelligence PCs Revenue (billion) Forecast, by Application 2020 & 2033
- Table 84: Japan Artificial Intelligence PCs Volume (K) Forecast, by Application 2020 & 2033
- Table 85: South Korea Artificial Intelligence PCs Revenue (billion) Forecast, by Application 2020 & 2033
- Table 86: South Korea Artificial Intelligence PCs Volume (K) Forecast, by Application 2020 & 2033
- Table 87: ASEAN Artificial Intelligence PCs Revenue (billion) Forecast, by Application 2020 & 2033
- Table 88: ASEAN Artificial Intelligence PCs Volume (K) Forecast, by Application 2020 & 2033
- Table 89: Oceania Artificial Intelligence PCs Revenue (billion) Forecast, by Application 2020 & 2033
- Table 90: Oceania Artificial Intelligence PCs Volume (K) Forecast, by Application 2020 & 2033
- Table 91: Rest of Asia Pacific Artificial Intelligence PCs Revenue (billion) Forecast, by Application 2020 & 2033
- Table 92: Rest of Asia Pacific Artificial Intelligence PCs Volume (K) Forecast, by Application 2020 & 2033
Frequently Asked Questions
1. What is the projected Compound Annual Growth Rate (CAGR) of the Artificial Intelligence PCs?
The projected CAGR is approximately 19.1%.
2. Which companies are prominent players in the Artificial Intelligence PCs?
Key companies in the market include Lenovo, HP, Acer, Dell, ASUS.
3. What are the main segments of the Artificial Intelligence PCs?
The market segments include Application, Types.
4. Can you provide details about the market size?
The market size is estimated to be USD 91.23 billion as of 2022.
5. What are some drivers contributing to market growth?
N/A
6. What are the notable trends driving market growth?
N/A
7. Are there any restraints impacting market growth?
N/A
8. Can you provide examples of recent developments in the market?
N/A
9. What pricing options are available for accessing the report?
Pricing options include single-user, multi-user, and enterprise licenses priced at USD 4350.00, USD 6525.00, and USD 8700.00 respectively.
10. Is the market size provided in terms of value or volume?
The market size is provided in terms of value, measured in billion and volume, measured in K.
11. Are there any specific market keywords associated with the report?
Yes, the market keyword associated with the report is "Artificial Intelligence PCs," which aids in identifying and referencing the specific market segment covered.
12. How do I determine which pricing option suits my needs best?
The pricing options vary based on user requirements and access needs. Individual users may opt for single-user licenses, while businesses requiring broader access may choose multi-user or enterprise licenses for cost-effective access to the report.
13. Are there any additional resources or data provided in the Artificial Intelligence PCs report?
While the report offers comprehensive insights, it's advisable to review the specific contents or supplementary materials provided to ascertain if additional resources or data are available.
14. How can I stay updated on further developments or reports in the Artificial Intelligence PCs?
To stay informed about further developments, trends, and reports in the Artificial Intelligence PCs, consider subscribing to industry newsletters, following relevant companies and organizations, or regularly checking reputable industry news sources and publications.
Methodology
Step 1 - Identification of Relevant Samples Size from Population Database


Step 2 - Approaches for Defining Global Market Size (Value, Volume* & Price*)

Note*: In applicable scenarios
Step 3 - Data Sources
Primary Research
- Web Analytics
- Survey Reports
- Research Institute
- Latest Research Reports
- Opinion Leaders
Secondary Research
- Annual Reports
- White Paper
- Latest Press Release
- Industry Association
- Paid Database
- Investor Presentations

Step 4 - Data Triangulation
Involves using different sources of information in order to increase the validity of a study
These sources are likely to be stakeholders in a program - participants, other researchers, program staff, other community members, and so on.
Then we put all data in single framework & apply various statistical tools to find out the dynamic on the market.
During the analysis stage, feedback from the stakeholder groups would be compared to determine areas of agreement as well as areas of divergence