

Key Insights
The ASEAN e-commerce logistics market, valued at $6.22 billion in 2025, is experiencing robust growth, projected to expand at a Compound Annual Growth Rate (CAGR) of 14.50% from 2025 to 2033. This expansion is fueled by several key drivers. The surge in online shopping across the region, driven by increasing internet and smartphone penetration, coupled with a young and digitally savvy population, is a significant catalyst. Furthermore, the development of robust digital payment infrastructure and government initiatives promoting e-commerce are creating a favorable environment for growth. The rise of cross-border e-commerce, facilitated by improved logistics networks and partnerships between e-commerce platforms and logistics providers, is another major contributor. However, challenges remain, including infrastructure limitations in certain areas, high transportation costs, and the need for enhanced last-mile delivery solutions, particularly in remote regions. The market is segmented by service type (transportation, warehousing, value-added services), business model (B2B, B2C), destination (domestic, international), product category (fashion, electronics, home appliances, etc.), and country (Singapore, Thailand, Vietnam, Indonesia, Malaysia, Philippines, and others). This segmentation offers opportunities for specialized logistics providers to cater to specific niches and optimize their services. Competition is fierce, with established international players like FedEx and DHL vying for market share alongside rapidly growing regional companies such as J&T Express, Ninja Van, and local players.
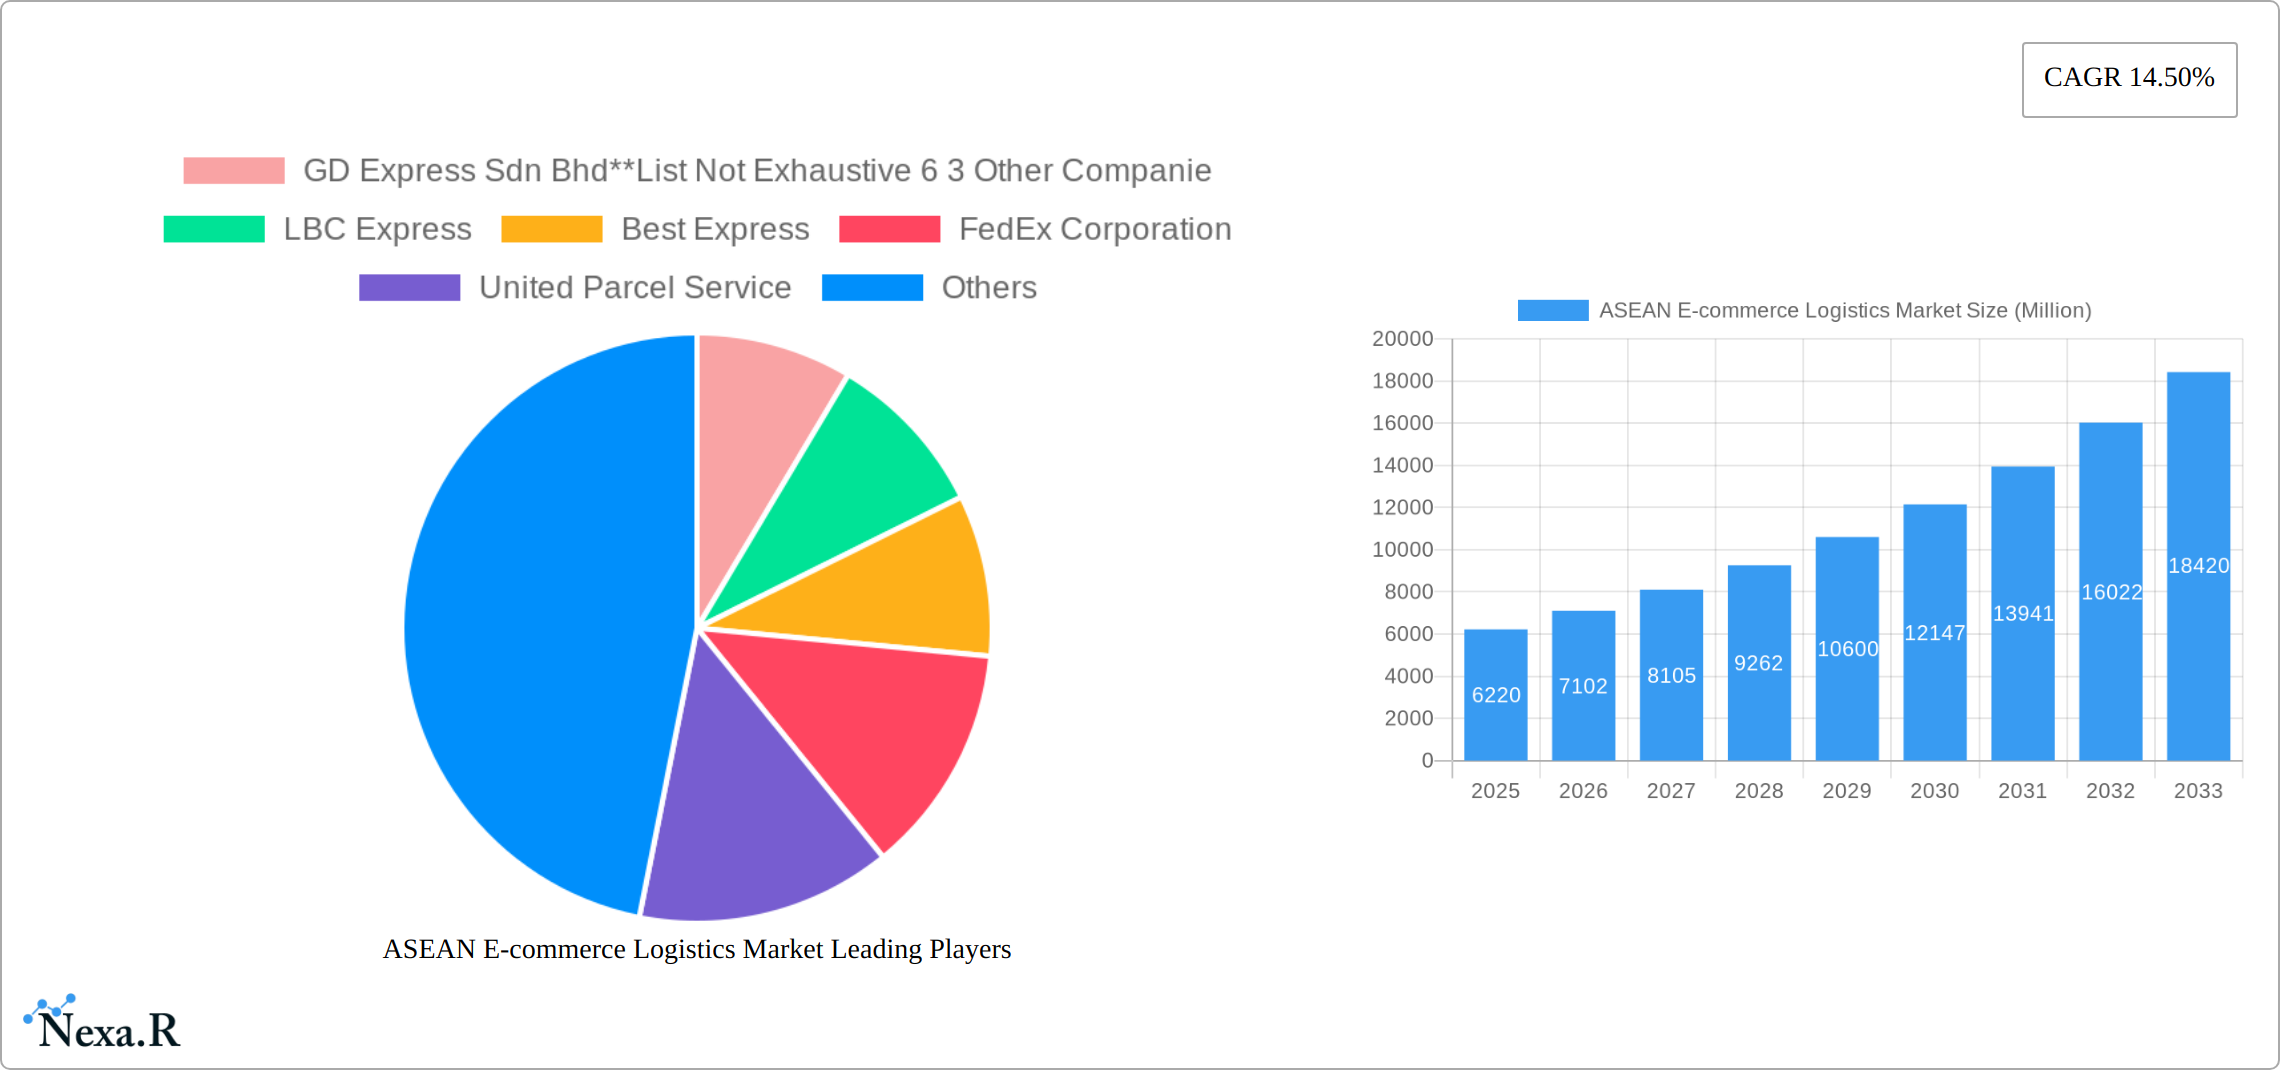
ASEAN E-commerce Logistics Market Market Size (In Billion)
The significant growth trajectory of the ASEAN e-commerce logistics market presents substantial opportunities for investment and expansion. The increasing demand for faster, more reliable, and cost-effective delivery solutions will continue to drive innovation within the sector. This will likely involve the adoption of advanced technologies such as automation, AI-powered route optimization, and drone delivery. Strategies focused on addressing the logistical challenges specific to the ASEAN region, such as improving last-mile delivery efficiency and navigating complex customs regulations, will be crucial for success. The market's diverse segmentation also presents opportunities for companies to focus on specific product categories or customer segments to enhance profitability and build strong market positions. Ultimately, companies that effectively adapt to the evolving demands of e-commerce consumers, leverage technology to streamline operations, and build strong partnerships across the supply chain will be best positioned for growth within this dynamic market.
ASEAN E-commerce Logistics Market Company Market Share
ASEAN E-commerce Logistics Market: A Comprehensive Report (2019-2033)
This comprehensive report provides an in-depth analysis of the ASEAN e-commerce logistics market, encompassing its current state, growth trajectory, and future potential. We delve into market dynamics, key players, emerging trends, and challenges, offering crucial insights for businesses operating within or seeking entry into this rapidly evolving sector. The report covers the period from 2019 to 2033, with a base year of 2025 and a forecast period of 2025-2033. Market values are presented in million units.
ASEAN E-commerce Logistics Market Dynamics & Structure
The ASEAN e-commerce logistics market is characterized by a dynamic interplay of factors influencing its structure and growth. Market concentration is moderate, with several major players and numerous smaller regional operators competing for market share. Technological innovation, driven by automation, AI, and big data analytics, is reshaping operational efficiency and customer experience. Regulatory frameworks across the ASEAN region vary, impacting cross-border logistics and compliance. Competitive substitutes, such as traditional postal services and specialized delivery networks, exert pressure on market pricing and service offerings. The end-user demographic is expanding rapidly, fuelled by increasing internet penetration and smartphone adoption. Mergers and acquisitions (M&A) activity is on the rise, indicating consolidation within the sector.
- Market Concentration: Moderately concentrated, with a few dominant players and many smaller companies.
- Technological Innovation: Significant impact from automation, AI, and data analytics driving efficiency improvements.
- Regulatory Frameworks: Diverse regulations across ASEAN countries impact cross-border operations.
- Competitive Substitutes: Traditional postal services and niche delivery networks pose competitive pressure.
- End-User Demographics: Rapid growth driven by increasing internet and smartphone penetration.
- M&A Activity: Consolidation is occurring through mergers and acquisitions; xx deals recorded between 2019-2024, with an estimated xx deals projected for 2025-2033.
ASEAN E-commerce Logistics Market Growth Trends & Insights
The ASEAN e-commerce logistics market is experiencing explosive growth, fueled by the region's rapidly expanding e-commerce sector. While precise figures for market size require specific data points (replace the xx placeholders below with actual figures), the market's trajectory is undeniable. For example, the market expanded from xx million units in 2019 to xx million units in 2024, registering a CAGR of xx%. This impressive growth is projected to continue, with forecasts suggesting the market will reach xx million units by 2033, exhibiting a CAGR of xx% during the forecast period (2025-2033). This expansion is being driven by several key factors: technological advancements such as last-mile delivery optimization, automated warehousing, and sophisticated logistics software; shifting consumer behavior that increasingly favors online shopping and demands faster, more reliable delivery; and supportive government policies aimed at fostering e-commerce growth across the region. The convergence of these factors creates a powerful engine for continued market expansion.
Dominant Regions, Countries, or Segments in ASEAN E-commerce Logistics Market
Indonesia and Vietnam are currently leading the ASEAN e-commerce logistics market, holding significant market share in 2024 (replace xx placeholders with precise percentages: Indonesia - xx%, Vietnam - xx%). The B2C (Business-to-Consumer) segment remains dominant, accounting for xx% of the market share in 2024, reflecting the surge in online shopping. While domestic delivery still forms the largest portion of the market, the international/cross-border segment is exhibiting exceptionally strong growth potential. Transportation services constitute the largest segment within the logistics market due to high order volumes. Popular product categories driving this growth include fashion and apparel, consumer electronics, and beauty products. However, a more granular analysis of segment performance would provide a more detailed understanding of the market dynamics.
- Key Drivers:
- Robust economic growth and rising disposable incomes across many ASEAN nations.
- Widespread internet penetration and near-universal smartphone adoption.
- Government initiatives and supportive policies promoting e-commerce development.
- A significant shift in consumer preference towards online shopping convenience.
- Ongoing development and improvement of critical logistics infrastructure.
ASEAN E-commerce Logistics Market Product Landscape
The ASEAN e-commerce logistics market offers a diverse range of services, extending from fundamental transportation to sophisticated value-added solutions. This dynamic landscape is characterized by continuous innovation focused on enhancing efficiency, transparency, and overall customer experience. Key innovations include real-time order tracking, optimized delivery networks leveraging advanced route planning, and specialized warehousing solutions designed to meet diverse product handling needs. The relentless pursuit of faster and more reliable delivery is driving intense competition and innovation within the market.
Key Drivers, Barriers & Challenges in ASEAN E-commerce Logistics Market
Key Drivers: Rapid e-commerce growth, rising consumer expectations for fast and convenient delivery, technological advancements in logistics technology, and supportive government policies.
Key Challenges: Inadequate infrastructure in some areas, high transportation costs, varying regulatory frameworks across countries, shortage of skilled workforce, and security concerns related to e-commerce logistics. The impact of these challenges translates into higher costs and delays impacting business operations.
Emerging Opportunities in ASEAN E-commerce Logistics Market
Significant opportunities are emerging across several key areas. Expanding e-commerce into less-developed regions of ASEAN presents a considerable growth avenue. The rapid growth of cross-border e-commerce presents further opportunities, demanding efficient and reliable international shipping solutions. The increasing demand for specialized services such as cold chain logistics (for temperature-sensitive goods) and reverse logistics (handling returns) is creating niche market opportunities. Furthermore, the adoption of cutting-edge technologies such as drones and autonomous delivery vehicles offers the potential for significant efficiency gains and cost reductions.
Growth Accelerators in the ASEAN E-commerce Logistics Market Industry
Several factors will continue to accelerate growth within the ASEAN e-commerce logistics market. These include ongoing technological advancements, strategic partnerships between logistics providers and e-commerce platforms, significant investments in infrastructure development, and the establishment of clear and supportive regulatory frameworks. Expanding into underserved markets and adopting innovative business models will further propel market expansion. The ability of logistics providers to adapt to the ever-evolving needs of the e-commerce sector will be crucial for success.
Key Players Shaping the ASEAN E-commerce Logistics Market Market
- GD Express Sdn Bhd
- LBC Express
- Best Express
- FedEx Corporation
- United Parcel Service
- J&T Express
- PT Global Jet Express (J&T Express)
- Giao Hang Nhanh
- PT Citra Van Titipan Kilat (TIKI)
- PT Jalur Nugraha Ekakurir (JNE Express)
- Deutsche Post DHL Group
- Kerry Express
- Ninja Van
- Flash Express
- Pos Indonesia
- 6 Other Companies
Notable Milestones in ASEAN E-commerce Logistics Market Sector
- 2020: Significant increase in e-commerce activity due to COVID-19 pandemic.
- 2021: Several major logistics companies invest in new technologies.
- 2022: Government initiatives launched to boost e-commerce logistics infrastructure.
- 2023: Several mergers and acquisitions occur within the sector.
- 2024: New regulations implemented to improve cross-border logistics.
In-Depth ASEAN E-commerce Logistics Market Market Outlook
The ASEAN e-commerce logistics market is poised for continued robust growth driven by accelerating e-commerce adoption, technological innovation, and supportive government policies. Strategic partnerships, infrastructure investments, and the expansion of services into underserved regions will unlock significant opportunities for growth and innovation. The market's future trajectory is exceptionally positive, presenting compelling prospects for established and new entrants alike.
ASEAN E-commerce Logistics Market Segmentation
-
1. Service
- 1.1. Transportation
- 1.2. Warehousing and Inventory Management
- 1.3. Value-added Services (Labeling, Packaging, etc.)
-
2. Business
- 2.1. B2B (Business-to-Business)
- 2.2. B2C (Business-to-Consumer)
-
3. Destination
- 3.1. Domestic
- 3.2. International/Cross-border
-
4. Product
- 4.1. Fashion and Apparel
- 4.2. Consumer Electronics
- 4.3. Home Appliances
- 4.4. Furniture
- 4.5. Beauty and Personal Care Products
- 4.6. Other Products (Toys, Food Products, etc.)
ASEAN E-commerce Logistics Market Segmentation By Geography
-
1. North America
- 1.1. United States
- 1.2. Canada
- 1.3. Mexico
-
2. South America
- 2.1. Brazil
- 2.2. Argentina
- 2.3. Rest of South America
-
3. Europe
- 3.1. United Kingdom
- 3.2. Germany
- 3.3. France
- 3.4. Italy
- 3.5. Spain
- 3.6. Russia
- 3.7. Benelux
- 3.8. Nordics
- 3.9. Rest of Europe
-
4. Middle East & Africa
- 4.1. Turkey
- 4.2. Israel
- 4.3. GCC
- 4.4. North Africa
- 4.5. South Africa
- 4.6. Rest of Middle East & Africa
-
5. Asia Pacific
- 5.1. China
- 5.2. India
- 5.3. Japan
- 5.4. South Korea
- 5.5. ASEAN
- 5.6. Oceania
- 5.7. Rest of Asia Pacific
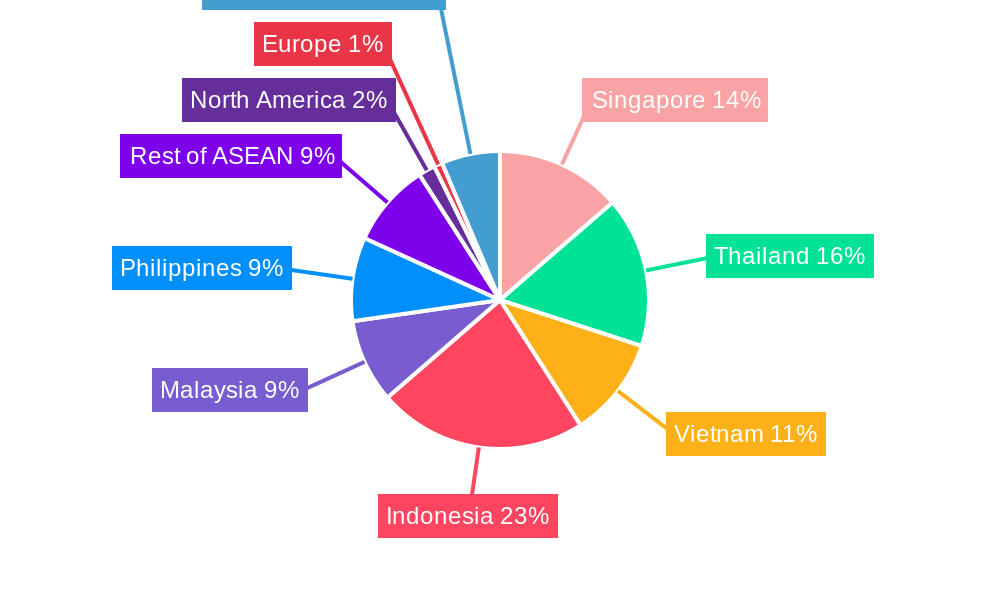
ASEAN E-commerce Logistics Market Regional Market Share
Geographic Coverage of ASEAN E-commerce Logistics Market
ASEAN E-commerce Logistics Market REPORT HIGHLIGHTS
| Aspects | Details |
|---|---|
| Study Period | 2020-2034 |
| Base Year | 2025 |
| Estimated Year | 2026 |
| Forecast Period | 2026-2034 |
| Historical Period | 2020-2025 |
| Growth Rate | CAGR of 14.50% from 2020-2034 |
| Segmentation |
|
Table of Contents
- 1. Introduction
- 1.1. Research Scope
- 1.2. Market Segmentation
- 1.3. Research Objective
- 1.4. Definitions and Assumptions
- 2. Executive Summary
- 2.1. Market Snapshot
- 3. Market Dynamics
- 3.1. Market Drivers
- 3.2. Market Restrains
- 3.3. Market Trends
- 3.4. Market Opportunities
- 4. Market Factor Analysis
- 4.1. Porters Five Forces
- 4.1.1. Bargaining Power of Suppliers
- 4.1.2. Bargaining Power of Buyers
- 4.1.3. Threat of New Entrants
- 4.1.4. Threat of Substitutes
- 4.1.5. Competitive Rivalry
- 4.2. PESTEL analysis
- 4.3. BCG Analysis
- 4.3.1. Stars (High Growth, High Market Share)
- 4.3.2. Cash Cows (Low Growth, High Market Share)
- 4.3.3. Question Mark (High Growth, Low Market Share)
- 4.3.4. Dogs (Low Growth, Low Market Share)
- 4.4. Ansoff Matrix Analysis
- 4.5. Supply Chain Analysis
- 4.6. Regulatory Landscape
- 4.7. Current Market Potential and Opportunity Assessment (TAM–SAM–SOM Framework)
- 4.8. NRP Analyst Note
- 4.1. Porters Five Forces
- 5. Market Analysis, Insights and Forecast 2021-2033
- 5.1. Market Analysis, Insights and Forecast - by Service
- 5.1.1. Transportation
- 5.1.2. Warehousing and Inventory Management
- 5.1.3. Value-added Services (Labeling, Packaging, etc.)
- 5.2. Market Analysis, Insights and Forecast - by Business
- 5.2.1. B2B (Business-to-Business)
- 5.2.2. B2C (Business-to-Consumer)
- 5.3. Market Analysis, Insights and Forecast - by Destination
- 5.3.1. Domestic
- 5.3.2. International/Cross-border
- 5.4. Market Analysis, Insights and Forecast - by Product
- 5.4.1. Fashion and Apparel
- 5.4.2. Consumer Electronics
- 5.4.3. Home Appliances
- 5.4.4. Furniture
- 5.4.5. Beauty and Personal Care Products
- 5.4.6. Other Products (Toys, Food Products, etc.)
- 5.5. Market Analysis, Insights and Forecast - by Region
- 5.5.1. North America
- 5.5.2. South America
- 5.5.3. Europe
- 5.5.4. Middle East & Africa
- 5.5.5. Asia Pacific
- 5.1. Market Analysis, Insights and Forecast - by Service
- 6. Global ASEAN E-commerce Logistics Market Analysis, Insights and Forecast, 2021-2033
- 6.1. Market Analysis, Insights and Forecast - by Service
- 6.1.1. Transportation
- 6.1.2. Warehousing and Inventory Management
- 6.1.3. Value-added Services (Labeling, Packaging, etc.)
- 6.2. Market Analysis, Insights and Forecast - by Business
- 6.2.1. B2B (Business-to-Business)
- 6.2.2. B2C (Business-to-Consumer)
- 6.3. Market Analysis, Insights and Forecast - by Destination
- 6.3.1. Domestic
- 6.3.2. International/Cross-border
- 6.4. Market Analysis, Insights and Forecast - by Product
- 6.4.1. Fashion and Apparel
- 6.4.2. Consumer Electronics
- 6.4.3. Home Appliances
- 6.4.4. Furniture
- 6.4.5. Beauty and Personal Care Products
- 6.4.6. Other Products (Toys, Food Products, etc.)
- 6.1. Market Analysis, Insights and Forecast - by Service
- 7. North America ASEAN E-commerce Logistics Market Analysis, Insights and Forecast, 2020-2032
- 7.1. Market Analysis, Insights and Forecast - by Service
- 7.1.1. Transportation
- 7.1.2. Warehousing and Inventory Management
- 7.1.3. Value-added Services (Labeling, Packaging, etc.)
- 7.2. Market Analysis, Insights and Forecast - by Business
- 7.2.1. B2B (Business-to-Business)
- 7.2.2. B2C (Business-to-Consumer)
- 7.3. Market Analysis, Insights and Forecast - by Destination
- 7.3.1. Domestic
- 7.3.2. International/Cross-border
- 7.4. Market Analysis, Insights and Forecast - by Product
- 7.4.1. Fashion and Apparel
- 7.4.2. Consumer Electronics
- 7.4.3. Home Appliances
- 7.4.4. Furniture
- 7.4.5. Beauty and Personal Care Products
- 7.4.6. Other Products (Toys, Food Products, etc.)
- 7.1. Market Analysis, Insights and Forecast - by Service
- 8. South America ASEAN E-commerce Logistics Market Analysis, Insights and Forecast, 2020-2032
- 8.1. Market Analysis, Insights and Forecast - by Service
- 8.1.1. Transportation
- 8.1.2. Warehousing and Inventory Management
- 8.1.3. Value-added Services (Labeling, Packaging, etc.)
- 8.2. Market Analysis, Insights and Forecast - by Business
- 8.2.1. B2B (Business-to-Business)
- 8.2.2. B2C (Business-to-Consumer)
- 8.3. Market Analysis, Insights and Forecast - by Destination
- 8.3.1. Domestic
- 8.3.2. International/Cross-border
- 8.4. Market Analysis, Insights and Forecast - by Product
- 8.4.1. Fashion and Apparel
- 8.4.2. Consumer Electronics
- 8.4.3. Home Appliances
- 8.4.4. Furniture
- 8.4.5. Beauty and Personal Care Products
- 8.4.6. Other Products (Toys, Food Products, etc.)
- 8.1. Market Analysis, Insights and Forecast - by Service
- 9. Europe ASEAN E-commerce Logistics Market Analysis, Insights and Forecast, 2020-2032
- 9.1. Market Analysis, Insights and Forecast - by Service
- 9.1.1. Transportation
- 9.1.2. Warehousing and Inventory Management
- 9.1.3. Value-added Services (Labeling, Packaging, etc.)
- 9.2. Market Analysis, Insights and Forecast - by Business
- 9.2.1. B2B (Business-to-Business)
- 9.2.2. B2C (Business-to-Consumer)
- 9.3. Market Analysis, Insights and Forecast - by Destination
- 9.3.1. Domestic
- 9.3.2. International/Cross-border
- 9.4. Market Analysis, Insights and Forecast - by Product
- 9.4.1. Fashion and Apparel
- 9.4.2. Consumer Electronics
- 9.4.3. Home Appliances
- 9.4.4. Furniture
- 9.4.5. Beauty and Personal Care Products
- 9.4.6. Other Products (Toys, Food Products, etc.)
- 9.1. Market Analysis, Insights and Forecast - by Service
- 10. Middle East & Africa ASEAN E-commerce Logistics Market Analysis, Insights and Forecast, 2020-2032
- 10.1. Market Analysis, Insights and Forecast - by Service
- 10.1.1. Transportation
- 10.1.2. Warehousing and Inventory Management
- 10.1.3. Value-added Services (Labeling, Packaging, etc.)
- 10.2. Market Analysis, Insights and Forecast - by Business
- 10.2.1. B2B (Business-to-Business)
- 10.2.2. B2C (Business-to-Consumer)
- 10.3. Market Analysis, Insights and Forecast - by Destination
- 10.3.1. Domestic
- 10.3.2. International/Cross-border
- 10.4. Market Analysis, Insights and Forecast - by Product
- 10.4.1. Fashion and Apparel
- 10.4.2. Consumer Electronics
- 10.4.3. Home Appliances
- 10.4.4. Furniture
- 10.4.5. Beauty and Personal Care Products
- 10.4.6. Other Products (Toys, Food Products, etc.)
- 10.1. Market Analysis, Insights and Forecast - by Service
- 11. Asia Pacific ASEAN E-commerce Logistics Market Analysis, Insights and Forecast, 2020-2032
- 11.1. Market Analysis, Insights and Forecast - by Service
- 11.1.1. Transportation
- 11.1.2. Warehousing and Inventory Management
- 11.1.3. Value-added Services (Labeling, Packaging, etc.)
- 11.2. Market Analysis, Insights and Forecast - by Business
- 11.2.1. B2B (Business-to-Business)
- 11.2.2. B2C (Business-to-Consumer)
- 11.3. Market Analysis, Insights and Forecast - by Destination
- 11.3.1. Domestic
- 11.3.2. International/Cross-border
- 11.4. Market Analysis, Insights and Forecast - by Product
- 11.4.1. Fashion and Apparel
- 11.4.2. Consumer Electronics
- 11.4.3. Home Appliances
- 11.4.4. Furniture
- 11.4.5. Beauty and Personal Care Products
- 11.4.6. Other Products (Toys, Food Products, etc.)
- 11.1. Market Analysis, Insights and Forecast - by Service
- 12. Competitive Analysis
- 12.1. Company Profiles
- 12.1.1 GD Express Sdn Bhd**List Not Exhaustive 6 3 Other Companie
- 12.1.1.1. Company Overview
- 12.1.1.2. Products
- 12.1.1.3. Company Financials
- 12.1.1.4. SWOT Analysis
- 12.1.2 LBC Express
- 12.1.2.1. Company Overview
- 12.1.2.2. Products
- 12.1.2.3. Company Financials
- 12.1.2.4. SWOT Analysis
- 12.1.3 Best Express
- 12.1.3.1. Company Overview
- 12.1.3.2. Products
- 12.1.3.3. Company Financials
- 12.1.3.4. SWOT Analysis
- 12.1.4 FedEx Corporation
- 12.1.4.1. Company Overview
- 12.1.4.2. Products
- 12.1.4.3. Company Financials
- 12.1.4.4. SWOT Analysis
- 12.1.5 United Parcel Service
- 12.1.5.1. Company Overview
- 12.1.5.2. Products
- 12.1.5.3. Company Financials
- 12.1.5.4. SWOT Analysis
- 12.1.6 J&T Express
- 12.1.6.1. Company Overview
- 12.1.6.2. Products
- 12.1.6.3. Company Financials
- 12.1.6.4. SWOT Analysis
- 12.1.7 PT Global Jet Express (J&T Express)
- 12.1.7.1. Company Overview
- 12.1.7.2. Products
- 12.1.7.3. Company Financials
- 12.1.7.4. SWOT Analysis
- 12.1.8 Giao Hang Nhanh
- 12.1.8.1. Company Overview
- 12.1.8.2. Products
- 12.1.8.3. Company Financials
- 12.1.8.4. SWOT Analysis
- 12.1.9 PT Citra Van Titipan Kilat (TIKI)
- 12.1.9.1. Company Overview
- 12.1.9.2. Products
- 12.1.9.3. Company Financials
- 12.1.9.4. SWOT Analysis
- 12.1.10 PT Jalur Nugraha Ekakurir (JNE Express)
- 12.1.10.1. Company Overview
- 12.1.10.2. Products
- 12.1.10.3. Company Financials
- 12.1.10.4. SWOT Analysis
- 12.1.11 Deutsche Post DHL Group
- 12.1.11.1. Company Overview
- 12.1.11.2. Products
- 12.1.11.3. Company Financials
- 12.1.11.4. SWOT Analysis
- 12.1.12 Kerry Express
- 12.1.12.1. Company Overview
- 12.1.12.2. Products
- 12.1.12.3. Company Financials
- 12.1.12.4. SWOT Analysis
- 12.1.13 Ninja Van
- 12.1.13.1. Company Overview
- 12.1.13.2. Products
- 12.1.13.3. Company Financials
- 12.1.13.4. SWOT Analysis
- 12.1.14 Flash Express
- 12.1.14.1. Company Overview
- 12.1.14.2. Products
- 12.1.14.3. Company Financials
- 12.1.14.4. SWOT Analysis
- 12.1.15 Pos Indonesia
- 12.1.15.1. Company Overview
- 12.1.15.2. Products
- 12.1.15.3. Company Financials
- 12.1.15.4. SWOT Analysis
- 12.1.1 GD Express Sdn Bhd**List Not Exhaustive 6 3 Other Companie
- 12.2. Market Entropy
- 12.2.1 Company's Key Areas Served
- 12.2.2 Recent Developments
- 12.3. Company Market Share Analysis 2025
- 12.3.1 Top 5 Companies Market Share Analysis
- 12.3.2 Top 3 Companies Market Share Analysis
- 12.4. List of Potential Customers
- 13. Research Methodology
List of Figures
- Figure 1: Global ASEAN E-commerce Logistics Market Revenue Breakdown (Million, %) by Region 2025 & 2033
- Figure 2: North America ASEAN E-commerce Logistics Market Revenue (Million), by Service 2025 & 2033
- Figure 3: North America ASEAN E-commerce Logistics Market Revenue Share (%), by Service 2025 & 2033
- Figure 4: North America ASEAN E-commerce Logistics Market Revenue (Million), by Business 2025 & 2033
- Figure 5: North America ASEAN E-commerce Logistics Market Revenue Share (%), by Business 2025 & 2033
- Figure 6: North America ASEAN E-commerce Logistics Market Revenue (Million), by Destination 2025 & 2033
- Figure 7: North America ASEAN E-commerce Logistics Market Revenue Share (%), by Destination 2025 & 2033
- Figure 8: North America ASEAN E-commerce Logistics Market Revenue (Million), by Product 2025 & 2033
- Figure 9: North America ASEAN E-commerce Logistics Market Revenue Share (%), by Product 2025 & 2033
- Figure 10: North America ASEAN E-commerce Logistics Market Revenue (Million), by Country 2025 & 2033
- Figure 11: North America ASEAN E-commerce Logistics Market Revenue Share (%), by Country 2025 & 2033
- Figure 12: South America ASEAN E-commerce Logistics Market Revenue (Million), by Service 2025 & 2033
- Figure 13: South America ASEAN E-commerce Logistics Market Revenue Share (%), by Service 2025 & 2033
- Figure 14: South America ASEAN E-commerce Logistics Market Revenue (Million), by Business 2025 & 2033
- Figure 15: South America ASEAN E-commerce Logistics Market Revenue Share (%), by Business 2025 & 2033
- Figure 16: South America ASEAN E-commerce Logistics Market Revenue (Million), by Destination 2025 & 2033
- Figure 17: South America ASEAN E-commerce Logistics Market Revenue Share (%), by Destination 2025 & 2033
- Figure 18: South America ASEAN E-commerce Logistics Market Revenue (Million), by Product 2025 & 2033
- Figure 19: South America ASEAN E-commerce Logistics Market Revenue Share (%), by Product 2025 & 2033
- Figure 20: South America ASEAN E-commerce Logistics Market Revenue (Million), by Country 2025 & 2033
- Figure 21: South America ASEAN E-commerce Logistics Market Revenue Share (%), by Country 2025 & 2033
- Figure 22: Europe ASEAN E-commerce Logistics Market Revenue (Million), by Service 2025 & 2033
- Figure 23: Europe ASEAN E-commerce Logistics Market Revenue Share (%), by Service 2025 & 2033
- Figure 24: Europe ASEAN E-commerce Logistics Market Revenue (Million), by Business 2025 & 2033
- Figure 25: Europe ASEAN E-commerce Logistics Market Revenue Share (%), by Business 2025 & 2033
- Figure 26: Europe ASEAN E-commerce Logistics Market Revenue (Million), by Destination 2025 & 2033
- Figure 27: Europe ASEAN E-commerce Logistics Market Revenue Share (%), by Destination 2025 & 2033
- Figure 28: Europe ASEAN E-commerce Logistics Market Revenue (Million), by Product 2025 & 2033
- Figure 29: Europe ASEAN E-commerce Logistics Market Revenue Share (%), by Product 2025 & 2033
- Figure 30: Europe ASEAN E-commerce Logistics Market Revenue (Million), by Country 2025 & 2033
- Figure 31: Europe ASEAN E-commerce Logistics Market Revenue Share (%), by Country 2025 & 2033
- Figure 32: Middle East & Africa ASEAN E-commerce Logistics Market Revenue (Million), by Service 2025 & 2033
- Figure 33: Middle East & Africa ASEAN E-commerce Logistics Market Revenue Share (%), by Service 2025 & 2033
- Figure 34: Middle East & Africa ASEAN E-commerce Logistics Market Revenue (Million), by Business 2025 & 2033
- Figure 35: Middle East & Africa ASEAN E-commerce Logistics Market Revenue Share (%), by Business 2025 & 2033
- Figure 36: Middle East & Africa ASEAN E-commerce Logistics Market Revenue (Million), by Destination 2025 & 2033
- Figure 37: Middle East & Africa ASEAN E-commerce Logistics Market Revenue Share (%), by Destination 2025 & 2033
- Figure 38: Middle East & Africa ASEAN E-commerce Logistics Market Revenue (Million), by Product 2025 & 2033
- Figure 39: Middle East & Africa ASEAN E-commerce Logistics Market Revenue Share (%), by Product 2025 & 2033
- Figure 40: Middle East & Africa ASEAN E-commerce Logistics Market Revenue (Million), by Country 2025 & 2033
- Figure 41: Middle East & Africa ASEAN E-commerce Logistics Market Revenue Share (%), by Country 2025 & 2033
- Figure 42: Asia Pacific ASEAN E-commerce Logistics Market Revenue (Million), by Service 2025 & 2033
- Figure 43: Asia Pacific ASEAN E-commerce Logistics Market Revenue Share (%), by Service 2025 & 2033
- Figure 44: Asia Pacific ASEAN E-commerce Logistics Market Revenue (Million), by Business 2025 & 2033
- Figure 45: Asia Pacific ASEAN E-commerce Logistics Market Revenue Share (%), by Business 2025 & 2033
- Figure 46: Asia Pacific ASEAN E-commerce Logistics Market Revenue (Million), by Destination 2025 & 2033
- Figure 47: Asia Pacific ASEAN E-commerce Logistics Market Revenue Share (%), by Destination 2025 & 2033
- Figure 48: Asia Pacific ASEAN E-commerce Logistics Market Revenue (Million), by Product 2025 & 2033
- Figure 49: Asia Pacific ASEAN E-commerce Logistics Market Revenue Share (%), by Product 2025 & 2033
- Figure 50: Asia Pacific ASEAN E-commerce Logistics Market Revenue (Million), by Country 2025 & 2033
- Figure 51: Asia Pacific ASEAN E-commerce Logistics Market Revenue Share (%), by Country 2025 & 2033
List of Tables
- Table 1: Global ASEAN E-commerce Logistics Market Revenue Million Forecast, by Service 2020 & 2033
- Table 2: Global ASEAN E-commerce Logistics Market Revenue Million Forecast, by Business 2020 & 2033
- Table 3: Global ASEAN E-commerce Logistics Market Revenue Million Forecast, by Destination 2020 & 2033
- Table 4: Global ASEAN E-commerce Logistics Market Revenue Million Forecast, by Product 2020 & 2033
- Table 5: Global ASEAN E-commerce Logistics Market Revenue Million Forecast, by Region 2020 & 2033
- Table 6: Global ASEAN E-commerce Logistics Market Revenue Million Forecast, by Service 2020 & 2033
- Table 7: Global ASEAN E-commerce Logistics Market Revenue Million Forecast, by Business 2020 & 2033
- Table 8: Global ASEAN E-commerce Logistics Market Revenue Million Forecast, by Destination 2020 & 2033
- Table 9: Global ASEAN E-commerce Logistics Market Revenue Million Forecast, by Product 2020 & 2033
- Table 10: Global ASEAN E-commerce Logistics Market Revenue Million Forecast, by Country 2020 & 2033
- Table 11: United States ASEAN E-commerce Logistics Market Revenue (Million) Forecast, by Application 2020 & 2033
- Table 12: Canada ASEAN E-commerce Logistics Market Revenue (Million) Forecast, by Application 2020 & 2033
- Table 13: Mexico ASEAN E-commerce Logistics Market Revenue (Million) Forecast, by Application 2020 & 2033
- Table 14: Global ASEAN E-commerce Logistics Market Revenue Million Forecast, by Service 2020 & 2033
- Table 15: Global ASEAN E-commerce Logistics Market Revenue Million Forecast, by Business 2020 & 2033
- Table 16: Global ASEAN E-commerce Logistics Market Revenue Million Forecast, by Destination 2020 & 2033
- Table 17: Global ASEAN E-commerce Logistics Market Revenue Million Forecast, by Product 2020 & 2033
- Table 18: Global ASEAN E-commerce Logistics Market Revenue Million Forecast, by Country 2020 & 2033
- Table 19: Brazil ASEAN E-commerce Logistics Market Revenue (Million) Forecast, by Application 2020 & 2033
- Table 20: Argentina ASEAN E-commerce Logistics Market Revenue (Million) Forecast, by Application 2020 & 2033
- Table 21: Rest of South America ASEAN E-commerce Logistics Market Revenue (Million) Forecast, by Application 2020 & 2033
- Table 22: Global ASEAN E-commerce Logistics Market Revenue Million Forecast, by Service 2020 & 2033
- Table 23: Global ASEAN E-commerce Logistics Market Revenue Million Forecast, by Business 2020 & 2033
- Table 24: Global ASEAN E-commerce Logistics Market Revenue Million Forecast, by Destination 2020 & 2033
- Table 25: Global ASEAN E-commerce Logistics Market Revenue Million Forecast, by Product 2020 & 2033
- Table 26: Global ASEAN E-commerce Logistics Market Revenue Million Forecast, by Country 2020 & 2033
- Table 27: United Kingdom ASEAN E-commerce Logistics Market Revenue (Million) Forecast, by Application 2020 & 2033
- Table 28: Germany ASEAN E-commerce Logistics Market Revenue (Million) Forecast, by Application 2020 & 2033
- Table 29: France ASEAN E-commerce Logistics Market Revenue (Million) Forecast, by Application 2020 & 2033
- Table 30: Italy ASEAN E-commerce Logistics Market Revenue (Million) Forecast, by Application 2020 & 2033
- Table 31: Spain ASEAN E-commerce Logistics Market Revenue (Million) Forecast, by Application 2020 & 2033
- Table 32: Russia ASEAN E-commerce Logistics Market Revenue (Million) Forecast, by Application 2020 & 2033
- Table 33: Benelux ASEAN E-commerce Logistics Market Revenue (Million) Forecast, by Application 2020 & 2033
- Table 34: Nordics ASEAN E-commerce Logistics Market Revenue (Million) Forecast, by Application 2020 & 2033
- Table 35: Rest of Europe ASEAN E-commerce Logistics Market Revenue (Million) Forecast, by Application 2020 & 2033
- Table 36: Global ASEAN E-commerce Logistics Market Revenue Million Forecast, by Service 2020 & 2033
- Table 37: Global ASEAN E-commerce Logistics Market Revenue Million Forecast, by Business 2020 & 2033
- Table 38: Global ASEAN E-commerce Logistics Market Revenue Million Forecast, by Destination 2020 & 2033
- Table 39: Global ASEAN E-commerce Logistics Market Revenue Million Forecast, by Product 2020 & 2033
- Table 40: Global ASEAN E-commerce Logistics Market Revenue Million Forecast, by Country 2020 & 2033
- Table 41: Turkey ASEAN E-commerce Logistics Market Revenue (Million) Forecast, by Application 2020 & 2033
- Table 42: Israel ASEAN E-commerce Logistics Market Revenue (Million) Forecast, by Application 2020 & 2033
- Table 43: GCC ASEAN E-commerce Logistics Market Revenue (Million) Forecast, by Application 2020 & 2033
- Table 44: North Africa ASEAN E-commerce Logistics Market Revenue (Million) Forecast, by Application 2020 & 2033
- Table 45: South Africa ASEAN E-commerce Logistics Market Revenue (Million) Forecast, by Application 2020 & 2033
- Table 46: Rest of Middle East & Africa ASEAN E-commerce Logistics Market Revenue (Million) Forecast, by Application 2020 & 2033
- Table 47: Global ASEAN E-commerce Logistics Market Revenue Million Forecast, by Service 2020 & 2033
- Table 48: Global ASEAN E-commerce Logistics Market Revenue Million Forecast, by Business 2020 & 2033
- Table 49: Global ASEAN E-commerce Logistics Market Revenue Million Forecast, by Destination 2020 & 2033
- Table 50: Global ASEAN E-commerce Logistics Market Revenue Million Forecast, by Product 2020 & 2033
- Table 51: Global ASEAN E-commerce Logistics Market Revenue Million Forecast, by Country 2020 & 2033
- Table 52: China ASEAN E-commerce Logistics Market Revenue (Million) Forecast, by Application 2020 & 2033
- Table 53: India ASEAN E-commerce Logistics Market Revenue (Million) Forecast, by Application 2020 & 2033
- Table 54: Japan ASEAN E-commerce Logistics Market Revenue (Million) Forecast, by Application 2020 & 2033
- Table 55: South Korea ASEAN E-commerce Logistics Market Revenue (Million) Forecast, by Application 2020 & 2033
- Table 56: ASEAN ASEAN E-commerce Logistics Market Revenue (Million) Forecast, by Application 2020 & 2033
- Table 57: Oceania ASEAN E-commerce Logistics Market Revenue (Million) Forecast, by Application 2020 & 2033
- Table 58: Rest of Asia Pacific ASEAN E-commerce Logistics Market Revenue (Million) Forecast, by Application 2020 & 2033
Frequently Asked Questions
1. What is the projected Compound Annual Growth Rate (CAGR) of the ASEAN E-commerce Logistics Market?
The projected CAGR is approximately 14.50%.
2. Which companies are prominent players in the ASEAN E-commerce Logistics Market?
Key companies in the market include GD Express Sdn Bhd**List Not Exhaustive 6 3 Other Companie, LBC Express, Best Express, FedEx Corporation, United Parcel Service, J&T Express, PT Global Jet Express (J&T Express), Giao Hang Nhanh, PT Citra Van Titipan Kilat (TIKI), PT Jalur Nugraha Ekakurir (JNE Express), Deutsche Post DHL Group, Kerry Express, Ninja Van, Flash Express, Pos Indonesia.
3. What are the main segments of the ASEAN E-commerce Logistics Market?
The market segments include Service, Business, Destination, Product.
4. Can you provide details about the market size?
The market size is estimated to be USD 6.22 Million as of 2022.
5. What are some drivers contributing to market growth?
4.; Growing E-commerce Sector.
6. What are the notable trends driving market growth?
E-commerce growth is driving the market.
7. Are there any restraints impacting market growth?
4.; Complicated Product Returns.
8. Can you provide examples of recent developments in the market?
N/A
9. What pricing options are available for accessing the report?
Pricing options include single-user, multi-user, and enterprise licenses priced at USD 3800, USD 4500, and USD 5800 respectively.
10. Is the market size provided in terms of value or volume?
The market size is provided in terms of value, measured in Million.
11. Are there any specific market keywords associated with the report?
Yes, the market keyword associated with the report is "ASEAN E-commerce Logistics Market," which aids in identifying and referencing the specific market segment covered.
12. How do I determine which pricing option suits my needs best?
The pricing options vary based on user requirements and access needs. Individual users may opt for single-user licenses, while businesses requiring broader access may choose multi-user or enterprise licenses for cost-effective access to the report.
13. Are there any additional resources or data provided in the ASEAN E-commerce Logistics Market report?
While the report offers comprehensive insights, it's advisable to review the specific contents or supplementary materials provided to ascertain if additional resources or data are available.
14. How can I stay updated on further developments or reports in the ASEAN E-commerce Logistics Market?
To stay informed about further developments, trends, and reports in the ASEAN E-commerce Logistics Market, consider subscribing to industry newsletters, following relevant companies and organizations, or regularly checking reputable industry news sources and publications.
Methodology
Step 1 - Identification of Relevant Samples Size from Population Database


Step 2 - Approaches for Defining Global Market Size (Value, Volume* & Price*)

Note*: In applicable scenarios
Step 3 - Data Sources
Primary Research
- Web Analytics
- Survey Reports
- Research Institute
- Latest Research Reports
- Opinion Leaders
Secondary Research
- Annual Reports
- White Paper
- Latest Press Release
- Industry Association
- Paid Database
- Investor Presentations

Step 4 - Data Triangulation
Involves using different sources of information in order to increase the validity of a study
These sources are likely to be stakeholders in a program - participants, other researchers, program staff, other community members, and so on.
Then we put all data in single framework & apply various statistical tools to find out the dynamic on the market.
During the analysis stage, feedback from the stakeholder groups would be compared to determine areas of agreement as well as areas of divergence