

Key Insights
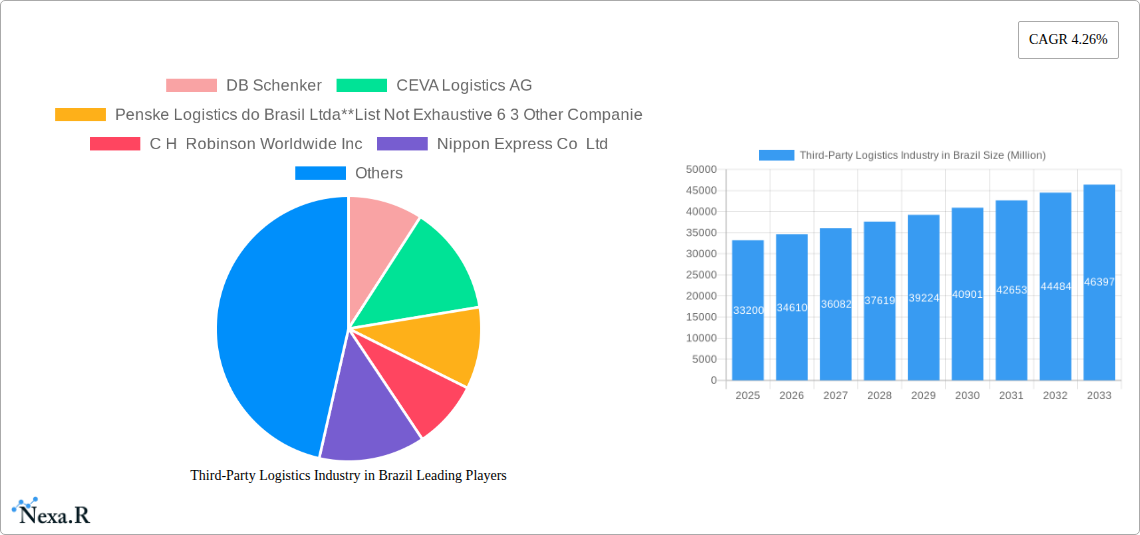
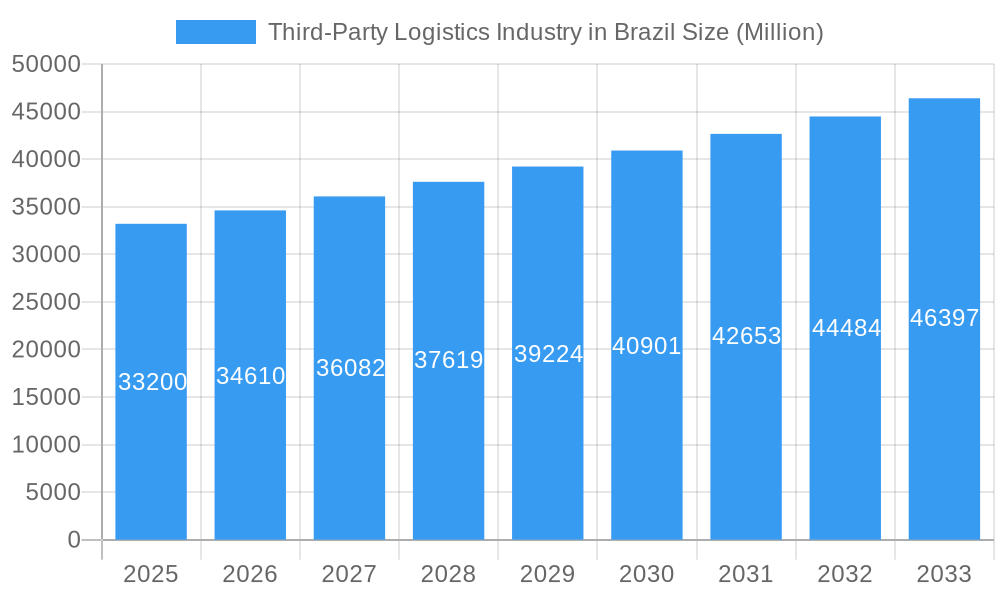
The Brazilian Third-Party Logistics (3PL) market is poised for robust expansion, with a projected market size of USD 33.20 billion in 2025 and a steady Compound Annual Growth Rate (CAGR) of 4.26% anticipated through 2033. This sustained growth is underpinned by several critical drivers, including the increasing adoption of advanced logistics technologies, a growing demand for specialized supply chain solutions, and the continuous need for optimized transportation and warehousing services. The Brazilian economy’s reliance on efficient movement of goods across its vast geographical expanse fuels the demand for integrated logistics offerings. Key trends such as the rise of e-commerce, necessitating faster and more flexible delivery networks, and the growing emphasis on sustainability within supply chains, are further shaping the market landscape. Companies are increasingly outsourcing their logistics operations to third-party providers to gain operational efficiencies, reduce costs, and focus on their core competencies. This strategic shift is a significant growth enabler for the 3PL sector.
Third-Party Logistics Industry in Brazil Market Size (In Billion)
However, the market also faces certain restraints that could temper its growth trajectory. These include the complexities of Brazil's regulatory environment, infrastructure challenges in certain regions, and potential fluctuations in economic conditions. Despite these hurdles, the inherent demand for streamlined logistics operations, particularly within burgeoning sectors like e-commerce, automotive, and consumer goods, ensures a positive outlook. The market is segmented into key services such as Domestic Transportation Management and International Transportation Management, complemented by Value-added Warehousing and Distribution. Prominent end-user industries driving this demand include Automobile, Chemicals, Consumer and Retail, Energy, Engineering and Manufacturing, and Life Science and Healthcare. Leading players like DB Schenker, CEVA Logistics AG, C.H. Robinson Worldwide Inc., and Kuehne + Nagel International AG are actively investing in expanding their capabilities and geographical reach within Brazil, indicating strong investor confidence and competitive dynamics within the industry.
Third-Party Logistics Industry in Brazil Company Market Share
This in-depth report provides an exhaustive analysis of the Third-Party Logistics (3PL) Industry in Brazil, offering critical insights into market dynamics, growth trajectories, and competitive landscapes. Designed for industry leaders, investors, and strategic planners, this report leverages high-traffic keywords like "Brazil logistics," "3PL market Brazil," and "supply chain Brazil" to ensure maximum search engine visibility and engagement. We delve into the intricate parent and child market structures, presenting all monetary values in millions of units for clarity and immediate application. Our comprehensive coverage spans from the historical period (2019–2024) through the base year (2025) and into a robust forecast period (2025–2033), providing a complete view of market evolution.
Third-Party Logistics Industry in Brazil Market Dynamics & Structure
The Third-Party Logistics (3PL) Industry in Brazil exhibits a dynamic market concentration, with a blend of established global players and robust local operators. Technological innovation is a significant driver, pushing for greater efficiency in areas such as route optimization, warehouse automation, and real-time tracking. Regulatory frameworks, while sometimes complex, are evolving to support growth and integration. Competitive product substitutes, primarily in-house logistics operations, are gradually yielding to the compelling cost-effectiveness and expertise offered by 3PL providers. End-user demographics play a crucial role, with sectors like Automobile, Consumer and Retail, and Life Science and Healthcare demonstrating substantial demand for specialized logistics solutions. Mergers & Acquisitions (M&A) trends indicate a consolidating market, with strategic acquisitions aimed at expanding service portfolios and geographical reach.
- Market Concentration: Dominated by a few key global players and a growing number of specialized domestic providers.
- Technological Innovation Drivers: Focus on digitalization, AI-powered analytics, IoT for enhanced visibility, and automation in warehousing.
- Regulatory Frameworks: Impact of evolving customs regulations, trade agreements, and infrastructure development policies.
- Competitive Product Substitutes: Analysis of the shift from in-house logistics to outsourcing for cost savings and efficiency.
- End-User Demographics: High growth in demand from e-commerce, automotive supply chains, and the pharmaceutical sector.
- M&A Trends: Increasing consolidation, driven by the need for scale, broader service offerings, and market access.
Third-Party Logistics Industry in Brazil Growth Trends & Insights
The Third-Party Logistics (3PL) Industry in Brazil is poised for substantial expansion, with market size evolution driven by increasing trade volumes, the burgeoning e-commerce sector, and the growing complexity of supply chains. Adoption rates for advanced logistics technologies are accelerating, with businesses increasingly recognizing the strategic advantages of outsourcing their logistics functions. Technological disruptions, such as the integration of artificial intelligence for predictive analytics and the use of blockchain for enhanced transparency, are reshaping operational efficiencies. Consumer behavior shifts, particularly the demand for faster delivery times and more flexible shipping options, are compelling logistics providers to innovate and adapt. The market penetration of 3PL services is projected to increase significantly over the forecast period. With a projected CAGR of XX%, the market is expected to reach an estimated value of $XXX million by 2033. This growth is underpinned by investments in infrastructure and a more favorable business environment.
Dominant Regions, Countries, or Segments in Third-Party Logistics Industry in Brazil
Within the Third-Party Logistics (3PL) Industry in Brazil, Domestic Transportation Management emerges as the dominant segment, driven by the vast geographical expanse of the country and the burgeoning internal market. The Automobile sector, a cornerstone of the Brazilian economy, is a primary end-user, demanding sophisticated just-in-time delivery and complex supply chain management. Furthermore, the Consumer and Retail segment, significantly boosted by the rapid growth of e-commerce, is a major contributor to the demand for efficient warehousing and last-mile delivery solutions. Economic policies promoting industrial growth and infrastructure development, particularly in key logistical hubs, are key drivers of regional dominance. Market share within this segment is substantial, with key players capturing significant portions of the transportation and warehousing business.
- Dominant Services:
- Domestic Transportation Management: Driven by internal trade and vast distances.
- Value-added Warehousing and Distribution: Essential for e-commerce and just-in-time manufacturing.
- Leading End Users:
- Automobile: Complex supply chain needs, just-in-time delivery.
- Consumer and Retail: E-commerce growth, last-mile delivery demands.
- Life Science and Healthcare: Specialized handling and temperature-controlled logistics.
- Key Drivers of Dominance:
- Favorable economic policies supporting trade and manufacturing.
- Strategic investments in transportation infrastructure.
- Growing consumer demand for efficient and rapid delivery.
- Increasing adoption of outsourced logistics solutions across industries.
Third-Party Logistics Industry in Brazil Product Landscape
The product landscape in the Third-Party Logistics (3PL) Industry in Brazil is characterized by a strong emphasis on integrated technology solutions and specialized service offerings. Innovations include advanced Transportation Management Systems (TMS) and Warehouse Management Systems (WMS) with real-time tracking, predictive analytics for demand forecasting, and route optimization algorithms. Unique selling propositions often lie in customized solutions tailored to specific industry needs, such as temperature-controlled logistics for pharmaceuticals or specialized handling for oversized industrial equipment. Technological advancements are enabling greater supply chain visibility, reduced transit times, and improved inventory management, leading to enhanced performance metrics for clients.
Key Drivers, Barriers & Challenges in Third-Party Logistics Industry in Brazil
Key Drivers: The Third-Party Logistics (3PL) Industry in Brazil is propelled by several key forces. The expanding e-commerce market, with its inherent demand for efficient fulfillment and last-mile delivery, is a primary growth accelerator. Government initiatives promoting infrastructure development, such as improved road networks and port modernization, directly enhance logistics capabilities. Economic growth and increasing foreign investment further stimulate trade and, consequently, the demand for 3PL services. Technological advancements in areas like automation and data analytics are enabling more efficient and cost-effective operations.
Barriers & Challenges: Despite the growth potential, the industry faces significant challenges. The vast geographical distances and often underdeveloped infrastructure in certain regions can lead to higher transportation costs and longer lead times. Regulatory complexities and bureaucratic hurdles can impede operational efficiency. Security concerns, including cargo theft, remain a persistent issue. Furthermore, the availability of skilled labor, particularly in specialized logistics roles, can be a constraint. Fierce competition among providers, while beneficial for clients, can put pressure on profit margins, particularly for smaller players. The estimated impact of these challenges on market growth is projected to be XX% in terms of reduced efficiency.
Emerging Opportunities in Third-Party Logistics Industry in Brazil
Emerging opportunities within the Third-Party Logistics (3PL) Industry in Brazil are vast and varied. The increasing adoption of sustainable logistics practices presents a significant untapped market, with demand for eco-friendly transportation and warehousing solutions on the rise. The burgeoning growth of niche e-commerce segments, such as perishables and specialized industrial goods, requires tailored logistics expertise. Furthermore, the integration of advanced technologies like Artificial Intelligence (AI) and the Internet of Things (IoT) for predictive maintenance, real-time inventory management, and enhanced customer service offers substantial opportunities for innovation and service differentiation. The development of multimodal logistics solutions, combining road, rail, and waterways, is also a promising avenue for optimizing costs and transit times.
Growth Accelerators in the Third-Party Logistics Industry in Brazil Industry
Several catalysts are accelerating long-term growth in the Third-Party Logistics (3PL) Industry in Brazil. Technological breakthroughs, including the widespread adoption of AI-powered route optimization and warehouse automation, are significantly enhancing operational efficiency and reducing costs. Strategic partnerships between 3PL providers and technology firms are fostering innovation and the development of cutting-edge logistics solutions. Market expansion strategies, such as entering new geographical regions within Brazil or expanding into neighboring South American countries, are key drivers. Furthermore, the growing trend of supply chain digitization, driven by the need for greater transparency and agility, is creating a strong demand for integrated 3PL services.
Key Players Shaping the Third-Party Logistics Industry in Brazil Market
- DB Schenker
- CEVA Logistics AG
- Penske Logistics do Brasil Ltda
- C H Robinson Worldwide Inc
- Nippon Express Co Ltd
- Kuehne + Nagel International AG
- FedEx
- BBM Logística SA
- DSV AS
- Deutsche Post AG
- Gafor SA
- 6 3 Other Companies
Notable Milestones in Third-Party Logistics Industry in Brazil Sector
- 2019: Increased investment in port infrastructure and expansion of free trade zones.
- 2020: Significant surge in e-commerce logistics demand due to global pandemic, leading to innovation in last-mile delivery.
- 2021: Growing adoption of digital platforms for freight management and visibility.
- 2022: Strategic acquisitions by global 3PL players to strengthen their presence in the Brazilian market.
- 2023: Increased focus on sustainable logistics solutions and green transportation initiatives.
- 2024: Expansion of value-added warehousing services to cater to diverse industry needs.
In-Depth Third-Party Logistics Industry in Brazil Market Outlook
The future outlook for the Third-Party Logistics (3PL) Industry in Brazil is exceptionally promising, driven by ongoing technological advancements and evolving market demands. Growth accelerators such as the continued expansion of e-commerce, coupled with a robust industrial base, will fuel sustained demand for integrated logistics solutions. Strategic opportunities lie in capitalizing on the demand for specialized services in sectors like life sciences and renewable energy. Furthermore, investments in digital transformation and sustainable logistics are not merely trends but essential components for long-term success and market leadership in this dynamic Brazilian landscape.
Third-Party Logistics Industry in Brazil Segmentation
-
1. Services
- 1.1. Domestic Transportation Management
- 1.2. International Transportation Management
- 1.3. Value-added Warehousing and Distribution
-
2. End User
- 2.1. Automobile
- 2.2. Chemicals
- 2.3. Consumer and Retail
- 2.4. Energy
- 2.5. Engineering and Manufacturing
- 2.6. Life Science and Healthcare
- 2.7. Other End User
Third-Party Logistics Industry in Brazil Segmentation By Geography
-
1. North America
- 1.1. United States
- 1.2. Canada
- 1.3. Mexico
-
2. South America
- 2.1. Brazil
- 2.2. Argentina
- 2.3. Rest of South America
-
3. Europe
- 3.1. United Kingdom
- 3.2. Germany
- 3.3. France
- 3.4. Italy
- 3.5. Spain
- 3.6. Russia
- 3.7. Benelux
- 3.8. Nordics
- 3.9. Rest of Europe
-
4. Middle East & Africa
- 4.1. Turkey
- 4.2. Israel
- 4.3. GCC
- 4.4. North Africa
- 4.5. South Africa
- 4.6. Rest of Middle East & Africa
-
5. Asia Pacific
- 5.1. China
- 5.2. India
- 5.3. Japan
- 5.4. South Korea
- 5.5. ASEAN
- 5.6. Oceania
- 5.7. Rest of Asia Pacific
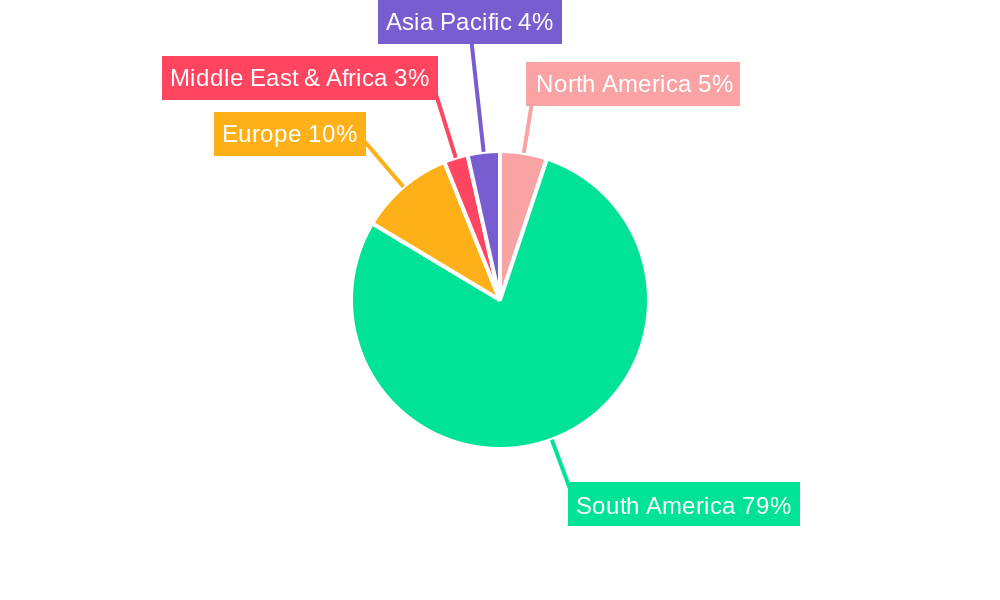
Third-Party Logistics Industry in Brazil Regional Market Share
Geographic Coverage of Third-Party Logistics Industry in Brazil
Third-Party Logistics Industry in Brazil REPORT HIGHLIGHTS
| Aspects | Details |
|---|---|
| Study Period | 2020-2034 |
| Base Year | 2025 |
| Estimated Year | 2026 |
| Forecast Period | 2026-2034 |
| Historical Period | 2020-2025 |
| Growth Rate | CAGR of 4.26% from 2020-2034 |
| Segmentation |
|
Table of Contents
- 1. Introduction
- 1.1. Research Scope
- 1.2. Market Segmentation
- 1.3. Research Objective
- 1.4. Definitions and Assumptions
- 2. Executive Summary
- 2.1. Market Snapshot
- 3. Market Dynamics
- 3.1. Market Drivers
- 3.2. Market Restrains
- 3.3. Market Trends
- 3.4. Market Opportunities
- 4. Market Factor Analysis
- 4.1. Porters Five Forces
- 4.1.1. Bargaining Power of Suppliers
- 4.1.2. Bargaining Power of Buyers
- 4.1.3. Threat of New Entrants
- 4.1.4. Threat of Substitutes
- 4.1.5. Competitive Rivalry
- 4.2. PESTEL analysis
- 4.3. BCG Analysis
- 4.3.1. Stars (High Growth, High Market Share)
- 4.3.2. Cash Cows (Low Growth, High Market Share)
- 4.3.3. Question Mark (High Growth, Low Market Share)
- 4.3.4. Dogs (Low Growth, Low Market Share)
- 4.4. Ansoff Matrix Analysis
- 4.5. Supply Chain Analysis
- 4.6. Regulatory Landscape
- 4.7. Current Market Potential and Opportunity Assessment (TAM–SAM–SOM Framework)
- 4.8. NRP Analyst Note
- 4.1. Porters Five Forces
- 5. Market Analysis, Insights and Forecast 2021-2033
- 5.1. Market Analysis, Insights and Forecast - by Services
- 5.1.1. Domestic Transportation Management
- 5.1.2. International Transportation Management
- 5.1.3. Value-added Warehousing and Distribution
- 5.2. Market Analysis, Insights and Forecast - by End User
- 5.2.1. Automobile
- 5.2.2. Chemicals
- 5.2.3. Consumer and Retail
- 5.2.4. Energy
- 5.2.5. Engineering and Manufacturing
- 5.2.6. Life Science and Healthcare
- 5.2.7. Other End User
- 5.3. Market Analysis, Insights and Forecast - by Region
- 5.3.1. North America
- 5.3.2. South America
- 5.3.3. Europe
- 5.3.4. Middle East & Africa
- 5.3.5. Asia Pacific
- 5.1. Market Analysis, Insights and Forecast - by Services
- 6. Global Third-Party Logistics Industry in Brazil Analysis, Insights and Forecast, 2021-2033
- 6.1. Market Analysis, Insights and Forecast - by Services
- 6.1.1. Domestic Transportation Management
- 6.1.2. International Transportation Management
- 6.1.3. Value-added Warehousing and Distribution
- 6.2. Market Analysis, Insights and Forecast - by End User
- 6.2.1. Automobile
- 6.2.2. Chemicals
- 6.2.3. Consumer and Retail
- 6.2.4. Energy
- 6.2.5. Engineering and Manufacturing
- 6.2.6. Life Science and Healthcare
- 6.2.7. Other End User
- 6.1. Market Analysis, Insights and Forecast - by Services
- 7. North America Third-Party Logistics Industry in Brazil Analysis, Insights and Forecast, 2020-2032
- 7.1. Market Analysis, Insights and Forecast - by Services
- 7.1.1. Domestic Transportation Management
- 7.1.2. International Transportation Management
- 7.1.3. Value-added Warehousing and Distribution
- 7.2. Market Analysis, Insights and Forecast - by End User
- 7.2.1. Automobile
- 7.2.2. Chemicals
- 7.2.3. Consumer and Retail
- 7.2.4. Energy
- 7.2.5. Engineering and Manufacturing
- 7.2.6. Life Science and Healthcare
- 7.2.7. Other End User
- 7.1. Market Analysis, Insights and Forecast - by Services
- 8. South America Third-Party Logistics Industry in Brazil Analysis, Insights and Forecast, 2020-2032
- 8.1. Market Analysis, Insights and Forecast - by Services
- 8.1.1. Domestic Transportation Management
- 8.1.2. International Transportation Management
- 8.1.3. Value-added Warehousing and Distribution
- 8.2. Market Analysis, Insights and Forecast - by End User
- 8.2.1. Automobile
- 8.2.2. Chemicals
- 8.2.3. Consumer and Retail
- 8.2.4. Energy
- 8.2.5. Engineering and Manufacturing
- 8.2.6. Life Science and Healthcare
- 8.2.7. Other End User
- 8.1. Market Analysis, Insights and Forecast - by Services
- 9. Europe Third-Party Logistics Industry in Brazil Analysis, Insights and Forecast, 2020-2032
- 9.1. Market Analysis, Insights and Forecast - by Services
- 9.1.1. Domestic Transportation Management
- 9.1.2. International Transportation Management
- 9.1.3. Value-added Warehousing and Distribution
- 9.2. Market Analysis, Insights and Forecast - by End User
- 9.2.1. Automobile
- 9.2.2. Chemicals
- 9.2.3. Consumer and Retail
- 9.2.4. Energy
- 9.2.5. Engineering and Manufacturing
- 9.2.6. Life Science and Healthcare
- 9.2.7. Other End User
- 9.1. Market Analysis, Insights and Forecast - by Services
- 10. Middle East & Africa Third-Party Logistics Industry in Brazil Analysis, Insights and Forecast, 2020-2032
- 10.1. Market Analysis, Insights and Forecast - by Services
- 10.1.1. Domestic Transportation Management
- 10.1.2. International Transportation Management
- 10.1.3. Value-added Warehousing and Distribution
- 10.2. Market Analysis, Insights and Forecast - by End User
- 10.2.1. Automobile
- 10.2.2. Chemicals
- 10.2.3. Consumer and Retail
- 10.2.4. Energy
- 10.2.5. Engineering and Manufacturing
- 10.2.6. Life Science and Healthcare
- 10.2.7. Other End User
- 10.1. Market Analysis, Insights and Forecast - by Services
- 11. Asia Pacific Third-Party Logistics Industry in Brazil Analysis, Insights and Forecast, 2020-2032
- 11.1. Market Analysis, Insights and Forecast - by Services
- 11.1.1. Domestic Transportation Management
- 11.1.2. International Transportation Management
- 11.1.3. Value-added Warehousing and Distribution
- 11.2. Market Analysis, Insights and Forecast - by End User
- 11.2.1. Automobile
- 11.2.2. Chemicals
- 11.2.3. Consumer and Retail
- 11.2.4. Energy
- 11.2.5. Engineering and Manufacturing
- 11.2.6. Life Science and Healthcare
- 11.2.7. Other End User
- 11.1. Market Analysis, Insights and Forecast - by Services
- 12. Competitive Analysis
- 12.1. Company Profiles
- 12.1.1 DB Schenker
- 12.1.1.1. Company Overview
- 12.1.1.2. Products
- 12.1.1.3. Company Financials
- 12.1.1.4. SWOT Analysis
- 12.1.2 CEVA Logistics AG
- 12.1.2.1. Company Overview
- 12.1.2.2. Products
- 12.1.2.3. Company Financials
- 12.1.2.4. SWOT Analysis
- 12.1.3 Penske Logistics do Brasil Ltda**List Not Exhaustive 6 3 Other Companie
- 12.1.3.1. Company Overview
- 12.1.3.2. Products
- 12.1.3.3. Company Financials
- 12.1.3.4. SWOT Analysis
- 12.1.4 C H Robinson Worldwide Inc
- 12.1.4.1. Company Overview
- 12.1.4.2. Products
- 12.1.4.3. Company Financials
- 12.1.4.4. SWOT Analysis
- 12.1.5 Nippon Express Co Ltd
- 12.1.5.1. Company Overview
- 12.1.5.2. Products
- 12.1.5.3. Company Financials
- 12.1.5.4. SWOT Analysis
- 12.1.6 Kuehne + Nagel International AG
- 12.1.6.1. Company Overview
- 12.1.6.2. Products
- 12.1.6.3. Company Financials
- 12.1.6.4. SWOT Analysis
- 12.1.7 FedEx
- 12.1.7.1. Company Overview
- 12.1.7.2. Products
- 12.1.7.3. Company Financials
- 12.1.7.4. SWOT Analysis
- 12.1.8 BBM Logística SA
- 12.1.8.1. Company Overview
- 12.1.8.2. Products
- 12.1.8.3. Company Financials
- 12.1.8.4. SWOT Analysis
- 12.1.9 DSV AS
- 12.1.9.1. Company Overview
- 12.1.9.2. Products
- 12.1.9.3. Company Financials
- 12.1.9.4. SWOT Analysis
- 12.1.10 Deutsche Post AG
- 12.1.10.1. Company Overview
- 12.1.10.2. Products
- 12.1.10.3. Company Financials
- 12.1.10.4. SWOT Analysis
- 12.1.11 Gafor SA
- 12.1.11.1. Company Overview
- 12.1.11.2. Products
- 12.1.11.3. Company Financials
- 12.1.11.4. SWOT Analysis
- 12.1.1 DB Schenker
- 12.2. Market Entropy
- 12.2.1 Company's Key Areas Served
- 12.2.2 Recent Developments
- 12.3. Company Market Share Analysis 2025
- 12.3.1 Top 5 Companies Market Share Analysis
- 12.3.2 Top 3 Companies Market Share Analysis
- 12.4. List of Potential Customers
- 13. Research Methodology
List of Figures
- Figure 1: Global Third-Party Logistics Industry in Brazil Revenue Breakdown (Million, %) by Region 2025 & 2033
- Figure 2: North America Third-Party Logistics Industry in Brazil Revenue (Million), by Services 2025 & 2033
- Figure 3: North America Third-Party Logistics Industry in Brazil Revenue Share (%), by Services 2025 & 2033
- Figure 4: North America Third-Party Logistics Industry in Brazil Revenue (Million), by End User 2025 & 2033
- Figure 5: North America Third-Party Logistics Industry in Brazil Revenue Share (%), by End User 2025 & 2033
- Figure 6: North America Third-Party Logistics Industry in Brazil Revenue (Million), by Country 2025 & 2033
- Figure 7: North America Third-Party Logistics Industry in Brazil Revenue Share (%), by Country 2025 & 2033
- Figure 8: South America Third-Party Logistics Industry in Brazil Revenue (Million), by Services 2025 & 2033
- Figure 9: South America Third-Party Logistics Industry in Brazil Revenue Share (%), by Services 2025 & 2033
- Figure 10: South America Third-Party Logistics Industry in Brazil Revenue (Million), by End User 2025 & 2033
- Figure 11: South America Third-Party Logistics Industry in Brazil Revenue Share (%), by End User 2025 & 2033
- Figure 12: South America Third-Party Logistics Industry in Brazil Revenue (Million), by Country 2025 & 2033
- Figure 13: South America Third-Party Logistics Industry in Brazil Revenue Share (%), by Country 2025 & 2033
- Figure 14: Europe Third-Party Logistics Industry in Brazil Revenue (Million), by Services 2025 & 2033
- Figure 15: Europe Third-Party Logistics Industry in Brazil Revenue Share (%), by Services 2025 & 2033
- Figure 16: Europe Third-Party Logistics Industry in Brazil Revenue (Million), by End User 2025 & 2033
- Figure 17: Europe Third-Party Logistics Industry in Brazil Revenue Share (%), by End User 2025 & 2033
- Figure 18: Europe Third-Party Logistics Industry in Brazil Revenue (Million), by Country 2025 & 2033
- Figure 19: Europe Third-Party Logistics Industry in Brazil Revenue Share (%), by Country 2025 & 2033
- Figure 20: Middle East & Africa Third-Party Logistics Industry in Brazil Revenue (Million), by Services 2025 & 2033
- Figure 21: Middle East & Africa Third-Party Logistics Industry in Brazil Revenue Share (%), by Services 2025 & 2033
- Figure 22: Middle East & Africa Third-Party Logistics Industry in Brazil Revenue (Million), by End User 2025 & 2033
- Figure 23: Middle East & Africa Third-Party Logistics Industry in Brazil Revenue Share (%), by End User 2025 & 2033
- Figure 24: Middle East & Africa Third-Party Logistics Industry in Brazil Revenue (Million), by Country 2025 & 2033
- Figure 25: Middle East & Africa Third-Party Logistics Industry in Brazil Revenue Share (%), by Country 2025 & 2033
- Figure 26: Asia Pacific Third-Party Logistics Industry in Brazil Revenue (Million), by Services 2025 & 2033
- Figure 27: Asia Pacific Third-Party Logistics Industry in Brazil Revenue Share (%), by Services 2025 & 2033
- Figure 28: Asia Pacific Third-Party Logistics Industry in Brazil Revenue (Million), by End User 2025 & 2033
- Figure 29: Asia Pacific Third-Party Logistics Industry in Brazil Revenue Share (%), by End User 2025 & 2033
- Figure 30: Asia Pacific Third-Party Logistics Industry in Brazil Revenue (Million), by Country 2025 & 2033
- Figure 31: Asia Pacific Third-Party Logistics Industry in Brazil Revenue Share (%), by Country 2025 & 2033
List of Tables
- Table 1: Global Third-Party Logistics Industry in Brazil Revenue Million Forecast, by Services 2020 & 2033
- Table 2: Global Third-Party Logistics Industry in Brazil Revenue Million Forecast, by End User 2020 & 2033
- Table 3: Global Third-Party Logistics Industry in Brazil Revenue Million Forecast, by Region 2020 & 2033
- Table 4: Global Third-Party Logistics Industry in Brazil Revenue Million Forecast, by Services 2020 & 2033
- Table 5: Global Third-Party Logistics Industry in Brazil Revenue Million Forecast, by End User 2020 & 2033
- Table 6: Global Third-Party Logistics Industry in Brazil Revenue Million Forecast, by Country 2020 & 2033
- Table 7: United States Third-Party Logistics Industry in Brazil Revenue (Million) Forecast, by Application 2020 & 2033
- Table 8: Canada Third-Party Logistics Industry in Brazil Revenue (Million) Forecast, by Application 2020 & 2033
- Table 9: Mexico Third-Party Logistics Industry in Brazil Revenue (Million) Forecast, by Application 2020 & 2033
- Table 10: Global Third-Party Logistics Industry in Brazil Revenue Million Forecast, by Services 2020 & 2033
- Table 11: Global Third-Party Logistics Industry in Brazil Revenue Million Forecast, by End User 2020 & 2033
- Table 12: Global Third-Party Logistics Industry in Brazil Revenue Million Forecast, by Country 2020 & 2033
- Table 13: Brazil Third-Party Logistics Industry in Brazil Revenue (Million) Forecast, by Application 2020 & 2033
- Table 14: Argentina Third-Party Logistics Industry in Brazil Revenue (Million) Forecast, by Application 2020 & 2033
- Table 15: Rest of South America Third-Party Logistics Industry in Brazil Revenue (Million) Forecast, by Application 2020 & 2033
- Table 16: Global Third-Party Logistics Industry in Brazil Revenue Million Forecast, by Services 2020 & 2033
- Table 17: Global Third-Party Logistics Industry in Brazil Revenue Million Forecast, by End User 2020 & 2033
- Table 18: Global Third-Party Logistics Industry in Brazil Revenue Million Forecast, by Country 2020 & 2033
- Table 19: United Kingdom Third-Party Logistics Industry in Brazil Revenue (Million) Forecast, by Application 2020 & 2033
- Table 20: Germany Third-Party Logistics Industry in Brazil Revenue (Million) Forecast, by Application 2020 & 2033
- Table 21: France Third-Party Logistics Industry in Brazil Revenue (Million) Forecast, by Application 2020 & 2033
- Table 22: Italy Third-Party Logistics Industry in Brazil Revenue (Million) Forecast, by Application 2020 & 2033
- Table 23: Spain Third-Party Logistics Industry in Brazil Revenue (Million) Forecast, by Application 2020 & 2033
- Table 24: Russia Third-Party Logistics Industry in Brazil Revenue (Million) Forecast, by Application 2020 & 2033
- Table 25: Benelux Third-Party Logistics Industry in Brazil Revenue (Million) Forecast, by Application 2020 & 2033
- Table 26: Nordics Third-Party Logistics Industry in Brazil Revenue (Million) Forecast, by Application 2020 & 2033
- Table 27: Rest of Europe Third-Party Logistics Industry in Brazil Revenue (Million) Forecast, by Application 2020 & 2033
- Table 28: Global Third-Party Logistics Industry in Brazil Revenue Million Forecast, by Services 2020 & 2033
- Table 29: Global Third-Party Logistics Industry in Brazil Revenue Million Forecast, by End User 2020 & 2033
- Table 30: Global Third-Party Logistics Industry in Brazil Revenue Million Forecast, by Country 2020 & 2033
- Table 31: Turkey Third-Party Logistics Industry in Brazil Revenue (Million) Forecast, by Application 2020 & 2033
- Table 32: Israel Third-Party Logistics Industry in Brazil Revenue (Million) Forecast, by Application 2020 & 2033
- Table 33: GCC Third-Party Logistics Industry in Brazil Revenue (Million) Forecast, by Application 2020 & 2033
- Table 34: North Africa Third-Party Logistics Industry in Brazil Revenue (Million) Forecast, by Application 2020 & 2033
- Table 35: South Africa Third-Party Logistics Industry in Brazil Revenue (Million) Forecast, by Application 2020 & 2033
- Table 36: Rest of Middle East & Africa Third-Party Logistics Industry in Brazil Revenue (Million) Forecast, by Application 2020 & 2033
- Table 37: Global Third-Party Logistics Industry in Brazil Revenue Million Forecast, by Services 2020 & 2033
- Table 38: Global Third-Party Logistics Industry in Brazil Revenue Million Forecast, by End User 2020 & 2033
- Table 39: Global Third-Party Logistics Industry in Brazil Revenue Million Forecast, by Country 2020 & 2033
- Table 40: China Third-Party Logistics Industry in Brazil Revenue (Million) Forecast, by Application 2020 & 2033
- Table 41: India Third-Party Logistics Industry in Brazil Revenue (Million) Forecast, by Application 2020 & 2033
- Table 42: Japan Third-Party Logistics Industry in Brazil Revenue (Million) Forecast, by Application 2020 & 2033
- Table 43: South Korea Third-Party Logistics Industry in Brazil Revenue (Million) Forecast, by Application 2020 & 2033
- Table 44: ASEAN Third-Party Logistics Industry in Brazil Revenue (Million) Forecast, by Application 2020 & 2033
- Table 45: Oceania Third-Party Logistics Industry in Brazil Revenue (Million) Forecast, by Application 2020 & 2033
- Table 46: Rest of Asia Pacific Third-Party Logistics Industry in Brazil Revenue (Million) Forecast, by Application 2020 & 2033
Frequently Asked Questions
1. What is the projected Compound Annual Growth Rate (CAGR) of the Third-Party Logistics Industry in Brazil?
The projected CAGR is approximately 4.26%.
2. Which companies are prominent players in the Third-Party Logistics Industry in Brazil?
Key companies in the market include DB Schenker, CEVA Logistics AG, Penske Logistics do Brasil Ltda**List Not Exhaustive 6 3 Other Companie, C H Robinson Worldwide Inc, Nippon Express Co Ltd, Kuehne + Nagel International AG, FedEx, BBM Logística SA, DSV AS, Deutsche Post AG, Gafor SA.
3. What are the main segments of the Third-Party Logistics Industry in Brazil?
The market segments include Services, End User.
4. Can you provide details about the market size?
The market size is estimated to be USD 33.20 Million as of 2022.
5. What are some drivers contributing to market growth?
E-commerce Fueling the Growth of 3PL Market.
6. What are the notable trends driving market growth?
Increasing Freight Trucking is Driving Market Growth.
7. Are there any restraints impacting market growth?
Slow Infrastructure Development.
8. Can you provide examples of recent developments in the market?
N/A
9. What pricing options are available for accessing the report?
Pricing options include single-user, multi-user, and enterprise licenses priced at USD 3800, USD 4500, and USD 5800 respectively.
10. Is the market size provided in terms of value or volume?
The market size is provided in terms of value, measured in Million.
11. Are there any specific market keywords associated with the report?
Yes, the market keyword associated with the report is "Third-Party Logistics Industry in Brazil," which aids in identifying and referencing the specific market segment covered.
12. How do I determine which pricing option suits my needs best?
The pricing options vary based on user requirements and access needs. Individual users may opt for single-user licenses, while businesses requiring broader access may choose multi-user or enterprise licenses for cost-effective access to the report.
13. Are there any additional resources or data provided in the Third-Party Logistics Industry in Brazil report?
While the report offers comprehensive insights, it's advisable to review the specific contents or supplementary materials provided to ascertain if additional resources or data are available.
14. How can I stay updated on further developments or reports in the Third-Party Logistics Industry in Brazil?
To stay informed about further developments, trends, and reports in the Third-Party Logistics Industry in Brazil, consider subscribing to industry newsletters, following relevant companies and organizations, or regularly checking reputable industry news sources and publications.
Methodology
Step 1 - Identification of Relevant Samples Size from Population Database


Step 2 - Approaches for Defining Global Market Size (Value, Volume* & Price*)

Note*: In applicable scenarios
Step 3 - Data Sources
Primary Research
- Web Analytics
- Survey Reports
- Research Institute
- Latest Research Reports
- Opinion Leaders
Secondary Research
- Annual Reports
- White Paper
- Latest Press Release
- Industry Association
- Paid Database
- Investor Presentations

Step 4 - Data Triangulation
Involves using different sources of information in order to increase the validity of a study
These sources are likely to be stakeholders in a program - participants, other researchers, program staff, other community members, and so on.
Then we put all data in single framework & apply various statistical tools to find out the dynamic on the market.
During the analysis stage, feedback from the stakeholder groups would be compared to determine areas of agreement as well as areas of divergence