

Key Insights
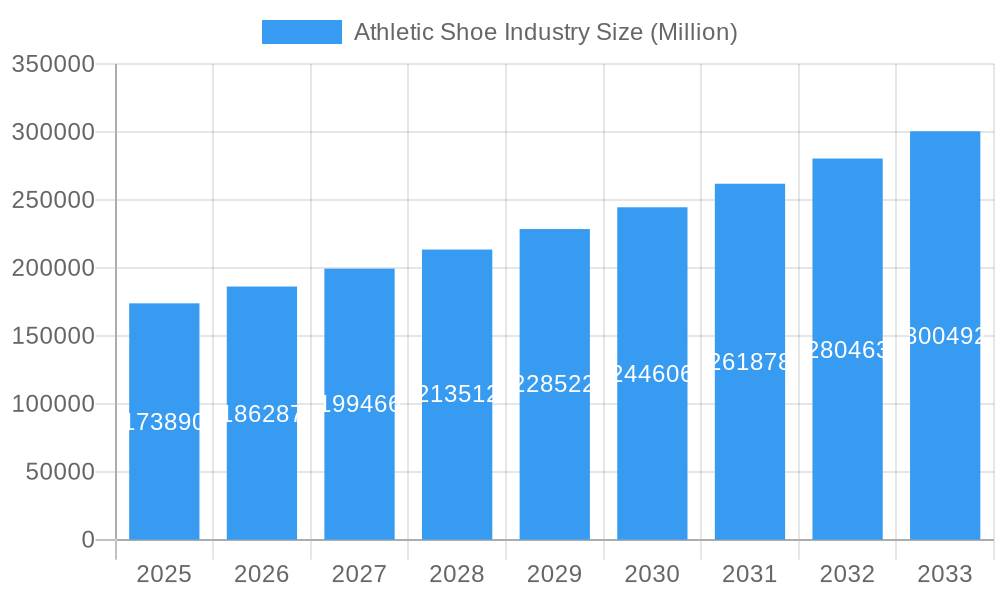
The global athletic shoe market, valued at $173.89 billion in 2025, is projected to experience robust growth, driven by several key factors. The rising popularity of fitness activities, including running, sports, and hiking, fuels demand across various shoe categories. Increasing disposable incomes, particularly in developing economies, contribute to higher spending on athletic footwear. Furthermore, technological advancements in shoe design, focusing on comfort, performance enhancement, and sustainability, are attracting consumers seeking high-quality products. The market is segmented by product type (running, sports, trekking/hiking, and others), end-user (men, women, children), and distribution channel (specialty stores, supermarkets/hypermarkets, and online retailers). The dominance of established brands like Nike, Adidas, and Under Armour highlights the competitive landscape, although emerging brands are challenging the status quo with innovative designs and marketing strategies. Growth is anticipated across all segments, with online retail showing significant potential due to increased e-commerce penetration and convenient shopping experiences. Geographic variations exist; North America and Europe maintain strong market shares, while Asia-Pacific demonstrates rapid growth driven by increasing participation in sports and rising consumer spending.
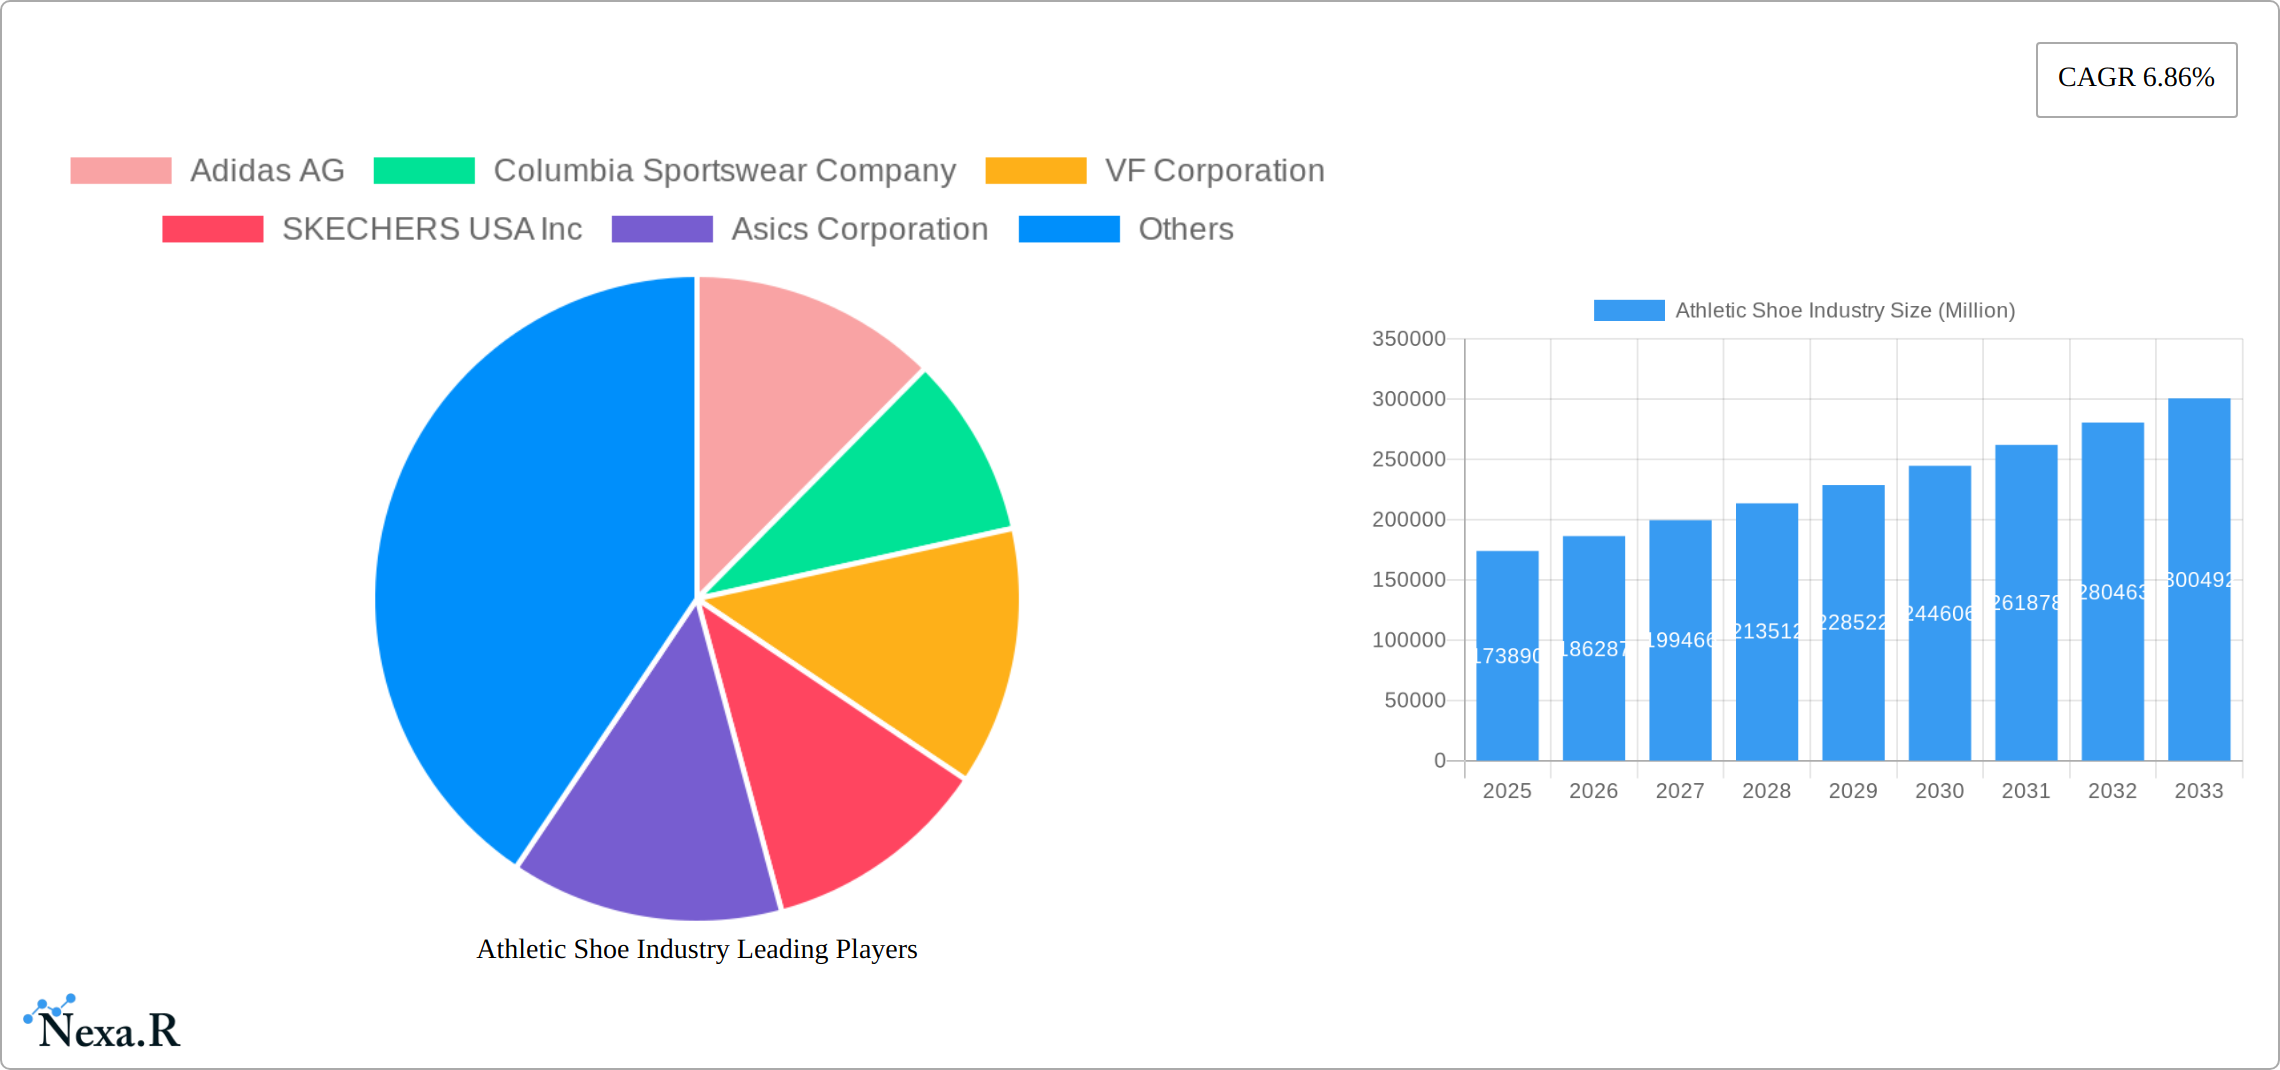
Athletic Shoe Industry Market Size (In Billion)
The projected CAGR of 6.86% indicates a steady expansion of the market throughout the forecast period (2025-2033). However, this growth might be tempered by economic downturns that could affect consumer spending on discretionary items like athletic shoes. Furthermore, increasing raw material costs and supply chain disruptions could pose challenges to manufacturers. Sustainability concerns are also gaining prominence, pushing brands to adopt eco-friendly manufacturing practices and materials. Competition among brands remains fierce, necessitating continuous innovation and marketing efforts to maintain market share. To overcome these challenges, companies are likely to focus on product diversification, strategic partnerships, and targeted marketing campaigns to cater to diverse customer segments and preferences.
Athletic Shoe Industry Company Market Share
Athletic Shoe Industry Market Report: 2019-2033
This comprehensive report provides an in-depth analysis of the global athletic shoe industry, encompassing market dynamics, growth trends, regional segmentation, product landscape, and key player strategies. Covering the period from 2019 to 2033, with a focus on 2025, this report is an indispensable resource for industry professionals, investors, and strategic decision-makers. The report utilizes Million units as the measurement unit throughout.
Athletic Shoe Industry Market Dynamics & Structure
The athletic shoe market is a fiercely competitive landscape, featuring established global giants and a surge of innovative emerging brands. While a few dominant players control a significant portion of the market share, creating a moderately concentrated market, numerous smaller companies cater to specialized niches. Market dynamics are heavily influenced by rapid technological advancements in materials science, manufacturing processes, and design. Stringent regulatory frameworks, focused on product safety and environmental sustainability, significantly impact industry practices. The market faces competitive pressure from substitutes like casual footwear and minimalist shoes, impacting overall growth. The diverse end-user demographic, encompassing various age groups and genders, necessitates adaptable product designs and targeted marketing strategies. Mergers and acquisitions (M&A) activity, while moderate in recent years, shows larger companies strategically acquiring smaller, specialized brands to broaden their product portfolios and extend their market reach.
- Market Concentration (2025): Top 5 players hold approximately [Insert Percentage]% of the market share.
- Technological Innovation: Key focuses include sustainable and recycled materials, personalized fit technologies using data analytics (e.g., 3D-printed midsoles, adaptive cushioning), and data-driven performance enhancement through embedded sensors and AI-powered feedback.
- Regulatory Landscape: Strict adherence to safety standards (e.g., flammability, toxicity) and increasingly stringent environmental regulations (e.g., carbon footprint reduction, waste management) are critical for success.
- Competitive Substitutes: The rising popularity of casual footwear and the growing appeal of minimalist and barefoot-style shoes present significant competitive challenges requiring innovative product differentiation.
- End-User Demographics: Key market segments include men, women, and children, each demanding specific product features, designs, and marketing approaches. Further segmentation by activity level (e.g., professional athletes, casual runners) and lifestyle preferences is essential.
- M&A Activity (2019-2024): [Insert Number] M&A deals were recorded. Projected deals for 2025-2033: [Insert Number].
Athletic Shoe Industry Growth Trends & Insights
The global athletic shoe market has demonstrated robust growth in recent years, fueled by rising disposable incomes, a heightened focus on health and wellness, and the increasing popularity of various fitness activities. Market expansion has been significant, with a Compound Annual Growth Rate (CAGR) of [Insert Percentage]% during the historical period (2019-2024). This growth trajectory is projected to continue, with a projected CAGR of [Insert Percentage]% during the forecast period (2025-2033), reaching an estimated [Insert Number] million units by 2033. Technological disruptions, such as the introduction of smart shoes with integrated fitness tracking and personalized footwear solutions tailored to individual biomechanics, are reshaping consumer preferences. A growing consumer demand for sustainable and ethically sourced materials is also influencing product development and marketing strategies. Consumer behavior is significantly shaped by brand loyalty, influencer marketing campaigns (especially social media), and online reviews across various platforms. While market penetration remains high in developed economies, significant growth opportunities exist in emerging markets with expanding middle classes and increasing disposable incomes.
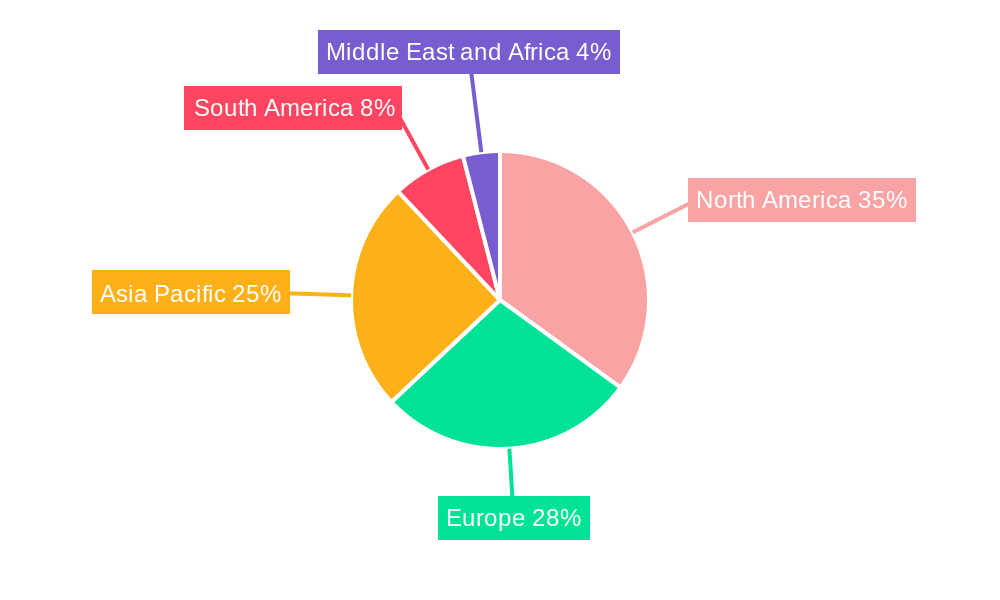
Dominant Regions, Countries, or Segments in Athletic Shoe Industry
North America retains its position as the leading market in terms of both market size and revenue generation, followed by Europe and the Asia-Pacific region. Running shoes and training shoes represent the largest product segments, collectively holding approximately [Insert Percentage]% of the market share in 2025. While men's athletic shoes currently dominate the end-user segment, the women's segment is experiencing rapid and sustained growth, driven by increased female participation in sports and fitness. Traditional sports and athletic goods stores remain a primary distribution channel, but online retail is rapidly gaining market share, benefiting from enhanced e-commerce platforms and improved online shopping experiences.
- Leading Regions (2025): North America ([Insert Number] million units), Europe ([Insert Number] million units), Asia-Pacific ([Insert Number] million units).
- Key Drivers: Rising disposable incomes across various economic segments, increased participation in a wide range of sports and fitness activities, and supportive government policies promoting healthy lifestyles.
- Dominant Segments (2025): Running Shoes ([Insert Number] million units), Men's Athletic Shoes ([Insert Number] million units), Sports and Athletic Goods Stores ([Insert Number] million units).
Athletic Shoe Industry Product Landscape
The athletic shoe market showcases a wide range of products catering to diverse needs and preferences. Innovations include enhanced cushioning systems, improved breathability, and advanced motion control technologies. Products are designed for specific activities like running, basketball, training, and hiking, each requiring unique features and performance attributes. Unique selling propositions often center around brand reputation, technological advancements, and superior comfort. Recent innovations in materials science have led to the development of lighter, more durable, and environmentally friendly shoe designs.
Key Drivers, Barriers & Challenges in Athletic Shoe Industry
Key Drivers:
- Technological advancements in materials and design.
- Rising health consciousness and increased participation in sports and fitness activities.
- Growing online retail and e-commerce penetration.
Key Challenges and Restraints:
- Fluctuations in raw material costs and supply chain disruptions.
- Intense competition among established brands and emerging players.
- Stringent environmental regulations impacting manufacturing practices.
- The impact of economic downturns on consumer spending.
Emerging Opportunities in Athletic Shoe Industry
- Growth in personalized footwear solutions and customized shoe design.
- Expansion into emerging markets with rising disposable incomes.
- Development of sustainable and eco-friendly athletic shoes.
- Focus on niche sports and fitness activities with specialized footwear needs.
Growth Accelerators in the Athletic Shoe Industry Industry
Technological breakthroughs, specifically in materials science and manufacturing processes, are significantly accelerating market growth. Strategic partnerships with fitness brands and technology companies are expanding market reach and product offerings. Aggressive market expansion strategies into untapped regions and consumer segments are driving revenue growth.
Key Players Shaping the Athletic Shoe Industry Market
Notable Milestones in Athletic Shoe Industry Sector
- June 2024: Nike launched the Converse Run Star Trainer, a low-profile shoe combining retro and modern aesthetics.
- June 2024: PUMA announced a worldwide partnership with HYROX, becoming the official apparel and footwear partner.
- June 2024: PUMA launched Deviate NITRO 3 training shoes, featuring NITROFOAM technology.
In-Depth Athletic Shoe Industry Market Outlook
The athletic shoe market is poised for continued growth, driven by a confluence of factors: ongoing technological advancements, evolving consumer preferences towards sustainability and personalization, and the expansion of global markets, particularly in emerging economies. Strategic investments in research and development, coupled with innovative and targeted marketing strategies (leveraging digital channels and data analytics), will be crucial for shaping future market dynamics. Companies prioritizing sustainability, personalization (through data-driven customization and fit technologies), and seamless technological integration into their products and customer experiences are best positioned to gain a competitive advantage in this dynamic and ever-evolving market. The future holds considerable opportunities for companies that can effectively adapt to evolving consumer demands and successfully leverage emerging technological trends to create innovative and desirable athletic footwear products.
Athletic Shoe Industry Segmentation
-
1. Product Type
- 1.1. Running Shoes
- 1.2. Sports Shoes
- 1.3. Trekking/Hiking Shoes
- 1.4. Other Product Types
-
2. End User
- 2.1. Men
- 2.2. Women
- 2.3. Kids/Children
-
3. Distribution Channel
- 3.1. Sports and Atheletic Goods Stores
- 3.2. Supermarkets/Hypermarkets
- 3.3. Online Retail Stores
- 3.4. Other Distribution Channels
Athletic Shoe Industry Segmentation By Geography
-
1. North America
- 1.1. United States
- 1.2. Canada
- 1.3. Mexico
- 1.4. Rest of North America
-
2. Europe
- 2.1. United Kingdom
- 2.2. Germany
- 2.3. Spain
- 2.4. France
- 2.5. Italy
- 2.6. Netherlands
- 2.7. Rest of Europe
-
3. Asia Pacific
- 3.1. China
- 3.2. Japan
- 3.3. India
- 3.4. Australia
- 3.5. Rest of Asia Pacific
-
4. South America
- 4.1. Brazil
- 4.2. Argentina
- 4.3. Rest of South America
-
5. Middle East and Africa
- 5.1. Saudi Arabia
- 5.2. South Africa
- 5.3. Rest of Middle East and Africa
Athletic Shoe Industry Regional Market Share
Geographic Coverage of Athletic Shoe Industry
Athletic Shoe Industry REPORT HIGHLIGHTS
| Aspects | Details |
|---|---|
| Study Period | 2020-2034 |
| Base Year | 2025 |
| Estimated Year | 2026 |
| Forecast Period | 2026-2034 |
| Historical Period | 2020-2025 |
| Growth Rate | CAGR of 6.86% from 2020-2034 |
| Segmentation |
|
Table of Contents
- 1. Introduction
- 1.1. Research Scope
- 1.2. Market Segmentation
- 1.3. Research Objective
- 1.4. Definitions and Assumptions
- 2. Executive Summary
- 2.1. Market Snapshot
- 3. Market Dynamics
- 3.1. Market Drivers
- 3.2. Market Restrains
- 3.3. Market Trends
- 3.4. Market Opportunities
- 4. Market Factor Analysis
- 4.1. Porters Five Forces
- 4.1.1. Bargaining Power of Suppliers
- 4.1.2. Bargaining Power of Buyers
- 4.1.3. Threat of New Entrants
- 4.1.4. Threat of Substitutes
- 4.1.5. Competitive Rivalry
- 4.2. PESTEL analysis
- 4.3. BCG Analysis
- 4.3.1. Stars (High Growth, High Market Share)
- 4.3.2. Cash Cows (Low Growth, High Market Share)
- 4.3.3. Question Mark (High Growth, Low Market Share)
- 4.3.4. Dogs (Low Growth, Low Market Share)
- 4.4. Ansoff Matrix Analysis
- 4.5. Supply Chain Analysis
- 4.6. Regulatory Landscape
- 4.7. Current Market Potential and Opportunity Assessment (TAM–SAM–SOM Framework)
- 4.8. NRP Analyst Note
- 4.1. Porters Five Forces
- 5. Market Analysis, Insights and Forecast 2021-2033
- 5.1. Market Analysis, Insights and Forecast - by Product Type
- 5.1.1. Running Shoes
- 5.1.2. Sports Shoes
- 5.1.3. Trekking/Hiking Shoes
- 5.1.4. Other Product Types
- 5.2. Market Analysis, Insights and Forecast - by End User
- 5.2.1. Men
- 5.2.2. Women
- 5.2.3. Kids/Children
- 5.3. Market Analysis, Insights and Forecast - by Distribution Channel
- 5.3.1. Sports and Atheletic Goods Stores
- 5.3.2. Supermarkets/Hypermarkets
- 5.3.3. Online Retail Stores
- 5.3.4. Other Distribution Channels
- 5.4. Market Analysis, Insights and Forecast - by Region
- 5.4.1. North America
- 5.4.2. Europe
- 5.4.3. Asia Pacific
- 5.4.4. South America
- 5.4.5. Middle East and Africa
- 5.1. Market Analysis, Insights and Forecast - by Product Type
- 6. Global Athletic Shoe Industry Analysis, Insights and Forecast, 2021-2033
- 6.1. Market Analysis, Insights and Forecast - by Product Type
- 6.1.1. Running Shoes
- 6.1.2. Sports Shoes
- 6.1.3. Trekking/Hiking Shoes
- 6.1.4. Other Product Types
- 6.2. Market Analysis, Insights and Forecast - by End User
- 6.2.1. Men
- 6.2.2. Women
- 6.2.3. Kids/Children
- 6.3. Market Analysis, Insights and Forecast - by Distribution Channel
- 6.3.1. Sports and Atheletic Goods Stores
- 6.3.2. Supermarkets/Hypermarkets
- 6.3.3. Online Retail Stores
- 6.3.4. Other Distribution Channels
- 6.1. Market Analysis, Insights and Forecast - by Product Type
- 7. North America Athletic Shoe Industry Analysis, Insights and Forecast, 2020-2032
- 7.1. Market Analysis, Insights and Forecast - by Product Type
- 7.1.1. Running Shoes
- 7.1.2. Sports Shoes
- 7.1.3. Trekking/Hiking Shoes
- 7.1.4. Other Product Types
- 7.2. Market Analysis, Insights and Forecast - by End User
- 7.2.1. Men
- 7.2.2. Women
- 7.2.3. Kids/Children
- 7.3. Market Analysis, Insights and Forecast - by Distribution Channel
- 7.3.1. Sports and Atheletic Goods Stores
- 7.3.2. Supermarkets/Hypermarkets
- 7.3.3. Online Retail Stores
- 7.3.4. Other Distribution Channels
- 7.1. Market Analysis, Insights and Forecast - by Product Type
- 8. Europe Athletic Shoe Industry Analysis, Insights and Forecast, 2020-2032
- 8.1. Market Analysis, Insights and Forecast - by Product Type
- 8.1.1. Running Shoes
- 8.1.2. Sports Shoes
- 8.1.3. Trekking/Hiking Shoes
- 8.1.4. Other Product Types
- 8.2. Market Analysis, Insights and Forecast - by End User
- 8.2.1. Men
- 8.2.2. Women
- 8.2.3. Kids/Children
- 8.3. Market Analysis, Insights and Forecast - by Distribution Channel
- 8.3.1. Sports and Atheletic Goods Stores
- 8.3.2. Supermarkets/Hypermarkets
- 8.3.3. Online Retail Stores
- 8.3.4. Other Distribution Channels
- 8.1. Market Analysis, Insights and Forecast - by Product Type
- 9. Asia Pacific Athletic Shoe Industry Analysis, Insights and Forecast, 2020-2032
- 9.1. Market Analysis, Insights and Forecast - by Product Type
- 9.1.1. Running Shoes
- 9.1.2. Sports Shoes
- 9.1.3. Trekking/Hiking Shoes
- 9.1.4. Other Product Types
- 9.2. Market Analysis, Insights and Forecast - by End User
- 9.2.1. Men
- 9.2.2. Women
- 9.2.3. Kids/Children
- 9.3. Market Analysis, Insights and Forecast - by Distribution Channel
- 9.3.1. Sports and Atheletic Goods Stores
- 9.3.2. Supermarkets/Hypermarkets
- 9.3.3. Online Retail Stores
- 9.3.4. Other Distribution Channels
- 9.1. Market Analysis, Insights and Forecast - by Product Type
- 10. South America Athletic Shoe Industry Analysis, Insights and Forecast, 2020-2032
- 10.1. Market Analysis, Insights and Forecast - by Product Type
- 10.1.1. Running Shoes
- 10.1.2. Sports Shoes
- 10.1.3. Trekking/Hiking Shoes
- 10.1.4. Other Product Types
- 10.2. Market Analysis, Insights and Forecast - by End User
- 10.2.1. Men
- 10.2.2. Women
- 10.2.3. Kids/Children
- 10.3. Market Analysis, Insights and Forecast - by Distribution Channel
- 10.3.1. Sports and Atheletic Goods Stores
- 10.3.2. Supermarkets/Hypermarkets
- 10.3.3. Online Retail Stores
- 10.3.4. Other Distribution Channels
- 10.1. Market Analysis, Insights and Forecast - by Product Type
- 11. Middle East and Africa Athletic Shoe Industry Analysis, Insights and Forecast, 2020-2032
- 11.1. Market Analysis, Insights and Forecast - by Product Type
- 11.1.1. Running Shoes
- 11.1.2. Sports Shoes
- 11.1.3. Trekking/Hiking Shoes
- 11.1.4. Other Product Types
- 11.2. Market Analysis, Insights and Forecast - by End User
- 11.2.1. Men
- 11.2.2. Women
- 11.2.3. Kids/Children
- 11.3. Market Analysis, Insights and Forecast - by Distribution Channel
- 11.3.1. Sports and Atheletic Goods Stores
- 11.3.2. Supermarkets/Hypermarkets
- 11.3.3. Online Retail Stores
- 11.3.4. Other Distribution Channels
- 11.1. Market Analysis, Insights and Forecast - by Product Type
- 12. Competitive Analysis
- 12.1. Company Profiles
- 12.1.1 Adidas AG
- 12.1.1.1. Company Overview
- 12.1.1.2. Products
- 12.1.1.3. Company Financials
- 12.1.1.4. SWOT Analysis
- 12.1.2 Columbia Sportswear Company
- 12.1.2.1. Company Overview
- 12.1.2.2. Products
- 12.1.2.3. Company Financials
- 12.1.2.4. SWOT Analysis
- 12.1.3 VF Corporation
- 12.1.3.1. Company Overview
- 12.1.3.2. Products
- 12.1.3.3. Company Financials
- 12.1.3.4. SWOT Analysis
- 12.1.4 SKECHERS USA Inc
- 12.1.4.1. Company Overview
- 12.1.4.2. Products
- 12.1.4.3. Company Financials
- 12.1.4.4. SWOT Analysis
- 12.1.5 Asics Corporation
- 12.1.5.1. Company Overview
- 12.1.5.2. Products
- 12.1.5.3. Company Financials
- 12.1.5.4. SWOT Analysis
- 12.1.6 Puma SE
- 12.1.6.1. Company Overview
- 12.1.6.2. Products
- 12.1.6.3. Company Financials
- 12.1.6.4. SWOT Analysis
- 12.1.7 Under Armour Inc
- 12.1.7.1. Company Overview
- 12.1.7.2. Products
- 12.1.7.3. Company Financials
- 12.1.7.4. SWOT Analysis
- 12.1.8 Nike Inc
- 12.1.8.1. Company Overview
- 12.1.8.2. Products
- 12.1.8.3. Company Financials
- 12.1.8.4. SWOT Analysis
- 12.1.9 New Balance Athletics Inc
- 12.1.9.1. Company Overview
- 12.1.9.2. Products
- 12.1.9.3. Company Financials
- 12.1.9.4. SWOT Analysis
- 12.1.10 Fila
- 12.1.10.1. Company Overview
- 12.1.10.2. Products
- 12.1.10.3. Company Financials
- 12.1.10.4. SWOT Analysis
- 12.1.1 Adidas AG
- 12.2. Market Entropy
- 12.2.1 Company's Key Areas Served
- 12.2.2 Recent Developments
- 12.3. Company Market Share Analysis 2025
- 12.3.1 Top 5 Companies Market Share Analysis
- 12.3.2 Top 3 Companies Market Share Analysis
- 12.4. List of Potential Customers
- 13. Research Methodology
List of Figures
- Figure 1: Global Athletic Shoe Industry Revenue Breakdown (Million, %) by Region 2025 & 2033
- Figure 2: Global Athletic Shoe Industry Volume Breakdown (K Units, %) by Region 2025 & 2033
- Figure 3: North America Athletic Shoe Industry Revenue (Million), by Product Type 2025 & 2033
- Figure 4: North America Athletic Shoe Industry Volume (K Units), by Product Type 2025 & 2033
- Figure 5: North America Athletic Shoe Industry Revenue Share (%), by Product Type 2025 & 2033
- Figure 6: North America Athletic Shoe Industry Volume Share (%), by Product Type 2025 & 2033
- Figure 7: North America Athletic Shoe Industry Revenue (Million), by End User 2025 & 2033
- Figure 8: North America Athletic Shoe Industry Volume (K Units), by End User 2025 & 2033
- Figure 9: North America Athletic Shoe Industry Revenue Share (%), by End User 2025 & 2033
- Figure 10: North America Athletic Shoe Industry Volume Share (%), by End User 2025 & 2033
- Figure 11: North America Athletic Shoe Industry Revenue (Million), by Distribution Channel 2025 & 2033
- Figure 12: North America Athletic Shoe Industry Volume (K Units), by Distribution Channel 2025 & 2033
- Figure 13: North America Athletic Shoe Industry Revenue Share (%), by Distribution Channel 2025 & 2033
- Figure 14: North America Athletic Shoe Industry Volume Share (%), by Distribution Channel 2025 & 2033
- Figure 15: North America Athletic Shoe Industry Revenue (Million), by Country 2025 & 2033
- Figure 16: North America Athletic Shoe Industry Volume (K Units), by Country 2025 & 2033
- Figure 17: North America Athletic Shoe Industry Revenue Share (%), by Country 2025 & 2033
- Figure 18: North America Athletic Shoe Industry Volume Share (%), by Country 2025 & 2033
- Figure 19: Europe Athletic Shoe Industry Revenue (Million), by Product Type 2025 & 2033
- Figure 20: Europe Athletic Shoe Industry Volume (K Units), by Product Type 2025 & 2033
- Figure 21: Europe Athletic Shoe Industry Revenue Share (%), by Product Type 2025 & 2033
- Figure 22: Europe Athletic Shoe Industry Volume Share (%), by Product Type 2025 & 2033
- Figure 23: Europe Athletic Shoe Industry Revenue (Million), by End User 2025 & 2033
- Figure 24: Europe Athletic Shoe Industry Volume (K Units), by End User 2025 & 2033
- Figure 25: Europe Athletic Shoe Industry Revenue Share (%), by End User 2025 & 2033
- Figure 26: Europe Athletic Shoe Industry Volume Share (%), by End User 2025 & 2033
- Figure 27: Europe Athletic Shoe Industry Revenue (Million), by Distribution Channel 2025 & 2033
- Figure 28: Europe Athletic Shoe Industry Volume (K Units), by Distribution Channel 2025 & 2033
- Figure 29: Europe Athletic Shoe Industry Revenue Share (%), by Distribution Channel 2025 & 2033
- Figure 30: Europe Athletic Shoe Industry Volume Share (%), by Distribution Channel 2025 & 2033
- Figure 31: Europe Athletic Shoe Industry Revenue (Million), by Country 2025 & 2033
- Figure 32: Europe Athletic Shoe Industry Volume (K Units), by Country 2025 & 2033
- Figure 33: Europe Athletic Shoe Industry Revenue Share (%), by Country 2025 & 2033
- Figure 34: Europe Athletic Shoe Industry Volume Share (%), by Country 2025 & 2033
- Figure 35: Asia Pacific Athletic Shoe Industry Revenue (Million), by Product Type 2025 & 2033
- Figure 36: Asia Pacific Athletic Shoe Industry Volume (K Units), by Product Type 2025 & 2033
- Figure 37: Asia Pacific Athletic Shoe Industry Revenue Share (%), by Product Type 2025 & 2033
- Figure 38: Asia Pacific Athletic Shoe Industry Volume Share (%), by Product Type 2025 & 2033
- Figure 39: Asia Pacific Athletic Shoe Industry Revenue (Million), by End User 2025 & 2033
- Figure 40: Asia Pacific Athletic Shoe Industry Volume (K Units), by End User 2025 & 2033
- Figure 41: Asia Pacific Athletic Shoe Industry Revenue Share (%), by End User 2025 & 2033
- Figure 42: Asia Pacific Athletic Shoe Industry Volume Share (%), by End User 2025 & 2033
- Figure 43: Asia Pacific Athletic Shoe Industry Revenue (Million), by Distribution Channel 2025 & 2033
- Figure 44: Asia Pacific Athletic Shoe Industry Volume (K Units), by Distribution Channel 2025 & 2033
- Figure 45: Asia Pacific Athletic Shoe Industry Revenue Share (%), by Distribution Channel 2025 & 2033
- Figure 46: Asia Pacific Athletic Shoe Industry Volume Share (%), by Distribution Channel 2025 & 2033
- Figure 47: Asia Pacific Athletic Shoe Industry Revenue (Million), by Country 2025 & 2033
- Figure 48: Asia Pacific Athletic Shoe Industry Volume (K Units), by Country 2025 & 2033
- Figure 49: Asia Pacific Athletic Shoe Industry Revenue Share (%), by Country 2025 & 2033
- Figure 50: Asia Pacific Athletic Shoe Industry Volume Share (%), by Country 2025 & 2033
- Figure 51: South America Athletic Shoe Industry Revenue (Million), by Product Type 2025 & 2033
- Figure 52: South America Athletic Shoe Industry Volume (K Units), by Product Type 2025 & 2033
- Figure 53: South America Athletic Shoe Industry Revenue Share (%), by Product Type 2025 & 2033
- Figure 54: South America Athletic Shoe Industry Volume Share (%), by Product Type 2025 & 2033
- Figure 55: South America Athletic Shoe Industry Revenue (Million), by End User 2025 & 2033
- Figure 56: South America Athletic Shoe Industry Volume (K Units), by End User 2025 & 2033
- Figure 57: South America Athletic Shoe Industry Revenue Share (%), by End User 2025 & 2033
- Figure 58: South America Athletic Shoe Industry Volume Share (%), by End User 2025 & 2033
- Figure 59: South America Athletic Shoe Industry Revenue (Million), by Distribution Channel 2025 & 2033
- Figure 60: South America Athletic Shoe Industry Volume (K Units), by Distribution Channel 2025 & 2033
- Figure 61: South America Athletic Shoe Industry Revenue Share (%), by Distribution Channel 2025 & 2033
- Figure 62: South America Athletic Shoe Industry Volume Share (%), by Distribution Channel 2025 & 2033
- Figure 63: South America Athletic Shoe Industry Revenue (Million), by Country 2025 & 2033
- Figure 64: South America Athletic Shoe Industry Volume (K Units), by Country 2025 & 2033
- Figure 65: South America Athletic Shoe Industry Revenue Share (%), by Country 2025 & 2033
- Figure 66: South America Athletic Shoe Industry Volume Share (%), by Country 2025 & 2033
- Figure 67: Middle East and Africa Athletic Shoe Industry Revenue (Million), by Product Type 2025 & 2033
- Figure 68: Middle East and Africa Athletic Shoe Industry Volume (K Units), by Product Type 2025 & 2033
- Figure 69: Middle East and Africa Athletic Shoe Industry Revenue Share (%), by Product Type 2025 & 2033
- Figure 70: Middle East and Africa Athletic Shoe Industry Volume Share (%), by Product Type 2025 & 2033
- Figure 71: Middle East and Africa Athletic Shoe Industry Revenue (Million), by End User 2025 & 2033
- Figure 72: Middle East and Africa Athletic Shoe Industry Volume (K Units), by End User 2025 & 2033
- Figure 73: Middle East and Africa Athletic Shoe Industry Revenue Share (%), by End User 2025 & 2033
- Figure 74: Middle East and Africa Athletic Shoe Industry Volume Share (%), by End User 2025 & 2033
- Figure 75: Middle East and Africa Athletic Shoe Industry Revenue (Million), by Distribution Channel 2025 & 2033
- Figure 76: Middle East and Africa Athletic Shoe Industry Volume (K Units), by Distribution Channel 2025 & 2033
- Figure 77: Middle East and Africa Athletic Shoe Industry Revenue Share (%), by Distribution Channel 2025 & 2033
- Figure 78: Middle East and Africa Athletic Shoe Industry Volume Share (%), by Distribution Channel 2025 & 2033
- Figure 79: Middle East and Africa Athletic Shoe Industry Revenue (Million), by Country 2025 & 2033
- Figure 80: Middle East and Africa Athletic Shoe Industry Volume (K Units), by Country 2025 & 2033
- Figure 81: Middle East and Africa Athletic Shoe Industry Revenue Share (%), by Country 2025 & 2033
- Figure 82: Middle East and Africa Athletic Shoe Industry Volume Share (%), by Country 2025 & 2033
List of Tables
- Table 1: Global Athletic Shoe Industry Revenue Million Forecast, by Product Type 2020 & 2033
- Table 2: Global Athletic Shoe Industry Volume K Units Forecast, by Product Type 2020 & 2033
- Table 3: Global Athletic Shoe Industry Revenue Million Forecast, by End User 2020 & 2033
- Table 4: Global Athletic Shoe Industry Volume K Units Forecast, by End User 2020 & 2033
- Table 5: Global Athletic Shoe Industry Revenue Million Forecast, by Distribution Channel 2020 & 2033
- Table 6: Global Athletic Shoe Industry Volume K Units Forecast, by Distribution Channel 2020 & 2033
- Table 7: Global Athletic Shoe Industry Revenue Million Forecast, by Region 2020 & 2033
- Table 8: Global Athletic Shoe Industry Volume K Units Forecast, by Region 2020 & 2033
- Table 9: Global Athletic Shoe Industry Revenue Million Forecast, by Product Type 2020 & 2033
- Table 10: Global Athletic Shoe Industry Volume K Units Forecast, by Product Type 2020 & 2033
- Table 11: Global Athletic Shoe Industry Revenue Million Forecast, by End User 2020 & 2033
- Table 12: Global Athletic Shoe Industry Volume K Units Forecast, by End User 2020 & 2033
- Table 13: Global Athletic Shoe Industry Revenue Million Forecast, by Distribution Channel 2020 & 2033
- Table 14: Global Athletic Shoe Industry Volume K Units Forecast, by Distribution Channel 2020 & 2033
- Table 15: Global Athletic Shoe Industry Revenue Million Forecast, by Country 2020 & 2033
- Table 16: Global Athletic Shoe Industry Volume K Units Forecast, by Country 2020 & 2033
- Table 17: United States Athletic Shoe Industry Revenue (Million) Forecast, by Application 2020 & 2033
- Table 18: United States Athletic Shoe Industry Volume (K Units) Forecast, by Application 2020 & 2033
- Table 19: Canada Athletic Shoe Industry Revenue (Million) Forecast, by Application 2020 & 2033
- Table 20: Canada Athletic Shoe Industry Volume (K Units) Forecast, by Application 2020 & 2033
- Table 21: Mexico Athletic Shoe Industry Revenue (Million) Forecast, by Application 2020 & 2033
- Table 22: Mexico Athletic Shoe Industry Volume (K Units) Forecast, by Application 2020 & 2033
- Table 23: Rest of North America Athletic Shoe Industry Revenue (Million) Forecast, by Application 2020 & 2033
- Table 24: Rest of North America Athletic Shoe Industry Volume (K Units) Forecast, by Application 2020 & 2033
- Table 25: Global Athletic Shoe Industry Revenue Million Forecast, by Product Type 2020 & 2033
- Table 26: Global Athletic Shoe Industry Volume K Units Forecast, by Product Type 2020 & 2033
- Table 27: Global Athletic Shoe Industry Revenue Million Forecast, by End User 2020 & 2033
- Table 28: Global Athletic Shoe Industry Volume K Units Forecast, by End User 2020 & 2033
- Table 29: Global Athletic Shoe Industry Revenue Million Forecast, by Distribution Channel 2020 & 2033
- Table 30: Global Athletic Shoe Industry Volume K Units Forecast, by Distribution Channel 2020 & 2033
- Table 31: Global Athletic Shoe Industry Revenue Million Forecast, by Country 2020 & 2033
- Table 32: Global Athletic Shoe Industry Volume K Units Forecast, by Country 2020 & 2033
- Table 33: United Kingdom Athletic Shoe Industry Revenue (Million) Forecast, by Application 2020 & 2033
- Table 34: United Kingdom Athletic Shoe Industry Volume (K Units) Forecast, by Application 2020 & 2033
- Table 35: Germany Athletic Shoe Industry Revenue (Million) Forecast, by Application 2020 & 2033
- Table 36: Germany Athletic Shoe Industry Volume (K Units) Forecast, by Application 2020 & 2033
- Table 37: Spain Athletic Shoe Industry Revenue (Million) Forecast, by Application 2020 & 2033
- Table 38: Spain Athletic Shoe Industry Volume (K Units) Forecast, by Application 2020 & 2033
- Table 39: France Athletic Shoe Industry Revenue (Million) Forecast, by Application 2020 & 2033
- Table 40: France Athletic Shoe Industry Volume (K Units) Forecast, by Application 2020 & 2033
- Table 41: Italy Athletic Shoe Industry Revenue (Million) Forecast, by Application 2020 & 2033
- Table 42: Italy Athletic Shoe Industry Volume (K Units) Forecast, by Application 2020 & 2033
- Table 43: Netherlands Athletic Shoe Industry Revenue (Million) Forecast, by Application 2020 & 2033
- Table 44: Netherlands Athletic Shoe Industry Volume (K Units) Forecast, by Application 2020 & 2033
- Table 45: Rest of Europe Athletic Shoe Industry Revenue (Million) Forecast, by Application 2020 & 2033
- Table 46: Rest of Europe Athletic Shoe Industry Volume (K Units) Forecast, by Application 2020 & 2033
- Table 47: Global Athletic Shoe Industry Revenue Million Forecast, by Product Type 2020 & 2033
- Table 48: Global Athletic Shoe Industry Volume K Units Forecast, by Product Type 2020 & 2033
- Table 49: Global Athletic Shoe Industry Revenue Million Forecast, by End User 2020 & 2033
- Table 50: Global Athletic Shoe Industry Volume K Units Forecast, by End User 2020 & 2033
- Table 51: Global Athletic Shoe Industry Revenue Million Forecast, by Distribution Channel 2020 & 2033
- Table 52: Global Athletic Shoe Industry Volume K Units Forecast, by Distribution Channel 2020 & 2033
- Table 53: Global Athletic Shoe Industry Revenue Million Forecast, by Country 2020 & 2033
- Table 54: Global Athletic Shoe Industry Volume K Units Forecast, by Country 2020 & 2033
- Table 55: China Athletic Shoe Industry Revenue (Million) Forecast, by Application 2020 & 2033
- Table 56: China Athletic Shoe Industry Volume (K Units) Forecast, by Application 2020 & 2033
- Table 57: Japan Athletic Shoe Industry Revenue (Million) Forecast, by Application 2020 & 2033
- Table 58: Japan Athletic Shoe Industry Volume (K Units) Forecast, by Application 2020 & 2033
- Table 59: India Athletic Shoe Industry Revenue (Million) Forecast, by Application 2020 & 2033
- Table 60: India Athletic Shoe Industry Volume (K Units) Forecast, by Application 2020 & 2033
- Table 61: Australia Athletic Shoe Industry Revenue (Million) Forecast, by Application 2020 & 2033
- Table 62: Australia Athletic Shoe Industry Volume (K Units) Forecast, by Application 2020 & 2033
- Table 63: Rest of Asia Pacific Athletic Shoe Industry Revenue (Million) Forecast, by Application 2020 & 2033
- Table 64: Rest of Asia Pacific Athletic Shoe Industry Volume (K Units) Forecast, by Application 2020 & 2033
- Table 65: Global Athletic Shoe Industry Revenue Million Forecast, by Product Type 2020 & 2033
- Table 66: Global Athletic Shoe Industry Volume K Units Forecast, by Product Type 2020 & 2033
- Table 67: Global Athletic Shoe Industry Revenue Million Forecast, by End User 2020 & 2033
- Table 68: Global Athletic Shoe Industry Volume K Units Forecast, by End User 2020 & 2033
- Table 69: Global Athletic Shoe Industry Revenue Million Forecast, by Distribution Channel 2020 & 2033
- Table 70: Global Athletic Shoe Industry Volume K Units Forecast, by Distribution Channel 2020 & 2033
- Table 71: Global Athletic Shoe Industry Revenue Million Forecast, by Country 2020 & 2033
- Table 72: Global Athletic Shoe Industry Volume K Units Forecast, by Country 2020 & 2033
- Table 73: Brazil Athletic Shoe Industry Revenue (Million) Forecast, by Application 2020 & 2033
- Table 74: Brazil Athletic Shoe Industry Volume (K Units) Forecast, by Application 2020 & 2033
- Table 75: Argentina Athletic Shoe Industry Revenue (Million) Forecast, by Application 2020 & 2033
- Table 76: Argentina Athletic Shoe Industry Volume (K Units) Forecast, by Application 2020 & 2033
- Table 77: Rest of South America Athletic Shoe Industry Revenue (Million) Forecast, by Application 2020 & 2033
- Table 78: Rest of South America Athletic Shoe Industry Volume (K Units) Forecast, by Application 2020 & 2033
- Table 79: Global Athletic Shoe Industry Revenue Million Forecast, by Product Type 2020 & 2033
- Table 80: Global Athletic Shoe Industry Volume K Units Forecast, by Product Type 2020 & 2033
- Table 81: Global Athletic Shoe Industry Revenue Million Forecast, by End User 2020 & 2033
- Table 82: Global Athletic Shoe Industry Volume K Units Forecast, by End User 2020 & 2033
- Table 83: Global Athletic Shoe Industry Revenue Million Forecast, by Distribution Channel 2020 & 2033
- Table 84: Global Athletic Shoe Industry Volume K Units Forecast, by Distribution Channel 2020 & 2033
- Table 85: Global Athletic Shoe Industry Revenue Million Forecast, by Country 2020 & 2033
- Table 86: Global Athletic Shoe Industry Volume K Units Forecast, by Country 2020 & 2033
- Table 87: Saudi Arabia Athletic Shoe Industry Revenue (Million) Forecast, by Application 2020 & 2033
- Table 88: Saudi Arabia Athletic Shoe Industry Volume (K Units) Forecast, by Application 2020 & 2033
- Table 89: South Africa Athletic Shoe Industry Revenue (Million) Forecast, by Application 2020 & 2033
- Table 90: South Africa Athletic Shoe Industry Volume (K Units) Forecast, by Application 2020 & 2033
- Table 91: Rest of Middle East and Africa Athletic Shoe Industry Revenue (Million) Forecast, by Application 2020 & 2033
- Table 92: Rest of Middle East and Africa Athletic Shoe Industry Volume (K Units) Forecast, by Application 2020 & 2033
Frequently Asked Questions
1. What is the projected Compound Annual Growth Rate (CAGR) of the Athletic Shoe Industry?
The projected CAGR is approximately 6.86%.
2. Which companies are prominent players in the Athletic Shoe Industry?
Key companies in the market include Adidas AG, Columbia Sportswear Company, VF Corporation, SKECHERS USA Inc, Asics Corporation, Puma SE, Under Armour Inc, Nike Inc, New Balance Athletics Inc, Fila.
3. What are the main segments of the Athletic Shoe Industry?
The market segments include Product Type, End User, Distribution Channel.
4. Can you provide details about the market size?
The market size is estimated to be USD 173.89 Million as of 2022.
5. What are some drivers contributing to market growth?
Aggressive Marketing And Strategies By Brands; Enhanced Participation In Recreational And Outdoor/Sports Activities.
6. What are the notable trends driving market growth?
Growing Sports Participation and Influence of Athleisure.
7. Are there any restraints impacting market growth?
Unorganized Footwear Sector And Availability Of Counterfeit Goods.
8. Can you provide examples of recent developments in the market?
June 2024: Nike launched the Converse Run Star Trainer, a low-profile shoe built from the ground up, combining retro and modern aesthetics. The silhouette is inspired by Converse’s deep history in sport but designed for modern life.
9. What pricing options are available for accessing the report?
Pricing options include single-user, multi-user, and enterprise licenses priced at USD 4750, USD 5250, and USD 8750 respectively.
10. Is the market size provided in terms of value or volume?
The market size is provided in terms of value, measured in Million and volume, measured in K Units.
11. Are there any specific market keywords associated with the report?
Yes, the market keyword associated with the report is "Athletic Shoe Industry," which aids in identifying and referencing the specific market segment covered.
12. How do I determine which pricing option suits my needs best?
The pricing options vary based on user requirements and access needs. Individual users may opt for single-user licenses, while businesses requiring broader access may choose multi-user or enterprise licenses for cost-effective access to the report.
13. Are there any additional resources or data provided in the Athletic Shoe Industry report?
While the report offers comprehensive insights, it's advisable to review the specific contents or supplementary materials provided to ascertain if additional resources or data are available.
14. How can I stay updated on further developments or reports in the Athletic Shoe Industry?
To stay informed about further developments, trends, and reports in the Athletic Shoe Industry, consider subscribing to industry newsletters, following relevant companies and organizations, or regularly checking reputable industry news sources and publications.
Methodology
Step 1 - Identification of Relevant Samples Size from Population Database


Step 2 - Approaches for Defining Global Market Size (Value, Volume* & Price*)

Note*: In applicable scenarios
Step 3 - Data Sources
Primary Research
- Web Analytics
- Survey Reports
- Research Institute
- Latest Research Reports
- Opinion Leaders
Secondary Research
- Annual Reports
- White Paper
- Latest Press Release
- Industry Association
- Paid Database
- Investor Presentations

Step 4 - Data Triangulation
Involves using different sources of information in order to increase the validity of a study
These sources are likely to be stakeholders in a program - participants, other researchers, program staff, other community members, and so on.
Then we put all data in single framework & apply various statistical tools to find out the dynamic on the market.
During the analysis stage, feedback from the stakeholder groups would be compared to determine areas of agreement as well as areas of divergence