

Key Insights
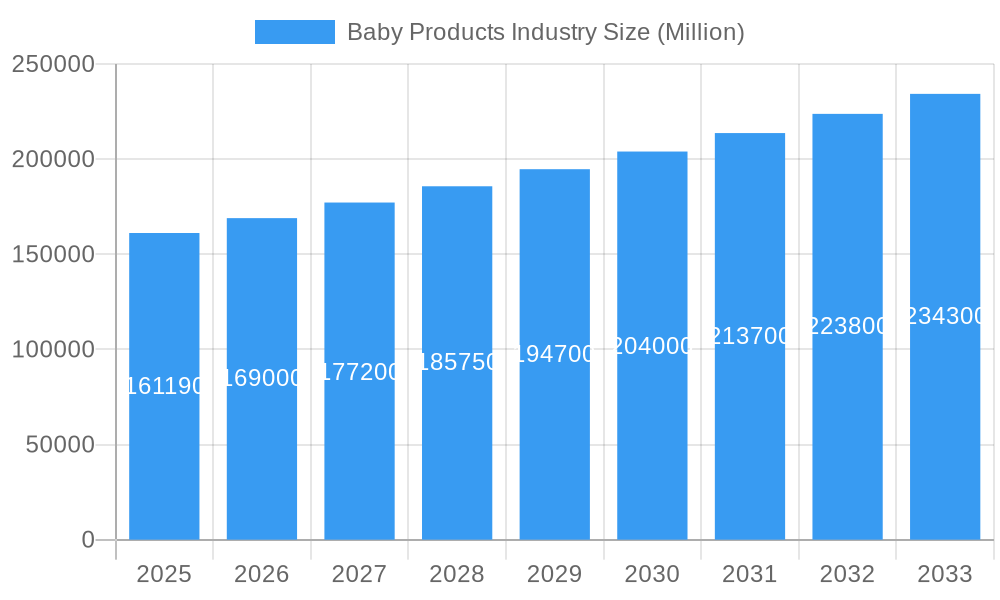
The global baby products market, valued at $161.19 billion in 2025, is projected to experience robust growth, driven by several key factors. Rising disposable incomes in developing economies, coupled with increasing awareness of premium baby care products and their benefits, fuel significant demand. The preference for convenience and the expanding e-commerce sector contribute to the market's expansion, with online retail stores witnessing substantial growth. Furthermore, a growing emphasis on hygiene and the rising prevalence of nuclear families are contributing factors. The market is segmented by distribution channels (supermarkets/hypermarkets leading, followed by online stores experiencing rapid growth) and product types (baby diapers and wipes holding the largest share, driven by consistent demand, while baby skin care and food & beverages segments are also witnessing considerable expansion due to heightened parental awareness of nutrition and skin health). Key players like Unicharm, Abbott, Unilever, and Johnson & Johnson are actively shaping the market through innovation and strategic expansions. While increasing raw material costs and stringent regulatory standards pose challenges, the overall market outlook remains positive, projecting sustained growth over the forecast period.
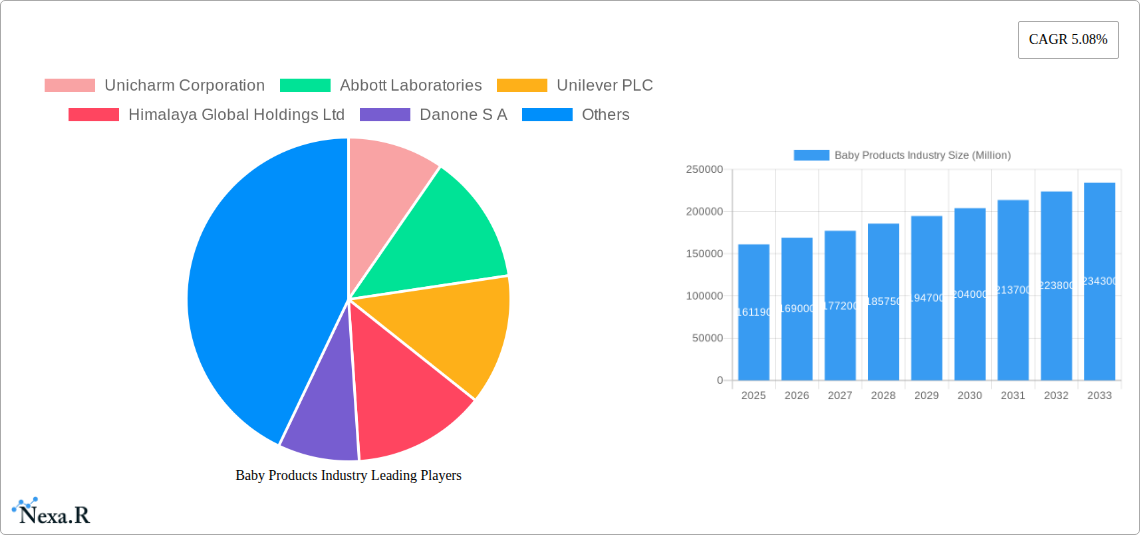
Baby Products Industry Market Size (In Billion)
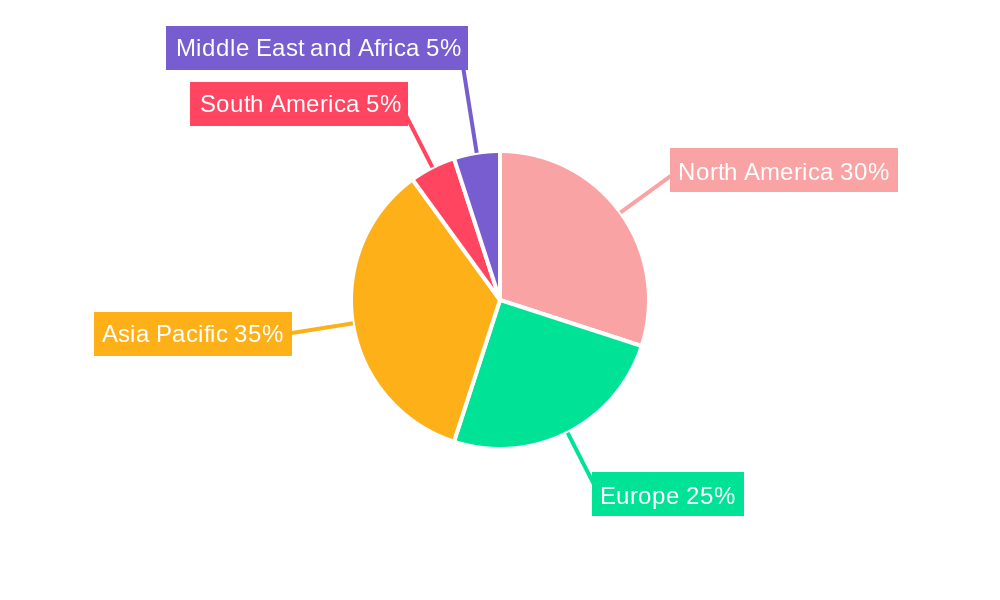
The market's growth trajectory is influenced by regional variations. North America and Europe maintain strong market positions, driven by high per capita incomes and established product penetration. However, the Asia-Pacific region, particularly India and China, is expected to witness the most significant growth, fueled by burgeoning populations and rising middle classes. This growth will be propelled by increased purchasing power, improved healthcare infrastructure, and changing consumer preferences towards premium and specialized baby products. South America and the Middle East & Africa also present promising growth opportunities, although at a potentially slower pace compared to the Asia-Pacific region. Competitive pressures remain significant, with companies focusing on product differentiation, brand building, and strategic acquisitions to maintain market share. The market's future success will hinge on adapting to evolving consumer demands, incorporating sustainable practices, and leveraging digital channels for enhanced market reach.
Baby Products Industry Company Market Share
Baby Products Industry Market Report: 2019-2033
This comprehensive report provides a detailed analysis of the global baby products industry, encompassing market dynamics, growth trends, key players, and future outlook. Covering the period from 2019 to 2033, with a focus on 2025, this report is an invaluable resource for industry professionals, investors, and anyone seeking to understand this dynamic market. The report delves deep into both the parent (manufacturers, retailers) and child (babies and their parents) markets, offering crucial insights into consumer behavior and preferences. Expected market size figures are presented in million units.
Baby Products Industry Market Dynamics & Structure
The baby products market is characterized by a **moderately concentrated structure**, featuring prominent global players like Procter & Gamble, Johnson & Johnson, and Unilever who command significant market share. A key growth engine is **technological innovation**, spurred by the ever-evolving demands for enhanced safety, supreme comfort, and unparalleled convenience for infants and parents alike. The market's trajectory is also significantly influenced by **stringent regulatory frameworks** governing product safety and clear labeling, which necessitate meticulous adherence from manufacturers. Furthermore, the presence and evolving acceptance of **substitute products**, such as the resurgent popularity of cloth diapers and eco-friendly alternatives, introduce a dynamic competitive landscape. Crucially, the market is profoundly shaped by **end-user demographics**, with fluctuating birth rates and evolving parental preferences directly impacting product demand and innovation focus. **Mergers and acquisitions (M&A)** remain a relatively frequent occurrence, indicative of ongoing consolidation efforts and strategic moves towards market expansion and portfolio diversification.
- Market Concentration: Highly concentrated, with the top 5 players projected to hold approximately 60-65% of the global market share in 2024.
- Technological Innovation: A strong emphasis is placed on the development of **sustainable and biodegradable materials**, integration of **smart features** (e.g., real-time monitoring sensors in diapers and feeding devices), and the creation of **personalized and customizable product offerings** tailored to individual baby needs.
- Regulatory Frameworks: Stringent and evolving regulations concerning product safety, material composition, and labeling are geographically diverse, significantly impacting product development lifecycles, marketing strategies, and international market entry.
- Competitive Substitutes: The growing consumer demand for **reusable, organic, and eco-friendly alternatives** is a significant trend, presenting both a challenge and an opportunity for traditional product manufacturers to innovate and adapt.
- End-User Demographics: Global and regional fluctuations in birth rates, coupled with the increasing influence of millennial and Gen Z parents who prioritize health, sustainability, and convenience, are major determinants of demand for specific product categories and features.
- M&A Trends: Approximately 15-20 significant M&A deals were recorded in the baby products sector over the past five years, underscoring active consolidation, strategic acquisitions to gain technological capabilities, and efforts to broaden market reach.
Baby Products Industry Growth Trends & Insights
The global baby products market demonstrated robust growth, registering a Compound Annual Growth Rate (CAGR) of approximately 6.5-7.5% during the historical period (2019-2024), and is estimated to have reached a value of USD 120-130 billion in 2024. This impressive expansion is propelled by several converging factors: rising disposable incomes in burgeoning emerging economies, a heightened global awareness regarding infant hygiene and safety protocols, and the widespread proliferation and increasing sophistication of online retail channels. Furthermore, **technological disruptions**, particularly the innovative introduction of smart baby products and advanced materials, are acting as significant catalysts for market expansion. A notable shift in consumer behavior towards the preference for **premium, specialized, and ethically sourced products**, driven by increased parental investment in their children's well-being, is also shaping market trends. Projections indicate a continued upward trajectory for the market, with an anticipated CAGR of 7.0-8.0% during the forecast period (2025-2033). While market penetration is relatively mature in developed economies, there exists substantial untapped growth potential in developing and emerging markets.
Dominant Regions, Countries, or Segments in Baby Products Industry
The North American and European markets currently dominate the global baby products landscape, exhibiting high consumption levels driven by high disposable incomes and established distribution networks. However, significant growth is anticipated from Asia-Pacific regions, especially China and India, fueled by rapid economic growth and rising birth rates. Within product segments, baby diapers and wipes dominate the market, holding the largest market share in terms of volume, followed by baby food and beverages. Online retail channels are experiencing rapid growth, driven by increased internet penetration and consumer convenience.
- Dominant Regions: North America and Europe (in terms of current market share).
- High-Growth Regions: Asia-Pacific (China and India showing significant growth potential).
- Dominant Product Segments: Baby diapers and wipes, followed by baby food and beverages.
- Fastest-Growing Distribution Channel: Online retail stores.
- Key Growth Drivers: Increasing birth rates in developing economies, rising disposable incomes, and evolving consumer preferences.
Baby Products Industry Product Landscape
The baby products market is characterized by continuous innovation, with manufacturers focusing on enhanced functionality, safety, and sustainability. New product features include improved absorbency in diapers, hypoallergenic formulations in skincare products, and convenient packaging solutions. Technological advancements include the integration of smart sensors and connected features in some baby products. Unique selling propositions (USPs) often revolve around eco-friendly materials, organic ingredients, or specialized functionalities catering to specific needs (e.g., sensitive skin).
Key Drivers, Barriers & Challenges in Baby Products Industry
Key Drivers: The primary growth drivers include the sustained increase in disposable incomes, particularly within developing economies, leading to greater consumer spending on baby care. A heightened global emphasis on infant hygiene and safety standards, alongside continuous technological advancements in product design and manufacturing processes, also fuels demand. The burgeoning popularity and accessibility of online retail channels have revolutionized purchasing habits. Additionally, supportive government initiatives aimed at promoting child welfare and development contribute positively to market expansion.
Key Challenges & Restraints: Significant challenges include the inherent volatility in raw material prices, which can impact manufacturing costs and product pricing. Navigating and ensuring compliance with stringent and diverse regulatory requirements across different geographical regions poses a complex hurdle. Intense competition among established global players and the emergence of agile new entrants create a dynamic and demanding market landscape. The potential for disruptive technologies to fundamentally alter existing product categories and consumer preferences also presents a significant challenge. Furthermore, supply chain disruptions, as evidenced by recent global events, can lead to stock shortages, increased lead times, and PRICE volatility, impacting overall market stability and growth.
Emerging Opportunities in Baby Products Industry
Untapped markets in developing economies offer significant growth potential. Opportunities also exist in specialized product segments catering to niche consumer needs (e.g., organic products, products for babies with allergies). The growing adoption of e-commerce provides an avenue for market expansion, while the integration of smart technologies and personalized solutions offers exciting possibilities for innovation. Focus on sustainability and eco-friendly packaging will also continue to shape future trends.
Growth Accelerators in the Baby Products Industry
Technological breakthroughs in materials science, particularly in the development of sustainable, biodegradable, and hypoallergenic materials, are significant growth catalysts, aligning with increasing consumer demand for eco-conscious products. Strategic partnerships and collaborations between innovative manufacturers and large-scale retailers are crucial for enhancing product distribution, expanding market reach, and optimizing supply chain efficiency. Proactive market expansion strategies, focusing on untapped emerging economies and the development of novel product categories that address unmet needs, are vital for accelerating industry growth and capturing new market segments.
Key Players Shaping the Baby Products Industry Market
- Unicharm Corporation
- Abbott Laboratories
- Unilever PLC
- Himalaya Global Holdings Ltd
- Danone S A
- Kimberly-Clark Corporation
- Johnson & Johnson
- Procter & Gamble Company
- Royal Frieslandcampina N V
- Nestlé S A
Notable Milestones in Baby Products Industry Sector
- January 2024: Pampers launched a new Pampers Premium Care Diaper – a 360-degree coverage all-in-one diaper for babies with an inbuilt anti-rash blanket and aloe vera lotion.
- January 2024: Procter & Gamble Korea launched Pampers Baby-Dry Pants, a diaper designed for enhanced absorbency.
- February 2024: MamyPoko Pants launched Extra Absorb Pants with 30+ patented technologies, claiming up to 60% increased absorbency.
In-Depth Baby Products Industry Market Outlook
The baby products industry is exceptionally well-positioned for continued robust growth, underpinned by favorable demographic trends such as rising birth rates in specific regions, a steady increase in disposable incomes globally, and a relentless pace of product innovation. Strategic opportunities abound in effectively expanding into high-potential emerging markets, pioneering the development of sustainable and technologically advanced products that offer superior safety and convenience, and adeptly leveraging digital marketing channels and e-commerce platforms to engage and reach target consumers more effectively. The overarching trends of premiumization, hyper-personalization, and a strong commitment to sustainability will collectively shape the future landscape and competitive dynamics of this dynamic and essential market.
Baby Products Industry Segmentation
-
1. Product Type
- 1.1. Baby Skin Care
- 1.2. Baby Hair Care
-
1.3. Baby Toiletries
- 1.3.1. Baby Bath Products and Fragrances
- 1.3.2. Baby Diapers and Wipes
- 1.4. Baby Food and Beverages
-
2. Distribution Channel
- 2.1. Supermarkets/Hypermarkets
- 2.2. Convenience Stores
- 2.3. Pharmacies/Drug Stores
- 2.4. Online Retail Stores
- 2.5. Other Distribution Channels
Baby Products Industry Segmentation By Geography
-
1. North America
- 1.1. United States
- 1.2. Canada
- 1.3. Mexico
- 1.4. Rest of North America
-
2. Europe
- 2.1. United Kingdom
- 2.2. Germany
- 2.3. Spain
- 2.4. France
- 2.5. Italy
- 2.6. Russia
- 2.7. Rest of Europe
-
3. Asia Pacific
- 3.1. China
- 3.2. Japan
- 3.3. India
- 3.4. Australia
- 3.5. Rest of Asia Pacific
-
4. South America
- 4.1. Brazil
- 4.2. Argentina
- 4.3. Rest of South America
-
5. Middle East and Africa
- 5.1. South Africa
- 5.2. Saudi Arabia
- 5.3. Rest of Middle East and Africa
Baby Products Industry Regional Market Share
Geographic Coverage of Baby Products Industry
Baby Products Industry REPORT HIGHLIGHTS
| Aspects | Details |
|---|---|
| Study Period | 2020-2034 |
| Base Year | 2025 |
| Estimated Year | 2026 |
| Forecast Period | 2026-2034 |
| Historical Period | 2020-2025 |
| Growth Rate | CAGR of 5.08% from 2020-2034 |
| Segmentation |
|
Table of Contents
- 1. Introduction
- 1.1. Research Scope
- 1.2. Market Segmentation
- 1.3. Research Objective
- 1.4. Definitions and Assumptions
- 2. Executive Summary
- 2.1. Market Snapshot
- 3. Market Dynamics
- 3.1. Market Drivers
- 3.2. Market Restrains
- 3.3. Market Trends
- 3.4. Market Opportunities
- 4. Market Factor Analysis
- 4.1. Porters Five Forces
- 4.1.1. Bargaining Power of Suppliers
- 4.1.2. Bargaining Power of Buyers
- 4.1.3. Threat of New Entrants
- 4.1.4. Threat of Substitutes
- 4.1.5. Competitive Rivalry
- 4.2. PESTEL analysis
- 4.3. BCG Analysis
- 4.3.1. Stars (High Growth, High Market Share)
- 4.3.2. Cash Cows (Low Growth, High Market Share)
- 4.3.3. Question Mark (High Growth, Low Market Share)
- 4.3.4. Dogs (Low Growth, Low Market Share)
- 4.4. Ansoff Matrix Analysis
- 4.5. Supply Chain Analysis
- 4.6. Regulatory Landscape
- 4.7. Current Market Potential and Opportunity Assessment (TAM–SAM–SOM Framework)
- 4.8. NRP Analyst Note
- 4.1. Porters Five Forces
- 5. Market Analysis, Insights and Forecast 2021-2033
- 5.1. Market Analysis, Insights and Forecast - by Product Type
- 5.1.1. Baby Skin Care
- 5.1.2. Baby Hair Care
- 5.1.3. Baby Toiletries
- 5.1.3.1. Baby Bath Products and Fragrances
- 5.1.3.2. Baby Diapers and Wipes
- 5.1.4. Baby Food and Beverages
- 5.2. Market Analysis, Insights and Forecast - by Distribution Channel
- 5.2.1. Supermarkets/Hypermarkets
- 5.2.2. Convenience Stores
- 5.2.3. Pharmacies/Drug Stores
- 5.2.4. Online Retail Stores
- 5.2.5. Other Distribution Channels
- 5.3. Market Analysis, Insights and Forecast - by Region
- 5.3.1. North America
- 5.3.2. Europe
- 5.3.3. Asia Pacific
- 5.3.4. South America
- 5.3.5. Middle East and Africa
- 5.1. Market Analysis, Insights and Forecast - by Product Type
- 6. Global Baby Products Industry Analysis, Insights and Forecast, 2021-2033
- 6.1. Market Analysis, Insights and Forecast - by Product Type
- 6.1.1. Baby Skin Care
- 6.1.2. Baby Hair Care
- 6.1.3. Baby Toiletries
- 6.1.3.1. Baby Bath Products and Fragrances
- 6.1.3.2. Baby Diapers and Wipes
- 6.1.4. Baby Food and Beverages
- 6.2. Market Analysis, Insights and Forecast - by Distribution Channel
- 6.2.1. Supermarkets/Hypermarkets
- 6.2.2. Convenience Stores
- 6.2.3. Pharmacies/Drug Stores
- 6.2.4. Online Retail Stores
- 6.2.5. Other Distribution Channels
- 6.1. Market Analysis, Insights and Forecast - by Product Type
- 7. North America Baby Products Industry Analysis, Insights and Forecast, 2020-2032
- 7.1. Market Analysis, Insights and Forecast - by Product Type
- 7.1.1. Baby Skin Care
- 7.1.2. Baby Hair Care
- 7.1.3. Baby Toiletries
- 7.1.3.1. Baby Bath Products and Fragrances
- 7.1.3.2. Baby Diapers and Wipes
- 7.1.4. Baby Food and Beverages
- 7.2. Market Analysis, Insights and Forecast - by Distribution Channel
- 7.2.1. Supermarkets/Hypermarkets
- 7.2.2. Convenience Stores
- 7.2.3. Pharmacies/Drug Stores
- 7.2.4. Online Retail Stores
- 7.2.5. Other Distribution Channels
- 7.1. Market Analysis, Insights and Forecast - by Product Type
- 8. Europe Baby Products Industry Analysis, Insights and Forecast, 2020-2032
- 8.1. Market Analysis, Insights and Forecast - by Product Type
- 8.1.1. Baby Skin Care
- 8.1.2. Baby Hair Care
- 8.1.3. Baby Toiletries
- 8.1.3.1. Baby Bath Products and Fragrances
- 8.1.3.2. Baby Diapers and Wipes
- 8.1.4. Baby Food and Beverages
- 8.2. Market Analysis, Insights and Forecast - by Distribution Channel
- 8.2.1. Supermarkets/Hypermarkets
- 8.2.2. Convenience Stores
- 8.2.3. Pharmacies/Drug Stores
- 8.2.4. Online Retail Stores
- 8.2.5. Other Distribution Channels
- 8.1. Market Analysis, Insights and Forecast - by Product Type
- 9. Asia Pacific Baby Products Industry Analysis, Insights and Forecast, 2020-2032
- 9.1. Market Analysis, Insights and Forecast - by Product Type
- 9.1.1. Baby Skin Care
- 9.1.2. Baby Hair Care
- 9.1.3. Baby Toiletries
- 9.1.3.1. Baby Bath Products and Fragrances
- 9.1.3.2. Baby Diapers and Wipes
- 9.1.4. Baby Food and Beverages
- 9.2. Market Analysis, Insights and Forecast - by Distribution Channel
- 9.2.1. Supermarkets/Hypermarkets
- 9.2.2. Convenience Stores
- 9.2.3. Pharmacies/Drug Stores
- 9.2.4. Online Retail Stores
- 9.2.5. Other Distribution Channels
- 9.1. Market Analysis, Insights and Forecast - by Product Type
- 10. South America Baby Products Industry Analysis, Insights and Forecast, 2020-2032
- 10.1. Market Analysis, Insights and Forecast - by Product Type
- 10.1.1. Baby Skin Care
- 10.1.2. Baby Hair Care
- 10.1.3. Baby Toiletries
- 10.1.3.1. Baby Bath Products and Fragrances
- 10.1.3.2. Baby Diapers and Wipes
- 10.1.4. Baby Food and Beverages
- 10.2. Market Analysis, Insights and Forecast - by Distribution Channel
- 10.2.1. Supermarkets/Hypermarkets
- 10.2.2. Convenience Stores
- 10.2.3. Pharmacies/Drug Stores
- 10.2.4. Online Retail Stores
- 10.2.5. Other Distribution Channels
- 10.1. Market Analysis, Insights and Forecast - by Product Type
- 11. Middle East and Africa Baby Products Industry Analysis, Insights and Forecast, 2020-2032
- 11.1. Market Analysis, Insights and Forecast - by Product Type
- 11.1.1. Baby Skin Care
- 11.1.2. Baby Hair Care
- 11.1.3. Baby Toiletries
- 11.1.3.1. Baby Bath Products and Fragrances
- 11.1.3.2. Baby Diapers and Wipes
- 11.1.4. Baby Food and Beverages
- 11.2. Market Analysis, Insights and Forecast - by Distribution Channel
- 11.2.1. Supermarkets/Hypermarkets
- 11.2.2. Convenience Stores
- 11.2.3. Pharmacies/Drug Stores
- 11.2.4. Online Retail Stores
- 11.2.5. Other Distribution Channels
- 11.1. Market Analysis, Insights and Forecast - by Product Type
- 12. Competitive Analysis
- 12.1. Company Profiles
- 12.1.1 Unicharm Corporation
- 12.1.1.1. Company Overview
- 12.1.1.2. Products
- 12.1.1.3. Company Financials
- 12.1.1.4. SWOT Analysis
- 12.1.2 Abbott Laboratories
- 12.1.2.1. Company Overview
- 12.1.2.2. Products
- 12.1.2.3. Company Financials
- 12.1.2.4. SWOT Analysis
- 12.1.3 Unilever PLC
- 12.1.3.1. Company Overview
- 12.1.3.2. Products
- 12.1.3.3. Company Financials
- 12.1.3.4. SWOT Analysis
- 12.1.4 Himalaya Global Holdings Ltd
- 12.1.4.1. Company Overview
- 12.1.4.2. Products
- 12.1.4.3. Company Financials
- 12.1.4.4. SWOT Analysis
- 12.1.5 Danone S A
- 12.1.5.1. Company Overview
- 12.1.5.2. Products
- 12.1.5.3. Company Financials
- 12.1.5.4. SWOT Analysis
- 12.1.6 Kimberly-Clark Corporation
- 12.1.6.1. Company Overview
- 12.1.6.2. Products
- 12.1.6.3. Company Financials
- 12.1.6.4. SWOT Analysis
- 12.1.7 Johnson & Johnson
- 12.1.7.1. Company Overview
- 12.1.7.2. Products
- 12.1.7.3. Company Financials
- 12.1.7.4. SWOT Analysis
- 12.1.8 Procter & Gamble Company
- 12.1.8.1. Company Overview
- 12.1.8.2. Products
- 12.1.8.3. Company Financials
- 12.1.8.4. SWOT Analysis
- 12.1.9 Royal Frieslandcampina N V *List Not Exhaustive
- 12.1.9.1. Company Overview
- 12.1.9.2. Products
- 12.1.9.3. Company Financials
- 12.1.9.4. SWOT Analysis
- 12.1.10 Nestlé S A
- 12.1.10.1. Company Overview
- 12.1.10.2. Products
- 12.1.10.3. Company Financials
- 12.1.10.4. SWOT Analysis
- 12.1.1 Unicharm Corporation
- 12.2. Market Entropy
- 12.2.1 Company's Key Areas Served
- 12.2.2 Recent Developments
- 12.3. Company Market Share Analysis 2025
- 12.3.1 Top 5 Companies Market Share Analysis
- 12.3.2 Top 3 Companies Market Share Analysis
- 12.4. List of Potential Customers
- 13. Research Methodology
List of Figures
- Figure 1: Global Baby Products Industry Revenue Breakdown (Million, %) by Region 2025 & 2033
- Figure 2: Global Baby Products Industry Volume Breakdown (K Units, %) by Region 2025 & 2033
- Figure 3: North America Baby Products Industry Revenue (Million), by Product Type 2025 & 2033
- Figure 4: North America Baby Products Industry Volume (K Units), by Product Type 2025 & 2033
- Figure 5: North America Baby Products Industry Revenue Share (%), by Product Type 2025 & 2033
- Figure 6: North America Baby Products Industry Volume Share (%), by Product Type 2025 & 2033
- Figure 7: North America Baby Products Industry Revenue (Million), by Distribution Channel 2025 & 2033
- Figure 8: North America Baby Products Industry Volume (K Units), by Distribution Channel 2025 & 2033
- Figure 9: North America Baby Products Industry Revenue Share (%), by Distribution Channel 2025 & 2033
- Figure 10: North America Baby Products Industry Volume Share (%), by Distribution Channel 2025 & 2033
- Figure 11: North America Baby Products Industry Revenue (Million), by Country 2025 & 2033
- Figure 12: North America Baby Products Industry Volume (K Units), by Country 2025 & 2033
- Figure 13: North America Baby Products Industry Revenue Share (%), by Country 2025 & 2033
- Figure 14: North America Baby Products Industry Volume Share (%), by Country 2025 & 2033
- Figure 15: Europe Baby Products Industry Revenue (Million), by Product Type 2025 & 2033
- Figure 16: Europe Baby Products Industry Volume (K Units), by Product Type 2025 & 2033
- Figure 17: Europe Baby Products Industry Revenue Share (%), by Product Type 2025 & 2033
- Figure 18: Europe Baby Products Industry Volume Share (%), by Product Type 2025 & 2033
- Figure 19: Europe Baby Products Industry Revenue (Million), by Distribution Channel 2025 & 2033
- Figure 20: Europe Baby Products Industry Volume (K Units), by Distribution Channel 2025 & 2033
- Figure 21: Europe Baby Products Industry Revenue Share (%), by Distribution Channel 2025 & 2033
- Figure 22: Europe Baby Products Industry Volume Share (%), by Distribution Channel 2025 & 2033
- Figure 23: Europe Baby Products Industry Revenue (Million), by Country 2025 & 2033
- Figure 24: Europe Baby Products Industry Volume (K Units), by Country 2025 & 2033
- Figure 25: Europe Baby Products Industry Revenue Share (%), by Country 2025 & 2033
- Figure 26: Europe Baby Products Industry Volume Share (%), by Country 2025 & 2033
- Figure 27: Asia Pacific Baby Products Industry Revenue (Million), by Product Type 2025 & 2033
- Figure 28: Asia Pacific Baby Products Industry Volume (K Units), by Product Type 2025 & 2033
- Figure 29: Asia Pacific Baby Products Industry Revenue Share (%), by Product Type 2025 & 2033
- Figure 30: Asia Pacific Baby Products Industry Volume Share (%), by Product Type 2025 & 2033
- Figure 31: Asia Pacific Baby Products Industry Revenue (Million), by Distribution Channel 2025 & 2033
- Figure 32: Asia Pacific Baby Products Industry Volume (K Units), by Distribution Channel 2025 & 2033
- Figure 33: Asia Pacific Baby Products Industry Revenue Share (%), by Distribution Channel 2025 & 2033
- Figure 34: Asia Pacific Baby Products Industry Volume Share (%), by Distribution Channel 2025 & 2033
- Figure 35: Asia Pacific Baby Products Industry Revenue (Million), by Country 2025 & 2033
- Figure 36: Asia Pacific Baby Products Industry Volume (K Units), by Country 2025 & 2033
- Figure 37: Asia Pacific Baby Products Industry Revenue Share (%), by Country 2025 & 2033
- Figure 38: Asia Pacific Baby Products Industry Volume Share (%), by Country 2025 & 2033
- Figure 39: South America Baby Products Industry Revenue (Million), by Product Type 2025 & 2033
- Figure 40: South America Baby Products Industry Volume (K Units), by Product Type 2025 & 2033
- Figure 41: South America Baby Products Industry Revenue Share (%), by Product Type 2025 & 2033
- Figure 42: South America Baby Products Industry Volume Share (%), by Product Type 2025 & 2033
- Figure 43: South America Baby Products Industry Revenue (Million), by Distribution Channel 2025 & 2033
- Figure 44: South America Baby Products Industry Volume (K Units), by Distribution Channel 2025 & 2033
- Figure 45: South America Baby Products Industry Revenue Share (%), by Distribution Channel 2025 & 2033
- Figure 46: South America Baby Products Industry Volume Share (%), by Distribution Channel 2025 & 2033
- Figure 47: South America Baby Products Industry Revenue (Million), by Country 2025 & 2033
- Figure 48: South America Baby Products Industry Volume (K Units), by Country 2025 & 2033
- Figure 49: South America Baby Products Industry Revenue Share (%), by Country 2025 & 2033
- Figure 50: South America Baby Products Industry Volume Share (%), by Country 2025 & 2033
- Figure 51: Middle East and Africa Baby Products Industry Revenue (Million), by Product Type 2025 & 2033
- Figure 52: Middle East and Africa Baby Products Industry Volume (K Units), by Product Type 2025 & 2033
- Figure 53: Middle East and Africa Baby Products Industry Revenue Share (%), by Product Type 2025 & 2033
- Figure 54: Middle East and Africa Baby Products Industry Volume Share (%), by Product Type 2025 & 2033
- Figure 55: Middle East and Africa Baby Products Industry Revenue (Million), by Distribution Channel 2025 & 2033
- Figure 56: Middle East and Africa Baby Products Industry Volume (K Units), by Distribution Channel 2025 & 2033
- Figure 57: Middle East and Africa Baby Products Industry Revenue Share (%), by Distribution Channel 2025 & 2033
- Figure 58: Middle East and Africa Baby Products Industry Volume Share (%), by Distribution Channel 2025 & 2033
- Figure 59: Middle East and Africa Baby Products Industry Revenue (Million), by Country 2025 & 2033
- Figure 60: Middle East and Africa Baby Products Industry Volume (K Units), by Country 2025 & 2033
- Figure 61: Middle East and Africa Baby Products Industry Revenue Share (%), by Country 2025 & 2033
- Figure 62: Middle East and Africa Baby Products Industry Volume Share (%), by Country 2025 & 2033
List of Tables
- Table 1: Global Baby Products Industry Revenue Million Forecast, by Product Type 2020 & 2033
- Table 2: Global Baby Products Industry Volume K Units Forecast, by Product Type 2020 & 2033
- Table 3: Global Baby Products Industry Revenue Million Forecast, by Distribution Channel 2020 & 2033
- Table 4: Global Baby Products Industry Volume K Units Forecast, by Distribution Channel 2020 & 2033
- Table 5: Global Baby Products Industry Revenue Million Forecast, by Region 2020 & 2033
- Table 6: Global Baby Products Industry Volume K Units Forecast, by Region 2020 & 2033
- Table 7: Global Baby Products Industry Revenue Million Forecast, by Product Type 2020 & 2033
- Table 8: Global Baby Products Industry Volume K Units Forecast, by Product Type 2020 & 2033
- Table 9: Global Baby Products Industry Revenue Million Forecast, by Distribution Channel 2020 & 2033
- Table 10: Global Baby Products Industry Volume K Units Forecast, by Distribution Channel 2020 & 2033
- Table 11: Global Baby Products Industry Revenue Million Forecast, by Country 2020 & 2033
- Table 12: Global Baby Products Industry Volume K Units Forecast, by Country 2020 & 2033
- Table 13: United States Baby Products Industry Revenue (Million) Forecast, by Application 2020 & 2033
- Table 14: United States Baby Products Industry Volume (K Units) Forecast, by Application 2020 & 2033
- Table 15: Canada Baby Products Industry Revenue (Million) Forecast, by Application 2020 & 2033
- Table 16: Canada Baby Products Industry Volume (K Units) Forecast, by Application 2020 & 2033
- Table 17: Mexico Baby Products Industry Revenue (Million) Forecast, by Application 2020 & 2033
- Table 18: Mexico Baby Products Industry Volume (K Units) Forecast, by Application 2020 & 2033
- Table 19: Rest of North America Baby Products Industry Revenue (Million) Forecast, by Application 2020 & 2033
- Table 20: Rest of North America Baby Products Industry Volume (K Units) Forecast, by Application 2020 & 2033
- Table 21: Global Baby Products Industry Revenue Million Forecast, by Product Type 2020 & 2033
- Table 22: Global Baby Products Industry Volume K Units Forecast, by Product Type 2020 & 2033
- Table 23: Global Baby Products Industry Revenue Million Forecast, by Distribution Channel 2020 & 2033
- Table 24: Global Baby Products Industry Volume K Units Forecast, by Distribution Channel 2020 & 2033
- Table 25: Global Baby Products Industry Revenue Million Forecast, by Country 2020 & 2033
- Table 26: Global Baby Products Industry Volume K Units Forecast, by Country 2020 & 2033
- Table 27: United Kingdom Baby Products Industry Revenue (Million) Forecast, by Application 2020 & 2033
- Table 28: United Kingdom Baby Products Industry Volume (K Units) Forecast, by Application 2020 & 2033
- Table 29: Germany Baby Products Industry Revenue (Million) Forecast, by Application 2020 & 2033
- Table 30: Germany Baby Products Industry Volume (K Units) Forecast, by Application 2020 & 2033
- Table 31: Spain Baby Products Industry Revenue (Million) Forecast, by Application 2020 & 2033
- Table 32: Spain Baby Products Industry Volume (K Units) Forecast, by Application 2020 & 2033
- Table 33: France Baby Products Industry Revenue (Million) Forecast, by Application 2020 & 2033
- Table 34: France Baby Products Industry Volume (K Units) Forecast, by Application 2020 & 2033
- Table 35: Italy Baby Products Industry Revenue (Million) Forecast, by Application 2020 & 2033
- Table 36: Italy Baby Products Industry Volume (K Units) Forecast, by Application 2020 & 2033
- Table 37: Russia Baby Products Industry Revenue (Million) Forecast, by Application 2020 & 2033
- Table 38: Russia Baby Products Industry Volume (K Units) Forecast, by Application 2020 & 2033
- Table 39: Rest of Europe Baby Products Industry Revenue (Million) Forecast, by Application 2020 & 2033
- Table 40: Rest of Europe Baby Products Industry Volume (K Units) Forecast, by Application 2020 & 2033
- Table 41: Global Baby Products Industry Revenue Million Forecast, by Product Type 2020 & 2033
- Table 42: Global Baby Products Industry Volume K Units Forecast, by Product Type 2020 & 2033
- Table 43: Global Baby Products Industry Revenue Million Forecast, by Distribution Channel 2020 & 2033
- Table 44: Global Baby Products Industry Volume K Units Forecast, by Distribution Channel 2020 & 2033
- Table 45: Global Baby Products Industry Revenue Million Forecast, by Country 2020 & 2033
- Table 46: Global Baby Products Industry Volume K Units Forecast, by Country 2020 & 2033
- Table 47: China Baby Products Industry Revenue (Million) Forecast, by Application 2020 & 2033
- Table 48: China Baby Products Industry Volume (K Units) Forecast, by Application 2020 & 2033
- Table 49: Japan Baby Products Industry Revenue (Million) Forecast, by Application 2020 & 2033
- Table 50: Japan Baby Products Industry Volume (K Units) Forecast, by Application 2020 & 2033
- Table 51: India Baby Products Industry Revenue (Million) Forecast, by Application 2020 & 2033
- Table 52: India Baby Products Industry Volume (K Units) Forecast, by Application 2020 & 2033
- Table 53: Australia Baby Products Industry Revenue (Million) Forecast, by Application 2020 & 2033
- Table 54: Australia Baby Products Industry Volume (K Units) Forecast, by Application 2020 & 2033
- Table 55: Rest of Asia Pacific Baby Products Industry Revenue (Million) Forecast, by Application 2020 & 2033
- Table 56: Rest of Asia Pacific Baby Products Industry Volume (K Units) Forecast, by Application 2020 & 2033
- Table 57: Global Baby Products Industry Revenue Million Forecast, by Product Type 2020 & 2033
- Table 58: Global Baby Products Industry Volume K Units Forecast, by Product Type 2020 & 2033
- Table 59: Global Baby Products Industry Revenue Million Forecast, by Distribution Channel 2020 & 2033
- Table 60: Global Baby Products Industry Volume K Units Forecast, by Distribution Channel 2020 & 2033
- Table 61: Global Baby Products Industry Revenue Million Forecast, by Country 2020 & 2033
- Table 62: Global Baby Products Industry Volume K Units Forecast, by Country 2020 & 2033
- Table 63: Brazil Baby Products Industry Revenue (Million) Forecast, by Application 2020 & 2033
- Table 64: Brazil Baby Products Industry Volume (K Units) Forecast, by Application 2020 & 2033
- Table 65: Argentina Baby Products Industry Revenue (Million) Forecast, by Application 2020 & 2033
- Table 66: Argentina Baby Products Industry Volume (K Units) Forecast, by Application 2020 & 2033
- Table 67: Rest of South America Baby Products Industry Revenue (Million) Forecast, by Application 2020 & 2033
- Table 68: Rest of South America Baby Products Industry Volume (K Units) Forecast, by Application 2020 & 2033
- Table 69: Global Baby Products Industry Revenue Million Forecast, by Product Type 2020 & 2033
- Table 70: Global Baby Products Industry Volume K Units Forecast, by Product Type 2020 & 2033
- Table 71: Global Baby Products Industry Revenue Million Forecast, by Distribution Channel 2020 & 2033
- Table 72: Global Baby Products Industry Volume K Units Forecast, by Distribution Channel 2020 & 2033
- Table 73: Global Baby Products Industry Revenue Million Forecast, by Country 2020 & 2033
- Table 74: Global Baby Products Industry Volume K Units Forecast, by Country 2020 & 2033
- Table 75: South Africa Baby Products Industry Revenue (Million) Forecast, by Application 2020 & 2033
- Table 76: South Africa Baby Products Industry Volume (K Units) Forecast, by Application 2020 & 2033
- Table 77: Saudi Arabia Baby Products Industry Revenue (Million) Forecast, by Application 2020 & 2033
- Table 78: Saudi Arabia Baby Products Industry Volume (K Units) Forecast, by Application 2020 & 2033
- Table 79: Rest of Middle East and Africa Baby Products Industry Revenue (Million) Forecast, by Application 2020 & 2033
- Table 80: Rest of Middle East and Africa Baby Products Industry Volume (K Units) Forecast, by Application 2020 & 2033
Frequently Asked Questions
1. What is the projected Compound Annual Growth Rate (CAGR) of the Baby Products Industry?
The projected CAGR is approximately 5.08%.
2. Which companies are prominent players in the Baby Products Industry?
Key companies in the market include Unicharm Corporation, Abbott Laboratories, Unilever PLC, Himalaya Global Holdings Ltd, Danone S A, Kimberly-Clark Corporation, Johnson & Johnson, Procter & Gamble Company, Royal Frieslandcampina N V *List Not Exhaustive, Nestlé S A.
3. What are the main segments of the Baby Products Industry?
The market segments include Product Type, Distribution Channel.
4. Can you provide details about the market size?
The market size is estimated to be USD 161.19 Million as of 2022.
5. What are some drivers contributing to market growth?
Concerns Among Parents Toward Baby Personal Care and Hygiene; Influence of Endorsements and Aggressive Marketing.
6. What are the notable trends driving market growth?
Increasing Preference for Fortified Baby Food.
7. Are there any restraints impacting market growth?
Presence of Counterfeit Products.
8. Can you provide examples of recent developments in the market?
February 2024: MamyPoko Pants launched Extra Absorb Pants with 30+ patented technologies. The diapers are claimed to be up to 60% absorbent.
9. What pricing options are available for accessing the report?
Pricing options include single-user, multi-user, and enterprise licenses priced at USD 4750, USD 5250, and USD 8750 respectively.
10. Is the market size provided in terms of value or volume?
The market size is provided in terms of value, measured in Million and volume, measured in K Units.
11. Are there any specific market keywords associated with the report?
Yes, the market keyword associated with the report is "Baby Products Industry," which aids in identifying and referencing the specific market segment covered.
12. How do I determine which pricing option suits my needs best?
The pricing options vary based on user requirements and access needs. Individual users may opt for single-user licenses, while businesses requiring broader access may choose multi-user or enterprise licenses for cost-effective access to the report.
13. Are there any additional resources or data provided in the Baby Products Industry report?
While the report offers comprehensive insights, it's advisable to review the specific contents or supplementary materials provided to ascertain if additional resources or data are available.
14. How can I stay updated on further developments or reports in the Baby Products Industry?
To stay informed about further developments, trends, and reports in the Baby Products Industry, consider subscribing to industry newsletters, following relevant companies and organizations, or regularly checking reputable industry news sources and publications.
Methodology
Step 1 - Identification of Relevant Samples Size from Population Database


Step 2 - Approaches for Defining Global Market Size (Value, Volume* & Price*)

Note*: In applicable scenarios
Step 3 - Data Sources
Primary Research
- Web Analytics
- Survey Reports
- Research Institute
- Latest Research Reports
- Opinion Leaders
Secondary Research
- Annual Reports
- White Paper
- Latest Press Release
- Industry Association
- Paid Database
- Investor Presentations

Step 4 - Data Triangulation
Involves using different sources of information in order to increase the validity of a study
These sources are likely to be stakeholders in a program - participants, other researchers, program staff, other community members, and so on.
Then we put all data in single framework & apply various statistical tools to find out the dynamic on the market.
During the analysis stage, feedback from the stakeholder groups would be compared to determine areas of agreement as well as areas of divergence