

Key Insights
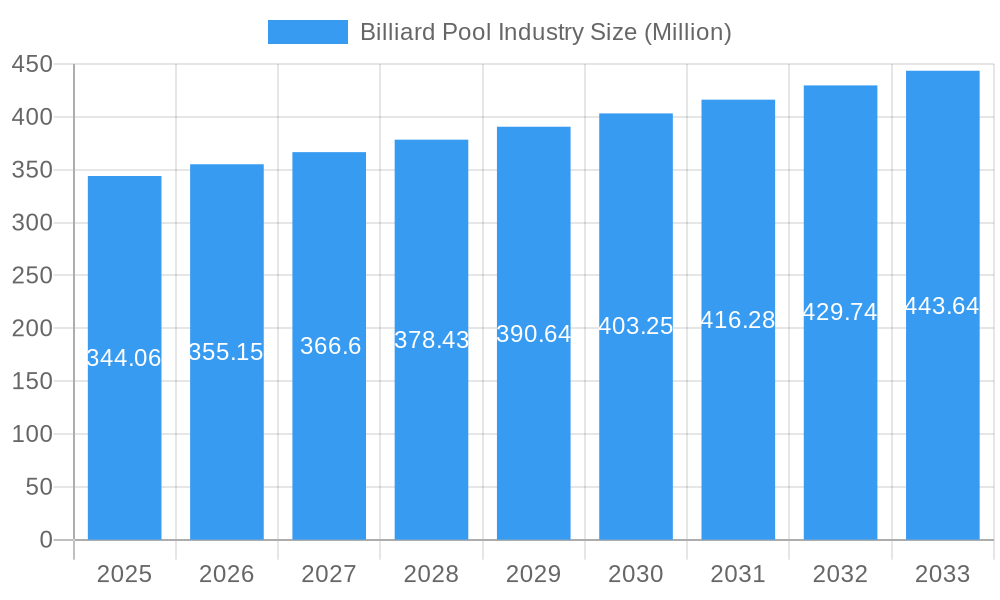
The global billiard pool industry, valued at $344.06 million in 2025, is projected to experience steady growth with a Compound Annual Growth Rate (CAGR) of 2.93% from 2025 to 2033. This growth is fueled by several key drivers. Increasing disposable incomes in developing economies are leading to higher participation in recreational activities like billiards, expanding the market's consumer base. The rise of online retail channels provides easier access to equipment and games, fostering convenience and driving sales. Furthermore, the growing popularity of competitive billiards, fueled by televised tournaments and online gaming communities, is boosting demand for high-quality tables, cues, and accessories. While the industry faces challenges like the high initial investment costs associated with purchasing equipment, particularly professional-grade tables, these are largely offset by the enduring appeal of the game and the ongoing innovation in table designs and accessories which enhance the overall playing experience. The segment breakdown reveals a diverse market, with carom, pool, and snooker tables commanding significant shares, alongside a substantial demand for cues and other equipment. Offline retail stores continue to dominate distribution, but online sales are progressively gaining traction.
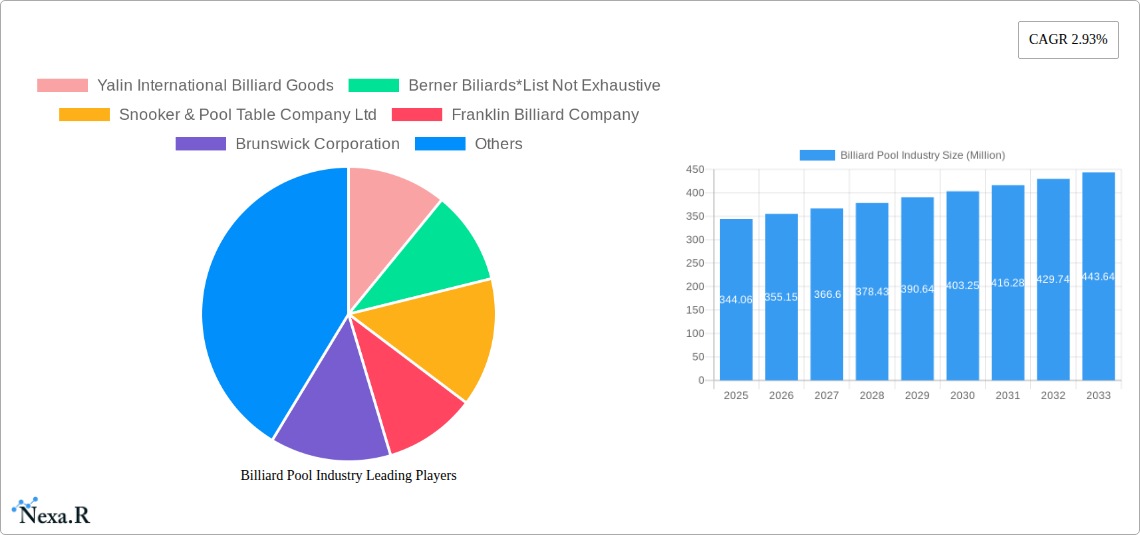
Billiard Pool Industry Market Size (In Million)
Regional analysis indicates that North America and Europe currently hold substantial market shares, driven by established billiards cultures and strong consumer spending. However, significant growth potential lies within the Asia-Pacific region, particularly in countries like China and India, where rising affluence and a growing interest in recreational activities are creating favorable conditions for market expansion. The presence of established players like Brunswick Corporation and Yalin International Billiard Goods, alongside numerous smaller regional manufacturers, creates a competitive yet dynamic landscape. Strategic partnerships, product diversification, and targeted marketing efforts are crucial for success within this evolving industry. The continued focus on enhancing the gaming experience through technological advancements and innovative table designs will play a significant role in shaping future growth.
Billiard Pool Industry Company Market Share
Billiard Pool Industry Market Report: 2019-2033
This comprehensive report provides an in-depth analysis of the Billiard Pool industry, encompassing market dynamics, growth trends, competitive landscape, and future outlook. The study covers the period from 2019 to 2033, with 2025 as the base and estimated year. We delve into the parent market of recreational games and the child market of home entertainment, providing a granular view of this dynamic sector. This report is essential for industry professionals, investors, and anyone seeking to understand the current state and future trajectory of the billiard pool market. The market is valued at xx Million in 2025 and is projected to reach xx Million by 2033.
Billiard Pool Industry Market Dynamics & Structure
This section delves into the intricate dynamics and structure of the Billiard Pool industry. We analyze key market drivers, the competitive landscape, technological evolutions, the influence of regulatory frameworks, the impact of substitute entertainment options, evolving end-user demographics, and significant merger and acquisition (M&A) activities. The global market is characterized by a moderate level of fragmentation, where a constellation of dynamic players actively vie for market dominance, fostering an environment ripe for both competition and innovation.
- Market Concentration: The industry operates within a moderately fragmented structure, marked by the absence of a single dominant entity. This equilibrium fosters competitive pricing strategies and a continuous drive for innovation among market participants. In 2025, the top 5 key players collectively commanded an estimated [Insert Approximate Percentage]% of the global market share.
- Technological Innovation: Significant advancements are being witnessed in table design, cue manufacturing, and the integration of smart features, such as automated score tracking and adaptive lighting systems. These innovations are potent catalysts for market expansion. However, the substantial investment required for research and development (R&D) can present a barrier to entry and rapid innovation for smaller, emerging players.
- Regulatory Framework: Regional variations in regulations pertaining to safety standards and permissible material compositions introduce complexities in manufacturing and distribution processes. Adherence to these diverse compliance requirements directly influences operational costs and overall profitability for businesses operating in this sector.
- Competitive Substitutes: The Billiard Pool industry faces considerable competitive pressure from a broad spectrum of alternative home entertainment options, most notably video games. This competitive landscape can particularly influence market growth trajectories, especially within younger demographic segments who are often early adopters of new entertainment technologies.
- End-User Demographics: The industry's customer base is diverse, encompassing dedicated home enthusiasts, commercial establishments such as bars and social clubs, and professional billiard athletes. Evolving lifestyle preferences and shifting demographic trends are key factors that shape and influence overall market demand.
- M&A Trends: The period between 2019 and 2024 saw a notable number of [Insert Number] M&A transactions. These strategic acquisitions were predominantly aimed at broadening product portfolios, enhancing technological capabilities, and expanding geographical market reach.
Billiard Pool Industry Growth Trends & Insights
The Billiard Pool industry has witnessed significant growth over the past few years, driven by factors including rising disposable incomes, increased interest in recreational activities, and the introduction of technologically advanced products. The market is expected to exhibit a Compound Annual Growth Rate (CAGR) of xx% during the forecast period (2025-2033). This growth is fueled by several factors:
Increased demand for high-quality pool tables and accessories is driving growth within the segment. The market penetration of smart pool tables, featuring integrated scorekeeping and other technological advancements, is increasing, particularly among affluent consumers. The shift in consumer preference toward premium and customized products presents substantial growth opportunities for manufacturers. The rising popularity of professional billiard tournaments and leagues also contributes to the industry's growth.
Dominant Regions, Countries, or Segments in Billiard Pool Industry
North America currently holds the largest market share, followed by Europe and Asia-Pacific. The Pool segment dominates in terms of type, accounting for approximately xx% of the market, followed by Snooker and Carom. The Table segment leads in terms of equipment, with a market share of approximately xx%. Offline retail stores remain the dominant distribution channel, although online sales are steadily increasing.
- Key Drivers:
- North America: High disposable incomes, established infrastructure, and a strong culture of recreational games.
- Europe: Growing popularity of snooker and a robust network of billiard halls.
- Asia-Pacific: Rising middle class, increasing urbanization, and expanding entertainment options.
- Pool Segment: Wide appeal, simpler gameplay, and affordability compared to other types.
- Table Segment: High-value product, driving overall revenue.
- Offline Retail Stores: Established customer base, product demonstration, and immediate gratification.
The growth potential of the Asia-Pacific region, fueled by rising disposable income and urbanization, is substantial, with projected CAGR of xx%. Emerging markets in South America and Africa also offer considerable untapped potential.
Billiard Pool Industry Product Landscape
The Billiard Pool industry presents a comprehensive and evolving product ecosystem, encompassing high-quality billiard tables, precision-engineered cues, standardized billiard balls, and a wide array of essential accessories. Recent advancements have prioritized the enhancement of table aesthetics and functionality, with a notable trend towards incorporating sophisticated smart features such as integrated digital scorekeeping systems and customizable lighting. Furthermore, significant strides have been made in cue technology to optimize accuracy, balance, and player performance. The luxury segment is experiencing substantial growth, exemplified by premium and bespoke tables, such as the Bugatti pool table, which merges exquisite craftsmanship with cutting-edge technological integration. The industry remains committed to continuously refining its offerings to meet the diverse and sophisticated demands of both amateur players and professional athletes, with a particular emphasis on ergonomics and the pursuit of peak performance.
Key Drivers, Barriers & Challenges in Billiard Pool Industry
Key Drivers:
- Rising disposable incomes in developing economies.
- Growing popularity of sports and recreational activities.
- Technological advancements enhancing gameplay and aesthetics.
- Expansion of organized leagues and professional tournaments.
Challenges & Restraints:
- High manufacturing and distribution costs.
- Competition from other forms of home entertainment.
- The impact of economic downturns on discretionary spending.
- Supply chain disruptions affecting the availability of raw materials. This led to a xx% increase in production costs in 2022.
Emerging Opportunities in Billiard Pool Industry
- Expansion into Emerging Markets: Significant untapped potential exists within developing economies, driven by a growing middle class with increasing disposable incomes and a burgeoning interest in leisure activities.
- Development of Innovative Products: Future growth will be propelled by the creation of advanced products, including smart tables with integrated gaming functionalities, augmented reality (AR) enhancements, and even virtual reality (VR) integrations to offer novel playing experiences.
- Growth of Online Sales Channels: A robust and strategically optimized online presence, coupled with effective e-commerce platforms, presents a substantial opportunity for wider market penetration and direct customer engagement.
- Targeting Niche Markets: A focused approach on catering to discerning luxury customers through the provision of ultra-premium products, highly personalized designs, and exclusive service offerings represents a significant growth avenue.
Growth Accelerators in the Billiard Pool Industry Industry
The sustained long-term growth of the Billiard Pool industry will be significantly propelled by the strategic formation of partnerships aimed at expanding market reach, substantial investments in cutting-edge R&D to foster truly innovative product development, and the meticulous execution of comprehensive e-commerce strategies. Furthermore, a dedicated focus on crafting highly engaging and immersive gaming experiences through the integration of advanced technologies will be instrumental in driving industry expansion. The burgeoning popularity and increasing professionalization of billiard leagues and major tournaments are poised to act as powerful catalysts, attracting heightened public attention and encouraging broader participation in the sport.
Key Players Shaping the Billiard Pool Industry Market
- Yalin International Billiard Goods
- Berner Billiards
- Snooker & Pool Table Company Ltd
- Franklin Billiard Company
- Brunswick Corporation
- H Betti Industries Inc
- Imperial International
- Diamond Billiard Products Inc
- Kaldera Billiards
- Birmingham Billiards Ltd
Notable Milestones in Billiard Pool Industry Sector
- October 2022: Sawyer Twain unveiled its highly anticipated Nixon Billiards line, distinguished by its innovative and aesthetically striking table designs.
- May 2022: FCI Billiards celebrated the grand opening of a new, expansive showroom, marking a significant enhancement of its retail footprint and customer accessibility.
- May 2021: Bugatti introduced its breathtaking USD 300,000 luxury pool table, a testament to the pinnacle of technological advancement and exquisite craftsmanship in the industry.
In-Depth Billiard Pool Industry Market Outlook
The Billiard Pool industry is poised for sustained growth, driven by technological innovation, evolving consumer preferences, and expansion into new markets. The focus on premiumization, coupled with strategic partnerships and a strong online presence, will shape the future of this dynamic sector. The market's long-term potential remains significant, offering lucrative opportunities for established players and new entrants alike.
Billiard Pool Industry Segmentation
-
1. Type
- 1.1. Carom
- 1.2. Pool
- 1.3. Snooker
-
2. Equipment
- 2.1. Table
- 2.2. Ball
- 2.3. Cue
- 2.4. Other Equipment
-
3. Distribution Channel
- 3.1. Offline Retail Stores
- 3.2. Online Retail Stores
Billiard Pool Industry Segmentation By Geography
-
1. North America
- 1.1. United States
- 1.2. Canada
- 1.3. Mexico
- 1.4. Rest of North America
-
2. Europe
- 2.1. Spain
- 2.2. United Kingdom
- 2.3. Germany
- 2.4. France
- 2.5. Italy
- 2.6. Belgium
- 2.7. Rest of Europe
-
3. Asia Pacific
- 3.1. China
- 3.2. Japan
- 3.3. India
- 3.4. Australia
- 3.5. Rest of Asia Pacific
-
4. South America
- 4.1. Brazil
- 4.2. Argentina
- 4.3. Rest of South America
-
5. Middle East and Africa
- 5.1. South Africa
- 5.2. United Arab Emirates
- 5.3. Rest of Middle East and Africa
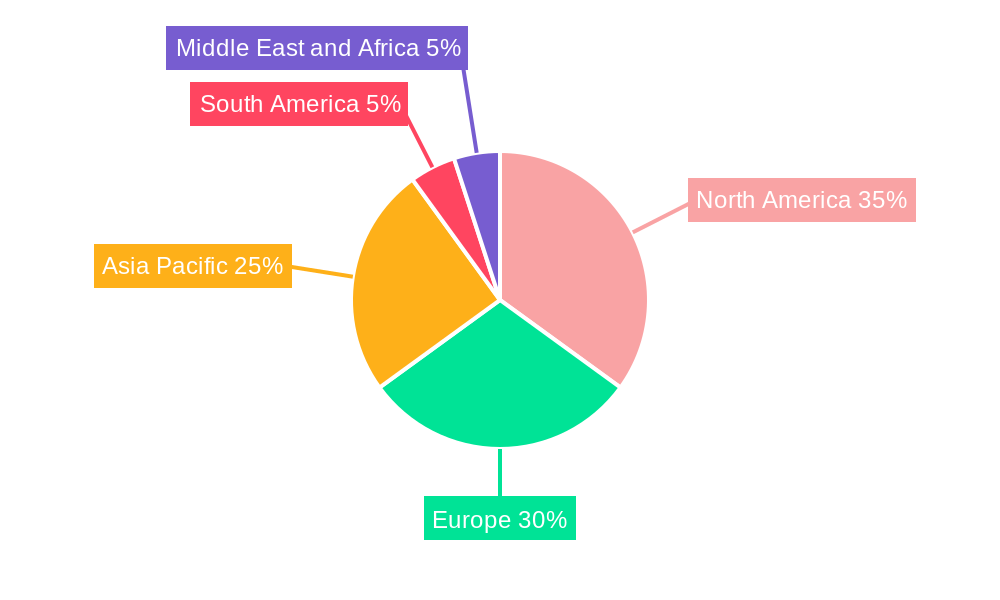
Billiard Pool Industry Regional Market Share
Geographic Coverage of Billiard Pool Industry
Billiard Pool Industry REPORT HIGHLIGHTS
| Aspects | Details |
|---|---|
| Study Period | 2020-2034 |
| Base Year | 2025 |
| Estimated Year | 2026 |
| Forecast Period | 2026-2034 |
| Historical Period | 2020-2025 |
| Growth Rate | CAGR of 2.93% from 2020-2034 |
| Segmentation |
|
Table of Contents
- 1. Introduction
- 1.1. Research Scope
- 1.2. Market Segmentation
- 1.3. Research Objective
- 1.4. Definitions and Assumptions
- 2. Executive Summary
- 2.1. Market Snapshot
- 3. Market Dynamics
- 3.1. Market Drivers
- 3.2. Market Restrains
- 3.3. Market Trends
- 3.4. Market Opportunities
- 4. Market Factor Analysis
- 4.1. Porters Five Forces
- 4.1.1. Bargaining Power of Suppliers
- 4.1.2. Bargaining Power of Buyers
- 4.1.3. Threat of New Entrants
- 4.1.4. Threat of Substitutes
- 4.1.5. Competitive Rivalry
- 4.2. PESTEL analysis
- 4.3. BCG Analysis
- 4.3.1. Stars (High Growth, High Market Share)
- 4.3.2. Cash Cows (Low Growth, High Market Share)
- 4.3.3. Question Mark (High Growth, Low Market Share)
- 4.3.4. Dogs (Low Growth, Low Market Share)
- 4.4. Ansoff Matrix Analysis
- 4.5. Supply Chain Analysis
- 4.6. Regulatory Landscape
- 4.7. Current Market Potential and Opportunity Assessment (TAM–SAM–SOM Framework)
- 4.8. NRP Analyst Note
- 4.1. Porters Five Forces
- 5. Market Analysis, Insights and Forecast 2021-2033
- 5.1. Market Analysis, Insights and Forecast - by Type
- 5.1.1. Carom
- 5.1.2. Pool
- 5.1.3. Snooker
- 5.2. Market Analysis, Insights and Forecast - by Equipment
- 5.2.1. Table
- 5.2.2. Ball
- 5.2.3. Cue
- 5.2.4. Other Equipment
- 5.3. Market Analysis, Insights and Forecast - by Distribution Channel
- 5.3.1. Offline Retail Stores
- 5.3.2. Online Retail Stores
- 5.4. Market Analysis, Insights and Forecast - by Region
- 5.4.1. North America
- 5.4.2. Europe
- 5.4.3. Asia Pacific
- 5.4.4. South America
- 5.4.5. Middle East and Africa
- 5.1. Market Analysis, Insights and Forecast - by Type
- 6. Global Billiard Pool Industry Analysis, Insights and Forecast, 2021-2033
- 6.1. Market Analysis, Insights and Forecast - by Type
- 6.1.1. Carom
- 6.1.2. Pool
- 6.1.3. Snooker
- 6.2. Market Analysis, Insights and Forecast - by Equipment
- 6.2.1. Table
- 6.2.2. Ball
- 6.2.3. Cue
- 6.2.4. Other Equipment
- 6.3. Market Analysis, Insights and Forecast - by Distribution Channel
- 6.3.1. Offline Retail Stores
- 6.3.2. Online Retail Stores
- 6.1. Market Analysis, Insights and Forecast - by Type
- 7. North America Billiard Pool Industry Analysis, Insights and Forecast, 2020-2032
- 7.1. Market Analysis, Insights and Forecast - by Type
- 7.1.1. Carom
- 7.1.2. Pool
- 7.1.3. Snooker
- 7.2. Market Analysis, Insights and Forecast - by Equipment
- 7.2.1. Table
- 7.2.2. Ball
- 7.2.3. Cue
- 7.2.4. Other Equipment
- 7.3. Market Analysis, Insights and Forecast - by Distribution Channel
- 7.3.1. Offline Retail Stores
- 7.3.2. Online Retail Stores
- 7.1. Market Analysis, Insights and Forecast - by Type
- 8. Europe Billiard Pool Industry Analysis, Insights and Forecast, 2020-2032
- 8.1. Market Analysis, Insights and Forecast - by Type
- 8.1.1. Carom
- 8.1.2. Pool
- 8.1.3. Snooker
- 8.2. Market Analysis, Insights and Forecast - by Equipment
- 8.2.1. Table
- 8.2.2. Ball
- 8.2.3. Cue
- 8.2.4. Other Equipment
- 8.3. Market Analysis, Insights and Forecast - by Distribution Channel
- 8.3.1. Offline Retail Stores
- 8.3.2. Online Retail Stores
- 8.1. Market Analysis, Insights and Forecast - by Type
- 9. Asia Pacific Billiard Pool Industry Analysis, Insights and Forecast, 2020-2032
- 9.1. Market Analysis, Insights and Forecast - by Type
- 9.1.1. Carom
- 9.1.2. Pool
- 9.1.3. Snooker
- 9.2. Market Analysis, Insights and Forecast - by Equipment
- 9.2.1. Table
- 9.2.2. Ball
- 9.2.3. Cue
- 9.2.4. Other Equipment
- 9.3. Market Analysis, Insights and Forecast - by Distribution Channel
- 9.3.1. Offline Retail Stores
- 9.3.2. Online Retail Stores
- 9.1. Market Analysis, Insights and Forecast - by Type
- 10. South America Billiard Pool Industry Analysis, Insights and Forecast, 2020-2032
- 10.1. Market Analysis, Insights and Forecast - by Type
- 10.1.1. Carom
- 10.1.2. Pool
- 10.1.3. Snooker
- 10.2. Market Analysis, Insights and Forecast - by Equipment
- 10.2.1. Table
- 10.2.2. Ball
- 10.2.3. Cue
- 10.2.4. Other Equipment
- 10.3. Market Analysis, Insights and Forecast - by Distribution Channel
- 10.3.1. Offline Retail Stores
- 10.3.2. Online Retail Stores
- 10.1. Market Analysis, Insights and Forecast - by Type
- 11. Middle East and Africa Billiard Pool Industry Analysis, Insights and Forecast, 2020-2032
- 11.1. Market Analysis, Insights and Forecast - by Type
- 11.1.1. Carom
- 11.1.2. Pool
- 11.1.3. Snooker
- 11.2. Market Analysis, Insights and Forecast - by Equipment
- 11.2.1. Table
- 11.2.2. Ball
- 11.2.3. Cue
- 11.2.4. Other Equipment
- 11.3. Market Analysis, Insights and Forecast - by Distribution Channel
- 11.3.1. Offline Retail Stores
- 11.3.2. Online Retail Stores
- 11.1. Market Analysis, Insights and Forecast - by Type
- 12. Competitive Analysis
- 12.1. Company Profiles
- 12.1.1 Yalin International Billiard Goods
- 12.1.1.1. Company Overview
- 12.1.1.2. Products
- 12.1.1.3. Company Financials
- 12.1.1.4. SWOT Analysis
- 12.1.2 Berner Biliards*List Not Exhaustive
- 12.1.2.1. Company Overview
- 12.1.2.2. Products
- 12.1.2.3. Company Financials
- 12.1.2.4. SWOT Analysis
- 12.1.3 Snooker & Pool Table Company Ltd
- 12.1.3.1. Company Overview
- 12.1.3.2. Products
- 12.1.3.3. Company Financials
- 12.1.3.4. SWOT Analysis
- 12.1.4 Franklin Billiard Company
- 12.1.4.1. Company Overview
- 12.1.4.2. Products
- 12.1.4.3. Company Financials
- 12.1.4.4. SWOT Analysis
- 12.1.5 Brunswick Corporation
- 12.1.5.1. Company Overview
- 12.1.5.2. Products
- 12.1.5.3. Company Financials
- 12.1.5.4. SWOT Analysis
- 12.1.6 H Betti Industries Inc
- 12.1.6.1. Company Overview
- 12.1.6.2. Products
- 12.1.6.3. Company Financials
- 12.1.6.4. SWOT Analysis
- 12.1.7 Imperial International
- 12.1.7.1. Company Overview
- 12.1.7.2. Products
- 12.1.7.3. Company Financials
- 12.1.7.4. SWOT Analysis
- 12.1.8 Diamond Billiard Products Inc
- 12.1.8.1. Company Overview
- 12.1.8.2. Products
- 12.1.8.3. Company Financials
- 12.1.8.4. SWOT Analysis
- 12.1.9 Kaldera Billiards
- 12.1.9.1. Company Overview
- 12.1.9.2. Products
- 12.1.9.3. Company Financials
- 12.1.9.4. SWOT Analysis
- 12.1.10 Birmingham Billiards Ltd
- 12.1.10.1. Company Overview
- 12.1.10.2. Products
- 12.1.10.3. Company Financials
- 12.1.10.4. SWOT Analysis
- 12.1.1 Yalin International Billiard Goods
- 12.2. Market Entropy
- 12.2.1 Company's Key Areas Served
- 12.2.2 Recent Developments
- 12.3. Company Market Share Analysis 2025
- 12.3.1 Top 5 Companies Market Share Analysis
- 12.3.2 Top 3 Companies Market Share Analysis
- 12.4. List of Potential Customers
- 13. Research Methodology
List of Figures
- Figure 1: Global Billiard Pool Industry Revenue Breakdown (Million, %) by Region 2025 & 2033
- Figure 2: North America Billiard Pool Industry Revenue (Million), by Type 2025 & 2033
- Figure 3: North America Billiard Pool Industry Revenue Share (%), by Type 2025 & 2033
- Figure 4: North America Billiard Pool Industry Revenue (Million), by Equipment 2025 & 2033
- Figure 5: North America Billiard Pool Industry Revenue Share (%), by Equipment 2025 & 2033
- Figure 6: North America Billiard Pool Industry Revenue (Million), by Distribution Channel 2025 & 2033
- Figure 7: North America Billiard Pool Industry Revenue Share (%), by Distribution Channel 2025 & 2033
- Figure 8: North America Billiard Pool Industry Revenue (Million), by Country 2025 & 2033
- Figure 9: North America Billiard Pool Industry Revenue Share (%), by Country 2025 & 2033
- Figure 10: Europe Billiard Pool Industry Revenue (Million), by Type 2025 & 2033
- Figure 11: Europe Billiard Pool Industry Revenue Share (%), by Type 2025 & 2033
- Figure 12: Europe Billiard Pool Industry Revenue (Million), by Equipment 2025 & 2033
- Figure 13: Europe Billiard Pool Industry Revenue Share (%), by Equipment 2025 & 2033
- Figure 14: Europe Billiard Pool Industry Revenue (Million), by Distribution Channel 2025 & 2033
- Figure 15: Europe Billiard Pool Industry Revenue Share (%), by Distribution Channel 2025 & 2033
- Figure 16: Europe Billiard Pool Industry Revenue (Million), by Country 2025 & 2033
- Figure 17: Europe Billiard Pool Industry Revenue Share (%), by Country 2025 & 2033
- Figure 18: Asia Pacific Billiard Pool Industry Revenue (Million), by Type 2025 & 2033
- Figure 19: Asia Pacific Billiard Pool Industry Revenue Share (%), by Type 2025 & 2033
- Figure 20: Asia Pacific Billiard Pool Industry Revenue (Million), by Equipment 2025 & 2033
- Figure 21: Asia Pacific Billiard Pool Industry Revenue Share (%), by Equipment 2025 & 2033
- Figure 22: Asia Pacific Billiard Pool Industry Revenue (Million), by Distribution Channel 2025 & 2033
- Figure 23: Asia Pacific Billiard Pool Industry Revenue Share (%), by Distribution Channel 2025 & 2033
- Figure 24: Asia Pacific Billiard Pool Industry Revenue (Million), by Country 2025 & 2033
- Figure 25: Asia Pacific Billiard Pool Industry Revenue Share (%), by Country 2025 & 2033
- Figure 26: South America Billiard Pool Industry Revenue (Million), by Type 2025 & 2033
- Figure 27: South America Billiard Pool Industry Revenue Share (%), by Type 2025 & 2033
- Figure 28: South America Billiard Pool Industry Revenue (Million), by Equipment 2025 & 2033
- Figure 29: South America Billiard Pool Industry Revenue Share (%), by Equipment 2025 & 2033
- Figure 30: South America Billiard Pool Industry Revenue (Million), by Distribution Channel 2025 & 2033
- Figure 31: South America Billiard Pool Industry Revenue Share (%), by Distribution Channel 2025 & 2033
- Figure 32: South America Billiard Pool Industry Revenue (Million), by Country 2025 & 2033
- Figure 33: South America Billiard Pool Industry Revenue Share (%), by Country 2025 & 2033
- Figure 34: Middle East and Africa Billiard Pool Industry Revenue (Million), by Type 2025 & 2033
- Figure 35: Middle East and Africa Billiard Pool Industry Revenue Share (%), by Type 2025 & 2033
- Figure 36: Middle East and Africa Billiard Pool Industry Revenue (Million), by Equipment 2025 & 2033
- Figure 37: Middle East and Africa Billiard Pool Industry Revenue Share (%), by Equipment 2025 & 2033
- Figure 38: Middle East and Africa Billiard Pool Industry Revenue (Million), by Distribution Channel 2025 & 2033
- Figure 39: Middle East and Africa Billiard Pool Industry Revenue Share (%), by Distribution Channel 2025 & 2033
- Figure 40: Middle East and Africa Billiard Pool Industry Revenue (Million), by Country 2025 & 2033
- Figure 41: Middle East and Africa Billiard Pool Industry Revenue Share (%), by Country 2025 & 2033
List of Tables
- Table 1: Global Billiard Pool Industry Revenue Million Forecast, by Type 2020 & 2033
- Table 2: Global Billiard Pool Industry Revenue Million Forecast, by Equipment 2020 & 2033
- Table 3: Global Billiard Pool Industry Revenue Million Forecast, by Distribution Channel 2020 & 2033
- Table 4: Global Billiard Pool Industry Revenue Million Forecast, by Region 2020 & 2033
- Table 5: Global Billiard Pool Industry Revenue Million Forecast, by Type 2020 & 2033
- Table 6: Global Billiard Pool Industry Revenue Million Forecast, by Equipment 2020 & 2033
- Table 7: Global Billiard Pool Industry Revenue Million Forecast, by Distribution Channel 2020 & 2033
- Table 8: Global Billiard Pool Industry Revenue Million Forecast, by Country 2020 & 2033
- Table 9: United States Billiard Pool Industry Revenue (Million) Forecast, by Application 2020 & 2033
- Table 10: Canada Billiard Pool Industry Revenue (Million) Forecast, by Application 2020 & 2033
- Table 11: Mexico Billiard Pool Industry Revenue (Million) Forecast, by Application 2020 & 2033
- Table 12: Rest of North America Billiard Pool Industry Revenue (Million) Forecast, by Application 2020 & 2033
- Table 13: Global Billiard Pool Industry Revenue Million Forecast, by Type 2020 & 2033
- Table 14: Global Billiard Pool Industry Revenue Million Forecast, by Equipment 2020 & 2033
- Table 15: Global Billiard Pool Industry Revenue Million Forecast, by Distribution Channel 2020 & 2033
- Table 16: Global Billiard Pool Industry Revenue Million Forecast, by Country 2020 & 2033
- Table 17: Spain Billiard Pool Industry Revenue (Million) Forecast, by Application 2020 & 2033
- Table 18: United Kingdom Billiard Pool Industry Revenue (Million) Forecast, by Application 2020 & 2033
- Table 19: Germany Billiard Pool Industry Revenue (Million) Forecast, by Application 2020 & 2033
- Table 20: France Billiard Pool Industry Revenue (Million) Forecast, by Application 2020 & 2033
- Table 21: Italy Billiard Pool Industry Revenue (Million) Forecast, by Application 2020 & 2033
- Table 22: Belgium Billiard Pool Industry Revenue (Million) Forecast, by Application 2020 & 2033
- Table 23: Rest of Europe Billiard Pool Industry Revenue (Million) Forecast, by Application 2020 & 2033
- Table 24: Global Billiard Pool Industry Revenue Million Forecast, by Type 2020 & 2033
- Table 25: Global Billiard Pool Industry Revenue Million Forecast, by Equipment 2020 & 2033
- Table 26: Global Billiard Pool Industry Revenue Million Forecast, by Distribution Channel 2020 & 2033
- Table 27: Global Billiard Pool Industry Revenue Million Forecast, by Country 2020 & 2033
- Table 28: China Billiard Pool Industry Revenue (Million) Forecast, by Application 2020 & 2033
- Table 29: Japan Billiard Pool Industry Revenue (Million) Forecast, by Application 2020 & 2033
- Table 30: India Billiard Pool Industry Revenue (Million) Forecast, by Application 2020 & 2033
- Table 31: Australia Billiard Pool Industry Revenue (Million) Forecast, by Application 2020 & 2033
- Table 32: Rest of Asia Pacific Billiard Pool Industry Revenue (Million) Forecast, by Application 2020 & 2033
- Table 33: Global Billiard Pool Industry Revenue Million Forecast, by Type 2020 & 2033
- Table 34: Global Billiard Pool Industry Revenue Million Forecast, by Equipment 2020 & 2033
- Table 35: Global Billiard Pool Industry Revenue Million Forecast, by Distribution Channel 2020 & 2033
- Table 36: Global Billiard Pool Industry Revenue Million Forecast, by Country 2020 & 2033
- Table 37: Brazil Billiard Pool Industry Revenue (Million) Forecast, by Application 2020 & 2033
- Table 38: Argentina Billiard Pool Industry Revenue (Million) Forecast, by Application 2020 & 2033
- Table 39: Rest of South America Billiard Pool Industry Revenue (Million) Forecast, by Application 2020 & 2033
- Table 40: Global Billiard Pool Industry Revenue Million Forecast, by Type 2020 & 2033
- Table 41: Global Billiard Pool Industry Revenue Million Forecast, by Equipment 2020 & 2033
- Table 42: Global Billiard Pool Industry Revenue Million Forecast, by Distribution Channel 2020 & 2033
- Table 43: Global Billiard Pool Industry Revenue Million Forecast, by Country 2020 & 2033
- Table 44: South Africa Billiard Pool Industry Revenue (Million) Forecast, by Application 2020 & 2033
- Table 45: United Arab Emirates Billiard Pool Industry Revenue (Million) Forecast, by Application 2020 & 2033
- Table 46: Rest of Middle East and Africa Billiard Pool Industry Revenue (Million) Forecast, by Application 2020 & 2033
Frequently Asked Questions
1. What is the projected Compound Annual Growth Rate (CAGR) of the Billiard Pool Industry?
The projected CAGR is approximately 2.93%.
2. Which companies are prominent players in the Billiard Pool Industry?
Key companies in the market include Yalin International Billiard Goods, Berner Biliards*List Not Exhaustive, Snooker & Pool Table Company Ltd, Franklin Billiard Company, Brunswick Corporation, H Betti Industries Inc, Imperial International, Diamond Billiard Products Inc, Kaldera Billiards, Birmingham Billiards Ltd.
3. What are the main segments of the Billiard Pool Industry?
The market segments include Type, Equipment, Distribution Channel.
4. Can you provide details about the market size?
The market size is estimated to be USD 344.06 Million as of 2022.
5. What are some drivers contributing to market growth?
Aggressive Social Media Marketing; Lower-risk Factor Associated with the Use of E-Cigarettes Compared to Conventional/Combustible Cigarettes.
6. What are the notable trends driving market growth?
Increased Sports Participation Propelling the Billiards and Pools Equipment Sales.
7. Are there any restraints impacting market growth?
Government Initiatives to Ban Disposable E-Cigarettes.
8. Can you provide examples of recent developments in the market?
In October 2022, Sawyer Twain launched a new line of Nixon Billiards to the North American market. Featured in the Nixon Billiards line are the Desyn, a mid-century modern table; the prominent Kai table; and the Birdy, a contemporary chic billiards table with a carefully crafted refectory design that stands alone in being the first of its kind with modern tapered rails.
9. What pricing options are available for accessing the report?
Pricing options include single-user, multi-user, and enterprise licenses priced at USD 4750, USD 5250, and USD 8750 respectively.
10. Is the market size provided in terms of value or volume?
The market size is provided in terms of value, measured in Million.
11. Are there any specific market keywords associated with the report?
Yes, the market keyword associated with the report is "Billiard Pool Industry," which aids in identifying and referencing the specific market segment covered.
12. How do I determine which pricing option suits my needs best?
The pricing options vary based on user requirements and access needs. Individual users may opt for single-user licenses, while businesses requiring broader access may choose multi-user or enterprise licenses for cost-effective access to the report.
13. Are there any additional resources or data provided in the Billiard Pool Industry report?
While the report offers comprehensive insights, it's advisable to review the specific contents or supplementary materials provided to ascertain if additional resources or data are available.
14. How can I stay updated on further developments or reports in the Billiard Pool Industry?
To stay informed about further developments, trends, and reports in the Billiard Pool Industry, consider subscribing to industry newsletters, following relevant companies and organizations, or regularly checking reputable industry news sources and publications.
Methodology
Step 1 - Identification of Relevant Samples Size from Population Database


Step 2 - Approaches for Defining Global Market Size (Value, Volume* & Price*)

Note*: In applicable scenarios
Step 3 - Data Sources
Primary Research
- Web Analytics
- Survey Reports
- Research Institute
- Latest Research Reports
- Opinion Leaders
Secondary Research
- Annual Reports
- White Paper
- Latest Press Release
- Industry Association
- Paid Database
- Investor Presentations

Step 4 - Data Triangulation
Involves using different sources of information in order to increase the validity of a study
These sources are likely to be stakeholders in a program - participants, other researchers, program staff, other community members, and so on.
Then we put all data in single framework & apply various statistical tools to find out the dynamic on the market.
During the analysis stage, feedback from the stakeholder groups would be compared to determine areas of agreement as well as areas of divergence