

Key Insights
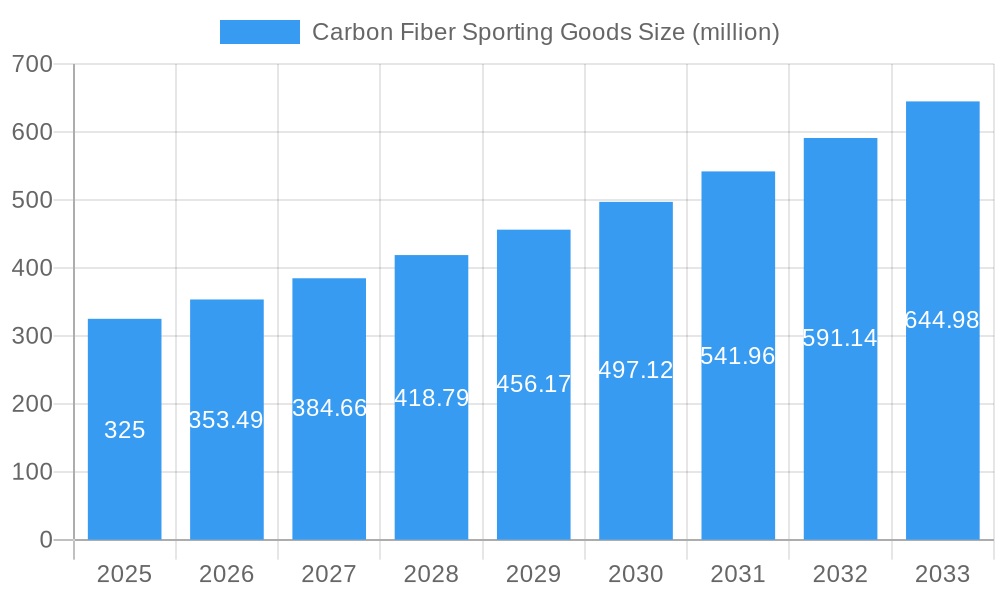
The global carbon fiber sporting goods market, valued at $325 million in 2025, is projected to experience robust growth, driven by the increasing demand for lightweight, high-performance equipment across various sports. The market's Compound Annual Growth Rate (CAGR) of 8.6% from 2025 to 2033 indicates a significant expansion, fueled by several key factors. Technological advancements in carbon fiber manufacturing are leading to stronger, lighter, and more affordable products, making them accessible to a wider range of athletes. The rising popularity of sports like tennis, hockey, and golf, coupled with the growing preference for technologically advanced equipment among professional and amateur athletes, further contributes to market expansion. Furthermore, the increasing awareness of the benefits of carbon fiber, such as improved durability and performance enhancement, is driving consumer demand. The competitive landscape is characterized by a mix of established players like Wilson, Babolat, and Head, alongside specialized brands catering to niche sports. Strategic partnerships, product innovation, and expansion into emerging markets are key strategies adopted by companies to gain market share.
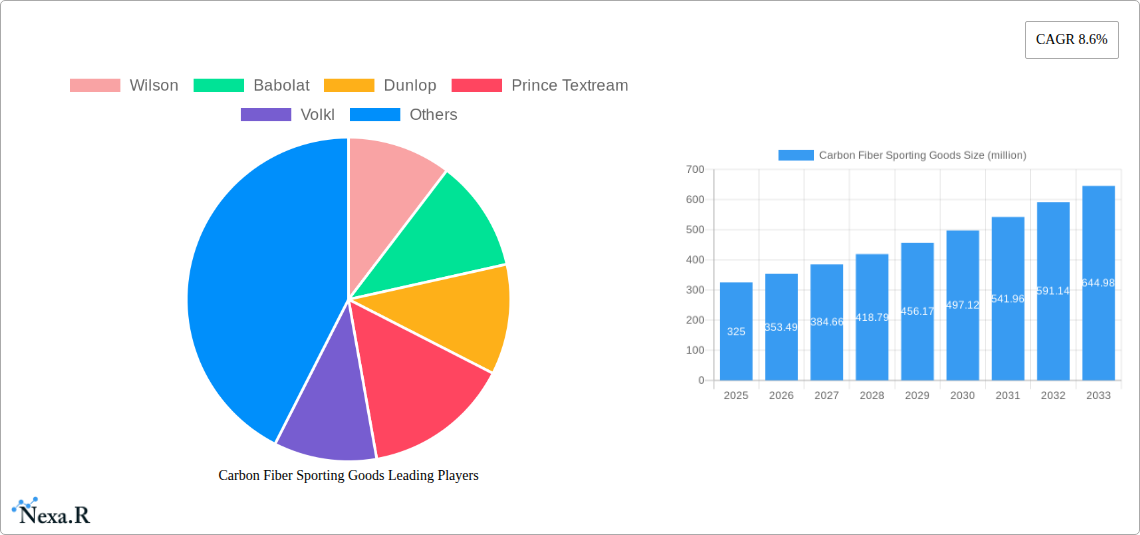
Carbon Fiber Sporting Goods Market Size (In Million)
The market segmentation is likely diversified across various sports, with tennis racquets, hockey sticks, and golf shafts representing significant segments. Regional variations in market growth are expected, with North America and Europe potentially leading due to higher sporting goods consumption and technological advancements. However, Asia-Pacific is anticipated to show considerable growth potential due to its large and rapidly growing sports market. While the high initial cost of carbon fiber materials could pose a restraint, ongoing innovations are likely to mitigate this factor in the long term. The presence of numerous established brands creates a competitive landscape, stimulating innovation and driving down prices, thereby expanding market accessibility. Future growth will likely be shaped by advancements in material science, sustainable manufacturing practices, and the integration of smart technology into sporting goods.
Carbon Fiber Sporting Goods Company Market Share
Carbon Fiber Sporting Goods Market Report: 2019-2033
This comprehensive report provides an in-depth analysis of the Carbon Fiber Sporting Goods market, covering the period 2019-2033. With a focus on market dynamics, growth trends, key players, and future opportunities, this report is an essential resource for industry professionals, investors, and strategic decision-makers. The report leverages extensive data analysis to provide actionable insights into this rapidly evolving sector. Parent markets include sporting goods overall, while child markets include specific sports like tennis, hockey, and billiards. The Base Year is 2025, the Estimated Year is 2025, and the Forecast Period is 2025-2033. The Historical Period covered is 2019-2024. The total market size in 2025 is estimated at $xx million.
Carbon Fiber Sporting Goods Market Dynamics & Structure
This section analyzes the market concentration, technological innovation drivers, regulatory frameworks, competitive product substitutes, end-user demographics, and M&A trends within the carbon fiber sporting goods industry. The market is characterized by a moderately fragmented landscape with a few dominant players and numerous smaller niche players. Technological advancements are a major driver, with continuous improvements in carbon fiber materials and manufacturing processes leading to lighter, stronger, and more durable sporting goods. Regulatory frameworks concerning material safety and environmental impact influence the market. The primary substitute for carbon fiber is other high-performance materials like titanium or aluminum alloys, but carbon fiber maintains a significant advantage in terms of strength-to-weight ratio. End-user demographics are diverse, ranging from professional athletes to amateur enthusiasts. M&A activity in the sector has been moderate, with strategic acquisitions focused on enhancing technology and expanding market reach. The 2024 M&A activity is estimated at $xx million.
- Market Concentration: Moderately fragmented, with a Herfindahl-Hirschman Index (HHI) of xx.
- Technological Innovation: Focus on lighter weight, increased strength, improved durability, and customized designs.
- Regulatory Frameworks: Compliance with safety and environmental regulations is crucial.
- Competitive Substitutes: Aluminum alloys, titanium alloys, and other high-performance materials.
- End-User Demographics: Professional athletes, amateur enthusiasts, and recreational users.
- M&A Trends: Strategic acquisitions to enhance technology and market reach.
Carbon Fiber Sporting Goods Growth Trends & Insights
The carbon fiber sporting goods market has experienced substantial growth over the historical period (2019-2024), driven by increasing consumer demand for high-performance equipment and technological advancements in carbon fiber materials. The market size has grown from $xx million in 2019 to an estimated $xx million in 2024, exhibiting a Compound Annual Growth Rate (CAGR) of xx%. This growth is projected to continue during the forecast period (2025-2033), driven by factors such as rising disposable incomes in emerging economies, increasing participation in sports and recreational activities, and the continuous development of innovative carbon fiber products. Adoption rates for carbon fiber sporting goods have been steadily increasing across various sports, reflecting the growing recognition of the material's performance benefits. Technological disruptions, particularly in materials science and manufacturing processes, are further fueling market expansion. Consumer behavior is shifting towards premium, high-performance products, creating a favorable environment for carbon fiber sporting goods. Market penetration in key segments, such as tennis rackets and hockey sticks, remains relatively high but has scope for expansion in emerging markets. The market is expected to reach $xx million by 2033.
Dominant Regions, Countries, or Segments in Carbon Fiber Sporting Goods
North America and Europe currently dominate the global carbon fiber sporting goods market, accounting for a combined market share of xx% in 2025. This dominance stems from several factors: established sporting goods industries, high disposable incomes, robust demand for high-performance equipment, and a strong preference for technologically advanced products. However, Asia-Pacific is experiencing rapid growth, projected to become a major market player by 2033, driven by increasing participation in sports, rising disposable incomes, and growing awareness of the benefits of carbon fiber products. The tennis racket segment currently holds the largest market share among various product categories, due to its established presence and high demand for performance enhancement among players.
- North America: High disposable incomes, strong demand for performance equipment.
- Europe: Established sporting goods industry, significant consumer base.
- Asia-Pacific: Rapid growth, driven by rising disposable incomes and increasing sports participation.
- Tennis Rackets: Largest market share due to high demand and established presence.
Carbon Fiber Sporting Goods Product Landscape
The carbon fiber sporting goods market offers a diverse range of products, including tennis rackets, golf clubs, hockey sticks, bicycle components, and archery equipment. These products leverage the unique properties of carbon fiber, delivering superior performance in terms of strength, lightweight design, and responsiveness. Continuous innovations in carbon fiber materials and manufacturing techniques enable the creation of products with enhanced durability, improved customization options, and optimized aerodynamic properties. Key selling propositions often revolve around increased power, enhanced control, and improved precision. Recent advancements include the incorporation of nanomaterials and the use of advanced manufacturing processes like 3D printing.
Key Drivers, Barriers & Challenges in Carbon Fiber Sporting Goods
Key Drivers:
- Technological Advancements: Continuous improvements in carbon fiber materials and manufacturing processes.
- Rising Disposable Incomes: Increased purchasing power in emerging markets fuels demand for premium goods.
- Growing Participation in Sports: More individuals are taking up sports, driving demand for quality equipment.
Challenges & Restraints:
- High Production Costs: Carbon fiber is a relatively expensive material, impacting product pricing.
- Supply Chain Disruptions: Potential disruptions in the supply of raw materials or manufacturing capacity.
- Intense Competition: The market is competitive, necessitating continuous innovation and differentiation. Competition also increases supply and drive down prices.
Emerging Opportunities in Carbon Fiber Sporting Goods
- Untapped Markets: Expansion into emerging markets with rising disposable incomes and growing sports participation.
- Innovative Applications: Development of new products and applications for carbon fiber in emerging sporting goods categories.
- Sustainable Carbon Fiber: Increasing demand for eco-friendly and sustainably sourced carbon fiber materials.
Growth Accelerators in the Carbon Fiber Sporting Goods Industry
Technological breakthroughs in carbon fiber composite materials are driving long-term growth. Strategic partnerships between material manufacturers and sporting goods brands facilitate the development and commercialization of innovative products. Market expansion strategies into new geographical regions and product categories create further growth opportunities.
Key Players Shaping the Carbon Fiber Sporting Goods Market
Notable Milestones in Carbon Fiber Sporting Goods Sector
- 2021 (Q4): Wilson launches a new line of carbon fiber tennis rackets featuring improved aerodynamics.
- 2022 (Q2): A significant merger between two key carbon fiber material suppliers leads to increased supply chain stability.
- 2023 (Q3): A leading sporting goods manufacturer invests heavily in R&D for advanced carbon fiber composites.
In-Depth Carbon Fiber Sporting Goods Market Outlook
The future of the carbon fiber sporting goods market is bright, with ongoing technological advancements, expanding global markets, and increasing consumer demand for high-performance equipment. Strategic opportunities lie in the development of sustainable carbon fiber materials, innovative product designs, and targeted expansion into emerging markets. The market is poised for continued growth, driven by factors discussed throughout this report, presenting significant investment and growth opportunities for stakeholders.
Carbon Fiber Sporting Goods Segmentation
-
1. Application
- 1.1. Hypermarkets/Supermarkets
- 1.2. Specialty and Sports Stores
- 1.3. Online Stores
- 1.4. Others
-
2. Types
- 2.1. Carbon Fiber Pool Cue
- 2.2. Carbon Fibre Hockey Sticks
- 2.3. Carbon Fiber Softball Bats
- 2.4. Carbon Fiber Snowboards
- 2.5. Carbon Fiber Tennis Racket
- 2.6. Others
Carbon Fiber Sporting Goods Segmentation By Geography
-
1. North America
- 1.1. United States
- 1.2. Canada
- 1.3. Mexico
-
2. South America
- 2.1. Brazil
- 2.2. Argentina
- 2.3. Rest of South America
-
3. Europe
- 3.1. United Kingdom
- 3.2. Germany
- 3.3. France
- 3.4. Italy
- 3.5. Spain
- 3.6. Russia
- 3.7. Benelux
- 3.8. Nordics
- 3.9. Rest of Europe
-
4. Middle East & Africa
- 4.1. Turkey
- 4.2. Israel
- 4.3. GCC
- 4.4. North Africa
- 4.5. South Africa
- 4.6. Rest of Middle East & Africa
-
5. Asia Pacific
- 5.1. China
- 5.2. India
- 5.3. Japan
- 5.4. South Korea
- 5.5. ASEAN
- 5.6. Oceania
- 5.7. Rest of Asia Pacific

Carbon Fiber Sporting Goods Regional Market Share
Geographic Coverage of Carbon Fiber Sporting Goods
Carbon Fiber Sporting Goods REPORT HIGHLIGHTS
| Aspects | Details |
|---|---|
| Study Period | 2020-2034 |
| Base Year | 2025 |
| Estimated Year | 2026 |
| Forecast Period | 2026-2034 |
| Historical Period | 2020-2025 |
| Growth Rate | CAGR of 8.6% from 2020-2034 |
| Segmentation |
|
Table of Contents
- 1. Introduction
- 1.1. Research Scope
- 1.2. Market Segmentation
- 1.3. Research Methodology
- 1.4. Definitions and Assumptions
- 2. Executive Summary
- 2.1. Introduction
- 3. Market Dynamics
- 3.1. Introduction
- 3.2. Market Drivers
- 3.3. Market Restrains
- 3.4. Market Trends
- 4. Market Factor Analysis
- 4.1. Porters Five Forces
- 4.2. Supply/Value Chain
- 4.3. PESTEL analysis
- 4.4. Market Entropy
- 4.5. Patent/Trademark Analysis
- 5. Global Carbon Fiber Sporting Goods Analysis, Insights and Forecast, 2020-2032
- 5.1. Market Analysis, Insights and Forecast - by Application
- 5.1.1. Hypermarkets/Supermarkets
- 5.1.2. Specialty and Sports Stores
- 5.1.3. Online Stores
- 5.1.4. Others
- 5.2. Market Analysis, Insights and Forecast - by Types
- 5.2.1. Carbon Fiber Pool Cue
- 5.2.2. Carbon Fibre Hockey Sticks
- 5.2.3. Carbon Fiber Softball Bats
- 5.2.4. Carbon Fiber Snowboards
- 5.2.5. Carbon Fiber Tennis Racket
- 5.2.6. Others
- 5.3. Market Analysis, Insights and Forecast - by Region
- 5.3.1. North America
- 5.3.2. South America
- 5.3.3. Europe
- 5.3.4. Middle East & Africa
- 5.3.5. Asia Pacific
- 5.1. Market Analysis, Insights and Forecast - by Application
- 6. North America Carbon Fiber Sporting Goods Analysis, Insights and Forecast, 2020-2032
- 6.1. Market Analysis, Insights and Forecast - by Application
- 6.1.1. Hypermarkets/Supermarkets
- 6.1.2. Specialty and Sports Stores
- 6.1.3. Online Stores
- 6.1.4. Others
- 6.2. Market Analysis, Insights and Forecast - by Types
- 6.2.1. Carbon Fiber Pool Cue
- 6.2.2. Carbon Fibre Hockey Sticks
- 6.2.3. Carbon Fiber Softball Bats
- 6.2.4. Carbon Fiber Snowboards
- 6.2.5. Carbon Fiber Tennis Racket
- 6.2.6. Others
- 6.1. Market Analysis, Insights and Forecast - by Application
- 7. South America Carbon Fiber Sporting Goods Analysis, Insights and Forecast, 2020-2032
- 7.1. Market Analysis, Insights and Forecast - by Application
- 7.1.1. Hypermarkets/Supermarkets
- 7.1.2. Specialty and Sports Stores
- 7.1.3. Online Stores
- 7.1.4. Others
- 7.2. Market Analysis, Insights and Forecast - by Types
- 7.2.1. Carbon Fiber Pool Cue
- 7.2.2. Carbon Fibre Hockey Sticks
- 7.2.3. Carbon Fiber Softball Bats
- 7.2.4. Carbon Fiber Snowboards
- 7.2.5. Carbon Fiber Tennis Racket
- 7.2.6. Others
- 7.1. Market Analysis, Insights and Forecast - by Application
- 8. Europe Carbon Fiber Sporting Goods Analysis, Insights and Forecast, 2020-2032
- 8.1. Market Analysis, Insights and Forecast - by Application
- 8.1.1. Hypermarkets/Supermarkets
- 8.1.2. Specialty and Sports Stores
- 8.1.3. Online Stores
- 8.1.4. Others
- 8.2. Market Analysis, Insights and Forecast - by Types
- 8.2.1. Carbon Fiber Pool Cue
- 8.2.2. Carbon Fibre Hockey Sticks
- 8.2.3. Carbon Fiber Softball Bats
- 8.2.4. Carbon Fiber Snowboards
- 8.2.5. Carbon Fiber Tennis Racket
- 8.2.6. Others
- 8.1. Market Analysis, Insights and Forecast - by Application
- 9. Middle East & Africa Carbon Fiber Sporting Goods Analysis, Insights and Forecast, 2020-2032
- 9.1. Market Analysis, Insights and Forecast - by Application
- 9.1.1. Hypermarkets/Supermarkets
- 9.1.2. Specialty and Sports Stores
- 9.1.3. Online Stores
- 9.1.4. Others
- 9.2. Market Analysis, Insights and Forecast - by Types
- 9.2.1. Carbon Fiber Pool Cue
- 9.2.2. Carbon Fibre Hockey Sticks
- 9.2.3. Carbon Fiber Softball Bats
- 9.2.4. Carbon Fiber Snowboards
- 9.2.5. Carbon Fiber Tennis Racket
- 9.2.6. Others
- 9.1. Market Analysis, Insights and Forecast - by Application
- 10. Asia Pacific Carbon Fiber Sporting Goods Analysis, Insights and Forecast, 2020-2032
- 10.1. Market Analysis, Insights and Forecast - by Application
- 10.1.1. Hypermarkets/Supermarkets
- 10.1.2. Specialty and Sports Stores
- 10.1.3. Online Stores
- 10.1.4. Others
- 10.2. Market Analysis, Insights and Forecast - by Types
- 10.2.1. Carbon Fiber Pool Cue
- 10.2.2. Carbon Fibre Hockey Sticks
- 10.2.3. Carbon Fiber Softball Bats
- 10.2.4. Carbon Fiber Snowboards
- 10.2.5. Carbon Fiber Tennis Racket
- 10.2.6. Others
- 10.1. Market Analysis, Insights and Forecast - by Application
- 11. Competitive Analysis
- 11.1. Global Market Share Analysis 2025
- 11.2. Company Profiles
- 11.2.1 Wilson
- 11.2.1.1. Overview
- 11.2.1.2. Products
- 11.2.1.3. SWOT Analysis
- 11.2.1.4. Recent Developments
- 11.2.1.5. Financials (Based on Availability)
- 11.2.2 Babolat
- 11.2.2.1. Overview
- 11.2.2.2. Products
- 11.2.2.3. SWOT Analysis
- 11.2.2.4. Recent Developments
- 11.2.2.5. Financials (Based on Availability)
- 11.2.3 Dunlop
- 11.2.3.1. Overview
- 11.2.3.2. Products
- 11.2.3.3. SWOT Analysis
- 11.2.3.4. Recent Developments
- 11.2.3.5. Financials (Based on Availability)
- 11.2.4 Prince Textream
- 11.2.4.1. Overview
- 11.2.4.2. Products
- 11.2.4.3. SWOT Analysis
- 11.2.4.4. Recent Developments
- 11.2.4.5. Financials (Based on Availability)
- 11.2.5 Volkl
- 11.2.5.1. Overview
- 11.2.5.2. Products
- 11.2.5.3. SWOT Analysis
- 11.2.5.4. Recent Developments
- 11.2.5.5. Financials (Based on Availability)
- 11.2.6 HEAD
- 11.2.6.1. Overview
- 11.2.6.2. Products
- 11.2.6.3. SWOT Analysis
- 11.2.6.4. Recent Developments
- 11.2.6.5. Financials (Based on Availability)
- 11.2.7 Yonex
- 11.2.7.1. Overview
- 11.2.7.2. Products
- 11.2.7.3. SWOT Analysis
- 11.2.7.4. Recent Developments
- 11.2.7.5. Financials (Based on Availability)
- 11.2.8 Predator Cues
- 11.2.8.1. Overview
- 11.2.8.2. Products
- 11.2.8.3. SWOT Analysis
- 11.2.8.4. Recent Developments
- 11.2.8.5. Financials (Based on Availability)
- 11.2.9 FURY
- 11.2.9.1. Overview
- 11.2.9.2. Products
- 11.2.9.3. SWOT Analysis
- 11.2.9.4. Recent Developments
- 11.2.9.5. Financials (Based on Availability)
- 11.2.10 RILEY
- 11.2.10.1. Overview
- 11.2.10.2. Products
- 11.2.10.3. SWOT Analysis
- 11.2.10.4. Recent Developments
- 11.2.10.5. Financials (Based on Availability)
- 11.2.11 LIVEX
- 11.2.11.1. Overview
- 11.2.11.2. Products
- 11.2.11.3. SWOT Analysis
- 11.2.11.4. Recent Developments
- 11.2.11.5. Financials (Based on Availability)
- 11.2.12 Cuetec
- 11.2.12.1. Overview
- 11.2.12.2. Products
- 11.2.12.3. SWOT Analysis
- 11.2.12.4. Recent Developments
- 11.2.12.5. Financials (Based on Availability)
- 11.2.13 Bauer
- 11.2.13.1. Overview
- 11.2.13.2. Products
- 11.2.13.3. SWOT Analysis
- 11.2.13.4. Recent Developments
- 11.2.13.5. Financials (Based on Availability)
- 11.2.14 Adidas
- 11.2.14.1. Overview
- 11.2.14.2. Products
- 11.2.14.3. SWOT Analysis
- 11.2.14.4. Recent Developments
- 11.2.14.5. Financials (Based on Availability)
- 11.2.15 Sher-Wood
- 11.2.15.1. Overview
- 11.2.15.2. Products
- 11.2.15.3. SWOT Analysis
- 11.2.15.4. Recent Developments
- 11.2.15.5. Financials (Based on Availability)
- 11.2.16 Grays International
- 11.2.16.1. Overview
- 11.2.16.2. Products
- 11.2.16.3. SWOT Analysis
- 11.2.16.4. Recent Developments
- 11.2.16.5. Financials (Based on Availability)
- 11.2.17 Gryphon Hockey
- 11.2.17.1. Overview
- 11.2.17.2. Products
- 11.2.17.3. SWOT Analysis
- 11.2.17.4. Recent Developments
- 11.2.17.5. Financials (Based on Availability)
- 11.2.18 ATLAS Hockey
- 11.2.18.1. Overview
- 11.2.18.2. Products
- 11.2.18.3. SWOT Analysis
- 11.2.18.4. Recent Developments
- 11.2.18.5. Financials (Based on Availability)
- 11.2.19 Dita International
- 11.2.19.1. Overview
- 11.2.19.2. Products
- 11.2.19.3. SWOT Analysis
- 11.2.19.4. Recent Developments
- 11.2.19.5. Financials (Based on Availability)
- 11.2.20 CCM
- 11.2.20.1. Overview
- 11.2.20.2. Products
- 11.2.20.3. SWOT Analysis
- 11.2.20.4. Recent Developments
- 11.2.20.5. Financials (Based on Availability)
- 11.2.21 Warrior(KBF Enterprises)
- 11.2.21.1. Overview
- 11.2.21.2. Products
- 11.2.21.3. SWOT Analysis
- 11.2.21.4. Recent Developments
- 11.2.21.5. Financials (Based on Availability)
- 11.2.22 Pure Sports
- 11.2.22.1. Overview
- 11.2.22.2. Products
- 11.2.22.3. SWOT Analysis
- 11.2.22.4. Recent Developments
- 11.2.22.5. Financials (Based on Availability)
- 11.2.23 TianChang Zhengmu Aluminum Technology Co.
- 11.2.23.1. Overview
- 11.2.23.2. Products
- 11.2.23.3. SWOT Analysis
- 11.2.23.4. Recent Developments
- 11.2.23.5. Financials (Based on Availability)
- 11.2.24 Ltd
- 11.2.24.1. Overview
- 11.2.24.2. Products
- 11.2.24.3. SWOT Analysis
- 11.2.24.4. Recent Developments
- 11.2.24.5. Financials (Based on Availability)
- 11.2.25 Mizuno
- 11.2.25.1. Overview
- 11.2.25.2. Products
- 11.2.25.3. SWOT Analysis
- 11.2.25.4. Recent Developments
- 11.2.25.5. Financials (Based on Availability)
- 11.2.26 JustBats
- 11.2.26.1. Overview
- 11.2.26.2. Products
- 11.2.26.3. SWOT Analysis
- 11.2.26.4. Recent Developments
- 11.2.26.5. Financials (Based on Availability)
- 11.2.1 Wilson
List of Figures
- Figure 1: Global Carbon Fiber Sporting Goods Revenue Breakdown (million, %) by Region 2025 & 2033
- Figure 2: Global Carbon Fiber Sporting Goods Volume Breakdown (K, %) by Region 2025 & 2033
- Figure 3: North America Carbon Fiber Sporting Goods Revenue (million), by Application 2025 & 2033
- Figure 4: North America Carbon Fiber Sporting Goods Volume (K), by Application 2025 & 2033
- Figure 5: North America Carbon Fiber Sporting Goods Revenue Share (%), by Application 2025 & 2033
- Figure 6: North America Carbon Fiber Sporting Goods Volume Share (%), by Application 2025 & 2033
- Figure 7: North America Carbon Fiber Sporting Goods Revenue (million), by Types 2025 & 2033
- Figure 8: North America Carbon Fiber Sporting Goods Volume (K), by Types 2025 & 2033
- Figure 9: North America Carbon Fiber Sporting Goods Revenue Share (%), by Types 2025 & 2033
- Figure 10: North America Carbon Fiber Sporting Goods Volume Share (%), by Types 2025 & 2033
- Figure 11: North America Carbon Fiber Sporting Goods Revenue (million), by Country 2025 & 2033
- Figure 12: North America Carbon Fiber Sporting Goods Volume (K), by Country 2025 & 2033
- Figure 13: North America Carbon Fiber Sporting Goods Revenue Share (%), by Country 2025 & 2033
- Figure 14: North America Carbon Fiber Sporting Goods Volume Share (%), by Country 2025 & 2033
- Figure 15: South America Carbon Fiber Sporting Goods Revenue (million), by Application 2025 & 2033
- Figure 16: South America Carbon Fiber Sporting Goods Volume (K), by Application 2025 & 2033
- Figure 17: South America Carbon Fiber Sporting Goods Revenue Share (%), by Application 2025 & 2033
- Figure 18: South America Carbon Fiber Sporting Goods Volume Share (%), by Application 2025 & 2033
- Figure 19: South America Carbon Fiber Sporting Goods Revenue (million), by Types 2025 & 2033
- Figure 20: South America Carbon Fiber Sporting Goods Volume (K), by Types 2025 & 2033
- Figure 21: South America Carbon Fiber Sporting Goods Revenue Share (%), by Types 2025 & 2033
- Figure 22: South America Carbon Fiber Sporting Goods Volume Share (%), by Types 2025 & 2033
- Figure 23: South America Carbon Fiber Sporting Goods Revenue (million), by Country 2025 & 2033
- Figure 24: South America Carbon Fiber Sporting Goods Volume (K), by Country 2025 & 2033
- Figure 25: South America Carbon Fiber Sporting Goods Revenue Share (%), by Country 2025 & 2033
- Figure 26: South America Carbon Fiber Sporting Goods Volume Share (%), by Country 2025 & 2033
- Figure 27: Europe Carbon Fiber Sporting Goods Revenue (million), by Application 2025 & 2033
- Figure 28: Europe Carbon Fiber Sporting Goods Volume (K), by Application 2025 & 2033
- Figure 29: Europe Carbon Fiber Sporting Goods Revenue Share (%), by Application 2025 & 2033
- Figure 30: Europe Carbon Fiber Sporting Goods Volume Share (%), by Application 2025 & 2033
- Figure 31: Europe Carbon Fiber Sporting Goods Revenue (million), by Types 2025 & 2033
- Figure 32: Europe Carbon Fiber Sporting Goods Volume (K), by Types 2025 & 2033
- Figure 33: Europe Carbon Fiber Sporting Goods Revenue Share (%), by Types 2025 & 2033
- Figure 34: Europe Carbon Fiber Sporting Goods Volume Share (%), by Types 2025 & 2033
- Figure 35: Europe Carbon Fiber Sporting Goods Revenue (million), by Country 2025 & 2033
- Figure 36: Europe Carbon Fiber Sporting Goods Volume (K), by Country 2025 & 2033
- Figure 37: Europe Carbon Fiber Sporting Goods Revenue Share (%), by Country 2025 & 2033
- Figure 38: Europe Carbon Fiber Sporting Goods Volume Share (%), by Country 2025 & 2033
- Figure 39: Middle East & Africa Carbon Fiber Sporting Goods Revenue (million), by Application 2025 & 2033
- Figure 40: Middle East & Africa Carbon Fiber Sporting Goods Volume (K), by Application 2025 & 2033
- Figure 41: Middle East & Africa Carbon Fiber Sporting Goods Revenue Share (%), by Application 2025 & 2033
- Figure 42: Middle East & Africa Carbon Fiber Sporting Goods Volume Share (%), by Application 2025 & 2033
- Figure 43: Middle East & Africa Carbon Fiber Sporting Goods Revenue (million), by Types 2025 & 2033
- Figure 44: Middle East & Africa Carbon Fiber Sporting Goods Volume (K), by Types 2025 & 2033
- Figure 45: Middle East & Africa Carbon Fiber Sporting Goods Revenue Share (%), by Types 2025 & 2033
- Figure 46: Middle East & Africa Carbon Fiber Sporting Goods Volume Share (%), by Types 2025 & 2033
- Figure 47: Middle East & Africa Carbon Fiber Sporting Goods Revenue (million), by Country 2025 & 2033
- Figure 48: Middle East & Africa Carbon Fiber Sporting Goods Volume (K), by Country 2025 & 2033
- Figure 49: Middle East & Africa Carbon Fiber Sporting Goods Revenue Share (%), by Country 2025 & 2033
- Figure 50: Middle East & Africa Carbon Fiber Sporting Goods Volume Share (%), by Country 2025 & 2033
- Figure 51: Asia Pacific Carbon Fiber Sporting Goods Revenue (million), by Application 2025 & 2033
- Figure 52: Asia Pacific Carbon Fiber Sporting Goods Volume (K), by Application 2025 & 2033
- Figure 53: Asia Pacific Carbon Fiber Sporting Goods Revenue Share (%), by Application 2025 & 2033
- Figure 54: Asia Pacific Carbon Fiber Sporting Goods Volume Share (%), by Application 2025 & 2033
- Figure 55: Asia Pacific Carbon Fiber Sporting Goods Revenue (million), by Types 2025 & 2033
- Figure 56: Asia Pacific Carbon Fiber Sporting Goods Volume (K), by Types 2025 & 2033
- Figure 57: Asia Pacific Carbon Fiber Sporting Goods Revenue Share (%), by Types 2025 & 2033
- Figure 58: Asia Pacific Carbon Fiber Sporting Goods Volume Share (%), by Types 2025 & 2033
- Figure 59: Asia Pacific Carbon Fiber Sporting Goods Revenue (million), by Country 2025 & 2033
- Figure 60: Asia Pacific Carbon Fiber Sporting Goods Volume (K), by Country 2025 & 2033
- Figure 61: Asia Pacific Carbon Fiber Sporting Goods Revenue Share (%), by Country 2025 & 2033
- Figure 62: Asia Pacific Carbon Fiber Sporting Goods Volume Share (%), by Country 2025 & 2033
List of Tables
- Table 1: Global Carbon Fiber Sporting Goods Revenue million Forecast, by Application 2020 & 2033
- Table 2: Global Carbon Fiber Sporting Goods Volume K Forecast, by Application 2020 & 2033
- Table 3: Global Carbon Fiber Sporting Goods Revenue million Forecast, by Types 2020 & 2033
- Table 4: Global Carbon Fiber Sporting Goods Volume K Forecast, by Types 2020 & 2033
- Table 5: Global Carbon Fiber Sporting Goods Revenue million Forecast, by Region 2020 & 2033
- Table 6: Global Carbon Fiber Sporting Goods Volume K Forecast, by Region 2020 & 2033
- Table 7: Global Carbon Fiber Sporting Goods Revenue million Forecast, by Application 2020 & 2033
- Table 8: Global Carbon Fiber Sporting Goods Volume K Forecast, by Application 2020 & 2033
- Table 9: Global Carbon Fiber Sporting Goods Revenue million Forecast, by Types 2020 & 2033
- Table 10: Global Carbon Fiber Sporting Goods Volume K Forecast, by Types 2020 & 2033
- Table 11: Global Carbon Fiber Sporting Goods Revenue million Forecast, by Country 2020 & 2033
- Table 12: Global Carbon Fiber Sporting Goods Volume K Forecast, by Country 2020 & 2033
- Table 13: United States Carbon Fiber Sporting Goods Revenue (million) Forecast, by Application 2020 & 2033
- Table 14: United States Carbon Fiber Sporting Goods Volume (K) Forecast, by Application 2020 & 2033
- Table 15: Canada Carbon Fiber Sporting Goods Revenue (million) Forecast, by Application 2020 & 2033
- Table 16: Canada Carbon Fiber Sporting Goods Volume (K) Forecast, by Application 2020 & 2033
- Table 17: Mexico Carbon Fiber Sporting Goods Revenue (million) Forecast, by Application 2020 & 2033
- Table 18: Mexico Carbon Fiber Sporting Goods Volume (K) Forecast, by Application 2020 & 2033
- Table 19: Global Carbon Fiber Sporting Goods Revenue million Forecast, by Application 2020 & 2033
- Table 20: Global Carbon Fiber Sporting Goods Volume K Forecast, by Application 2020 & 2033
- Table 21: Global Carbon Fiber Sporting Goods Revenue million Forecast, by Types 2020 & 2033
- Table 22: Global Carbon Fiber Sporting Goods Volume K Forecast, by Types 2020 & 2033
- Table 23: Global Carbon Fiber Sporting Goods Revenue million Forecast, by Country 2020 & 2033
- Table 24: Global Carbon Fiber Sporting Goods Volume K Forecast, by Country 2020 & 2033
- Table 25: Brazil Carbon Fiber Sporting Goods Revenue (million) Forecast, by Application 2020 & 2033
- Table 26: Brazil Carbon Fiber Sporting Goods Volume (K) Forecast, by Application 2020 & 2033
- Table 27: Argentina Carbon Fiber Sporting Goods Revenue (million) Forecast, by Application 2020 & 2033
- Table 28: Argentina Carbon Fiber Sporting Goods Volume (K) Forecast, by Application 2020 & 2033
- Table 29: Rest of South America Carbon Fiber Sporting Goods Revenue (million) Forecast, by Application 2020 & 2033
- Table 30: Rest of South America Carbon Fiber Sporting Goods Volume (K) Forecast, by Application 2020 & 2033
- Table 31: Global Carbon Fiber Sporting Goods Revenue million Forecast, by Application 2020 & 2033
- Table 32: Global Carbon Fiber Sporting Goods Volume K Forecast, by Application 2020 & 2033
- Table 33: Global Carbon Fiber Sporting Goods Revenue million Forecast, by Types 2020 & 2033
- Table 34: Global Carbon Fiber Sporting Goods Volume K Forecast, by Types 2020 & 2033
- Table 35: Global Carbon Fiber Sporting Goods Revenue million Forecast, by Country 2020 & 2033
- Table 36: Global Carbon Fiber Sporting Goods Volume K Forecast, by Country 2020 & 2033
- Table 37: United Kingdom Carbon Fiber Sporting Goods Revenue (million) Forecast, by Application 2020 & 2033
- Table 38: United Kingdom Carbon Fiber Sporting Goods Volume (K) Forecast, by Application 2020 & 2033
- Table 39: Germany Carbon Fiber Sporting Goods Revenue (million) Forecast, by Application 2020 & 2033
- Table 40: Germany Carbon Fiber Sporting Goods Volume (K) Forecast, by Application 2020 & 2033
- Table 41: France Carbon Fiber Sporting Goods Revenue (million) Forecast, by Application 2020 & 2033
- Table 42: France Carbon Fiber Sporting Goods Volume (K) Forecast, by Application 2020 & 2033
- Table 43: Italy Carbon Fiber Sporting Goods Revenue (million) Forecast, by Application 2020 & 2033
- Table 44: Italy Carbon Fiber Sporting Goods Volume (K) Forecast, by Application 2020 & 2033
- Table 45: Spain Carbon Fiber Sporting Goods Revenue (million) Forecast, by Application 2020 & 2033
- Table 46: Spain Carbon Fiber Sporting Goods Volume (K) Forecast, by Application 2020 & 2033
- Table 47: Russia Carbon Fiber Sporting Goods Revenue (million) Forecast, by Application 2020 & 2033
- Table 48: Russia Carbon Fiber Sporting Goods Volume (K) Forecast, by Application 2020 & 2033
- Table 49: Benelux Carbon Fiber Sporting Goods Revenue (million) Forecast, by Application 2020 & 2033
- Table 50: Benelux Carbon Fiber Sporting Goods Volume (K) Forecast, by Application 2020 & 2033
- Table 51: Nordics Carbon Fiber Sporting Goods Revenue (million) Forecast, by Application 2020 & 2033
- Table 52: Nordics Carbon Fiber Sporting Goods Volume (K) Forecast, by Application 2020 & 2033
- Table 53: Rest of Europe Carbon Fiber Sporting Goods Revenue (million) Forecast, by Application 2020 & 2033
- Table 54: Rest of Europe Carbon Fiber Sporting Goods Volume (K) Forecast, by Application 2020 & 2033
- Table 55: Global Carbon Fiber Sporting Goods Revenue million Forecast, by Application 2020 & 2033
- Table 56: Global Carbon Fiber Sporting Goods Volume K Forecast, by Application 2020 & 2033
- Table 57: Global Carbon Fiber Sporting Goods Revenue million Forecast, by Types 2020 & 2033
- Table 58: Global Carbon Fiber Sporting Goods Volume K Forecast, by Types 2020 & 2033
- Table 59: Global Carbon Fiber Sporting Goods Revenue million Forecast, by Country 2020 & 2033
- Table 60: Global Carbon Fiber Sporting Goods Volume K Forecast, by Country 2020 & 2033
- Table 61: Turkey Carbon Fiber Sporting Goods Revenue (million) Forecast, by Application 2020 & 2033
- Table 62: Turkey Carbon Fiber Sporting Goods Volume (K) Forecast, by Application 2020 & 2033
- Table 63: Israel Carbon Fiber Sporting Goods Revenue (million) Forecast, by Application 2020 & 2033
- Table 64: Israel Carbon Fiber Sporting Goods Volume (K) Forecast, by Application 2020 & 2033
- Table 65: GCC Carbon Fiber Sporting Goods Revenue (million) Forecast, by Application 2020 & 2033
- Table 66: GCC Carbon Fiber Sporting Goods Volume (K) Forecast, by Application 2020 & 2033
- Table 67: North Africa Carbon Fiber Sporting Goods Revenue (million) Forecast, by Application 2020 & 2033
- Table 68: North Africa Carbon Fiber Sporting Goods Volume (K) Forecast, by Application 2020 & 2033
- Table 69: South Africa Carbon Fiber Sporting Goods Revenue (million) Forecast, by Application 2020 & 2033
- Table 70: South Africa Carbon Fiber Sporting Goods Volume (K) Forecast, by Application 2020 & 2033
- Table 71: Rest of Middle East & Africa Carbon Fiber Sporting Goods Revenue (million) Forecast, by Application 2020 & 2033
- Table 72: Rest of Middle East & Africa Carbon Fiber Sporting Goods Volume (K) Forecast, by Application 2020 & 2033
- Table 73: Global Carbon Fiber Sporting Goods Revenue million Forecast, by Application 2020 & 2033
- Table 74: Global Carbon Fiber Sporting Goods Volume K Forecast, by Application 2020 & 2033
- Table 75: Global Carbon Fiber Sporting Goods Revenue million Forecast, by Types 2020 & 2033
- Table 76: Global Carbon Fiber Sporting Goods Volume K Forecast, by Types 2020 & 2033
- Table 77: Global Carbon Fiber Sporting Goods Revenue million Forecast, by Country 2020 & 2033
- Table 78: Global Carbon Fiber Sporting Goods Volume K Forecast, by Country 2020 & 2033
- Table 79: China Carbon Fiber Sporting Goods Revenue (million) Forecast, by Application 2020 & 2033
- Table 80: China Carbon Fiber Sporting Goods Volume (K) Forecast, by Application 2020 & 2033
- Table 81: India Carbon Fiber Sporting Goods Revenue (million) Forecast, by Application 2020 & 2033
- Table 82: India Carbon Fiber Sporting Goods Volume (K) Forecast, by Application 2020 & 2033
- Table 83: Japan Carbon Fiber Sporting Goods Revenue (million) Forecast, by Application 2020 & 2033
- Table 84: Japan Carbon Fiber Sporting Goods Volume (K) Forecast, by Application 2020 & 2033
- Table 85: South Korea Carbon Fiber Sporting Goods Revenue (million) Forecast, by Application 2020 & 2033
- Table 86: South Korea Carbon Fiber Sporting Goods Volume (K) Forecast, by Application 2020 & 2033
- Table 87: ASEAN Carbon Fiber Sporting Goods Revenue (million) Forecast, by Application 2020 & 2033
- Table 88: ASEAN Carbon Fiber Sporting Goods Volume (K) Forecast, by Application 2020 & 2033
- Table 89: Oceania Carbon Fiber Sporting Goods Revenue (million) Forecast, by Application 2020 & 2033
- Table 90: Oceania Carbon Fiber Sporting Goods Volume (K) Forecast, by Application 2020 & 2033
- Table 91: Rest of Asia Pacific Carbon Fiber Sporting Goods Revenue (million) Forecast, by Application 2020 & 2033
- Table 92: Rest of Asia Pacific Carbon Fiber Sporting Goods Volume (K) Forecast, by Application 2020 & 2033
Frequently Asked Questions
1. What is the projected Compound Annual Growth Rate (CAGR) of the Carbon Fiber Sporting Goods?
The projected CAGR is approximately 8.6%.
2. Which companies are prominent players in the Carbon Fiber Sporting Goods?
Key companies in the market include Wilson, Babolat, Dunlop, Prince Textream, Volkl, HEAD, Yonex, Predator Cues, FURY, RILEY, LIVEX, Cuetec, Bauer, Adidas, Sher-Wood, Grays International, Gryphon Hockey, ATLAS Hockey, Dita International, CCM, Warrior(KBF Enterprises), Pure Sports, TianChang Zhengmu Aluminum Technology Co., Ltd, Mizuno, JustBats.
3. What are the main segments of the Carbon Fiber Sporting Goods?
The market segments include Application, Types.
4. Can you provide details about the market size?
The market size is estimated to be USD 325 million as of 2022.
5. What are some drivers contributing to market growth?
N/A
6. What are the notable trends driving market growth?
N/A
7. Are there any restraints impacting market growth?
N/A
8. Can you provide examples of recent developments in the market?
N/A
9. What pricing options are available for accessing the report?
Pricing options include single-user, multi-user, and enterprise licenses priced at USD 3950.00, USD 5925.00, and USD 7900.00 respectively.
10. Is the market size provided in terms of value or volume?
The market size is provided in terms of value, measured in million and volume, measured in K.
11. Are there any specific market keywords associated with the report?
Yes, the market keyword associated with the report is "Carbon Fiber Sporting Goods," which aids in identifying and referencing the specific market segment covered.
12. How do I determine which pricing option suits my needs best?
The pricing options vary based on user requirements and access needs. Individual users may opt for single-user licenses, while businesses requiring broader access may choose multi-user or enterprise licenses for cost-effective access to the report.
13. Are there any additional resources or data provided in the Carbon Fiber Sporting Goods report?
While the report offers comprehensive insights, it's advisable to review the specific contents or supplementary materials provided to ascertain if additional resources or data are available.
14. How can I stay updated on further developments or reports in the Carbon Fiber Sporting Goods?
To stay informed about further developments, trends, and reports in the Carbon Fiber Sporting Goods, consider subscribing to industry newsletters, following relevant companies and organizations, or regularly checking reputable industry news sources and publications.
Methodology
Step 1 - Identification of Relevant Samples Size from Population Database


Step 2 - Approaches for Defining Global Market Size (Value, Volume* & Price*)

Note*: In applicable scenarios
Step 3 - Data Sources
Primary Research
- Web Analytics
- Survey Reports
- Research Institute
- Latest Research Reports
- Opinion Leaders
Secondary Research
- Annual Reports
- White Paper
- Latest Press Release
- Industry Association
- Paid Database
- Investor Presentations

Step 4 - Data Triangulation
Involves using different sources of information in order to increase the validity of a study
These sources are likely to be stakeholders in a program - participants, other researchers, program staff, other community members, and so on.
Then we put all data in single framework & apply various statistical tools to find out the dynamic on the market.
During the analysis stage, feedback from the stakeholder groups would be compared to determine areas of agreement as well as areas of divergence