

Key Insights
The global ceramic bulletproof vest market is experiencing robust growth, driven by increasing demand from law enforcement agencies, military personnel, and private security firms. The market's expansion is fueled by advancements in ceramic materials science, resulting in lighter, more flexible, and more effective vests offering superior ballistic protection compared to traditional alternatives. Factors such as rising global terrorism and crime rates, coupled with increasing government spending on defense and security, significantly contribute to market expansion. The market is segmented by vest type (e.g., tactical vests, concealed vests), material composition (e.g., alumina, silicon carbide), and end-user (e.g., military, law enforcement). While the high cost of ceramic vests remains a restraint, ongoing technological innovations and the prioritization of personnel safety are expected to offset this factor. We project a steady Compound Annual Growth Rate (CAGR) of approximately 10% for the period 2025-2033, based on current market dynamics and anticipated technological improvements in ceramic materials.
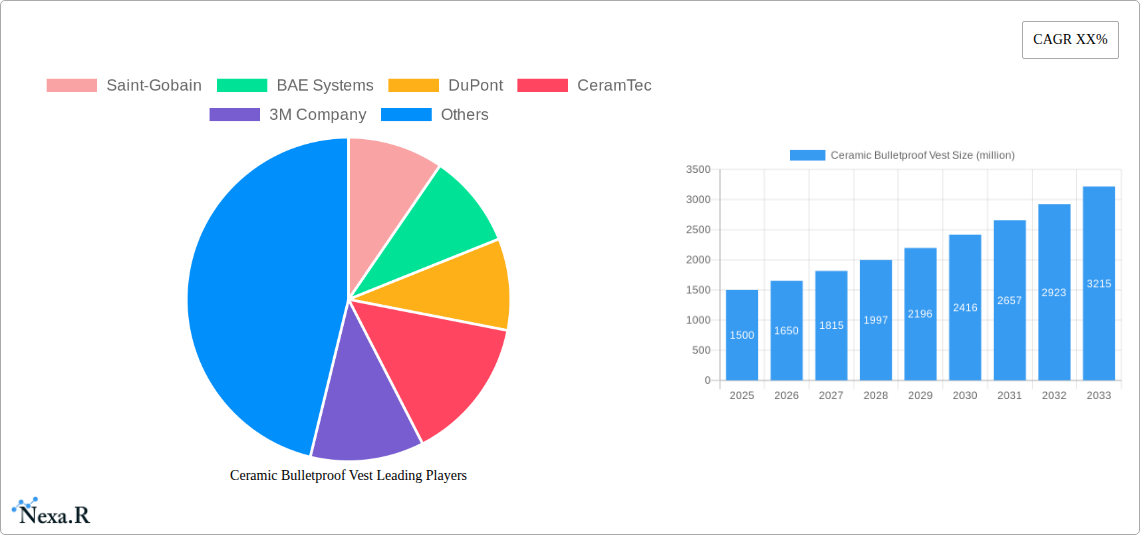
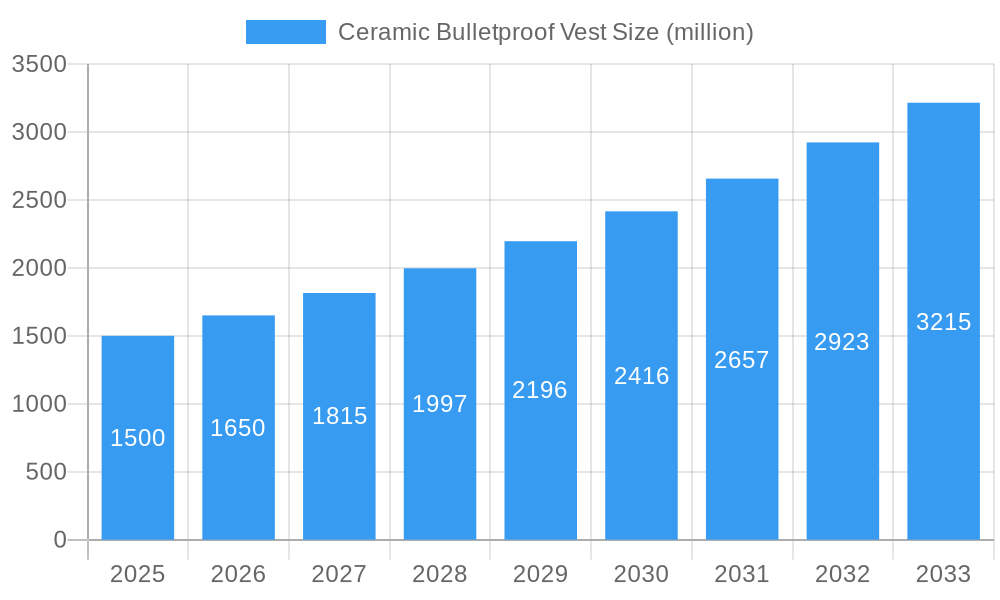
Ceramic Bulletproof Vest Market Size (In Billion)
Leading players like Saint-Gobain, BAE Systems, and DuPont are driving innovation and market share, constantly improving the performance and affordability of ceramic vests. Regional variations in market growth are expected, with North America and Europe anticipated to maintain significant shares due to robust security budgets and the presence of established manufacturers. Emerging markets in Asia-Pacific are also witnessing substantial growth, driven by increasing urbanization and rising security concerns. However, variations in regulatory frameworks and the availability of skilled workforce can impact regional market dynamics. Future growth will be significantly influenced by the adoption of advanced composite materials, integration of smart technologies (e.g., sensors for threat detection), and the development of more ergonomic and comfortable designs to improve wearability and operational efficiency for users.
Ceramic Bulletproof Vest Company Market Share
Ceramic Bulletproof Vest Market Report: 2019-2033
This comprehensive report provides a detailed analysis of the global ceramic bulletproof vest market, offering invaluable insights for industry professionals, investors, and researchers. The study period covers 2019-2033, with a base year of 2025 and a forecast period of 2025-2033. The report leverages extensive primary and secondary research to deliver precise market sizing and growth projections, incorporating granular segmentations for enhanced understanding. This in-depth analysis explores market dynamics, growth trends, leading players, and emerging opportunities within the personal protective equipment (PPE) and law enforcement sectors.
Ceramic Bulletproof Vest Market Dynamics & Structure
The global ceramic bulletproof vest market exhibits a moderately concentrated structure, with key players like Saint-Gobain, BAE Systems, and DuPont holding significant market share (estimated at xx million units combined, representing xx% of the market in 2025). Technological innovation, particularly in ceramic material science and composite designs, is a primary growth driver. Stringent regulatory frameworks governing ballistic protection standards significantly influence product development and adoption. The market also faces competition from alternative materials like polyethylene and aramid fibers. End-users primarily include law enforcement agencies, military personnel, and security professionals. M&A activity within the sector remains moderate, with an estimated xx merger and acquisition deals recorded between 2019 and 2024.
- Market Concentration: Moderately concentrated, with top 5 players holding xx% market share in 2025.
- Technological Innovation: Focus on lightweight, high-performance ceramics and composite materials.
- Regulatory Frameworks: Stringent standards (e.g., NIJ standards) driving product development.
- Competitive Substitutes: Polyethylene and aramid fiber-based vests pose competition.
- End-User Demographics: Law enforcement, military, security personnel are primary consumers.
- M&A Trends: Moderate activity, with approximately xx deals between 2019 and 2024.
Ceramic Bulletproof Vest Growth Trends & Insights
The global ceramic bulletproof vest market is projected to experience robust growth, with a CAGR of xx% during the forecast period (2025-2033). Market size is estimated at xx million units in 2025, expanding to xx million units by 2033. This growth is fueled by increasing demand from law enforcement and military sectors, coupled with advancements in ceramic material technology leading to lighter, more comfortable, and effective vests. Rising terrorism and crime rates globally also contribute significantly. Market penetration is relatively high in developed nations, but substantial growth opportunities exist in emerging economies with increasing security concerns. Technological disruptions, such as the integration of advanced sensors and connectivity features, are further shaping market trends. Consumer behavior shifts reflect a preference for lightweight, comfortable, and highly effective protection.
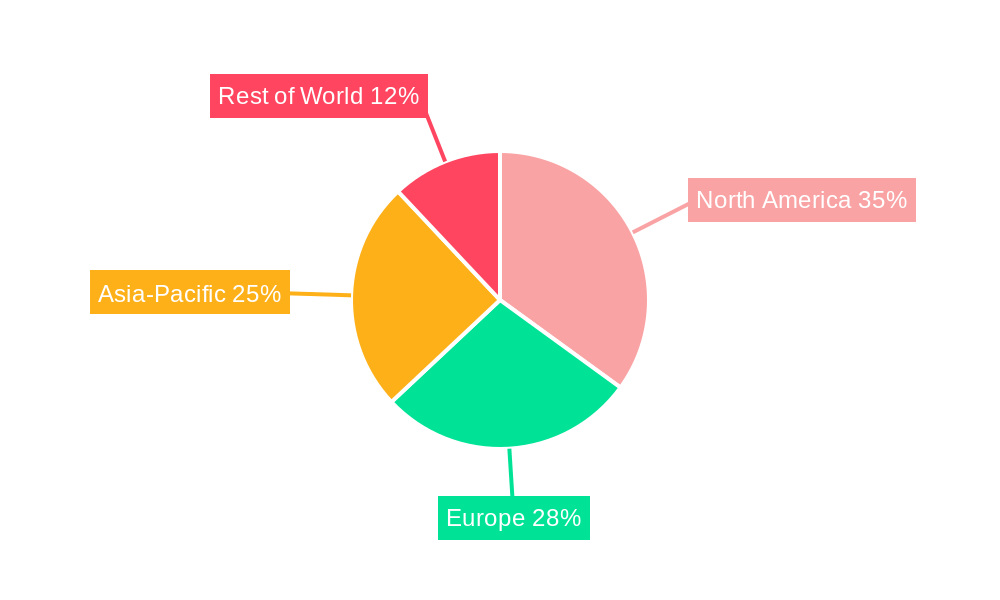
Dominant Regions, Countries, or Segments in Ceramic Bulletproof Vest
North America currently holds the largest market share, driven by strong demand from law enforcement agencies and a well-established security infrastructure. The region's high disposable income and advanced technological capabilities further contribute to its dominance. However, significant growth potential exists in Asia-Pacific, particularly in countries like India and China, experiencing rapid economic development and rising security concerns. The law enforcement segment constitutes the largest share of the market, with the military and private security sectors also contributing significantly.
- North America: High demand, established infrastructure, and advanced technology drive market leadership.
- Asia-Pacific: Rapid economic growth and rising security concerns fuel significant growth potential.
- Europe: Stable market growth, driven by government spending and security needs.
- Law Enforcement Segment: Largest market share due to high demand and governmental procurement.
Ceramic Bulletproof Vest Product Landscape
The market offers a range of ceramic bulletproof vests, categorized by protection level (NIJ standards), weight, size, and design features. Innovations include the use of advanced ceramic materials, enhanced composite structures, and ergonomic designs for improved comfort and mobility. Unique selling propositions often center around superior ballistic protection, lightweight design, and advanced features like integrated communication systems. Technological advancements focus on minimizing weight without sacrificing protection and improving comfort for extended wear.
Key Drivers, Barriers & Challenges in Ceramic Bulletproof Vest
Key Drivers: Increased government spending on defense and security, rising crime rates and terrorism threats, technological advancements resulting in lighter and more effective vests, and growing awareness of personal safety among civilians.
Key Challenges: High manufacturing costs, supply chain disruptions impacting raw material availability, stringent regulatory hurdles for new product approvals, and intense competition among established and emerging players. These factors can lead to price fluctuations and limit market expansion.
Emerging Opportunities in Ceramic Bulletproof Vest
Emerging opportunities include expansion into untapped markets in developing economies, the development of specialized vests for specific threats (e.g., stab-resistant vests), integration of advanced technologies like sensors and GPS tracking, and a growing demand for lightweight and comfortable vests for civilian use.
Growth Accelerators in the Ceramic Bulletproof Vest Industry
Technological advancements in ceramic materials and composite technologies, strategic partnerships between manufacturers and government agencies, increased investments in R&D, and market expansion into emerging economies are key catalysts for long-term market growth.
Key Players Shaping the Ceramic Bulletproof Vest Market
- Saint-Gobain
- BAE Systems
- DuPont
- CeramTec
- 3M Company
- SINTX Technologies
- Armorworks
- Safariland
- CoorsTek
- KDH Defense
- VestGuard
- Olbo & Mehler
- Sarkar Defense
- Cerco Corporation
- Ningbo Dacheng
Notable Milestones in Ceramic Bulletproof Vest Sector
- 2020: Introduction of a new lightweight ceramic composite material by Company X.
- 2022: Merger between Company Y and Company Z, leading to expanded market reach.
- 2023: Launch of a new generation of bulletproof vests with integrated communication systems by Company A.
In-Depth Ceramic Bulletproof Vest Market Outlook
The ceramic bulletproof vest market is poised for sustained growth, driven by continuous technological innovation, increasing security concerns, and expanding demand from diverse end-user segments. Strategic partnerships, R&D investments, and expansion into new markets represent key opportunities for companies operating in this sector. The market's future potential is substantial, particularly in regions with rising security needs and expanding government budgets allocated to public safety and defense.
Ceramic Bulletproof Vest Segmentation
-
1. Application
- 1.1. Civil
- 1.2. Military
-
2. Types
- 2.1. Hard Body Armor
- 2.2. Light Body Armor
Ceramic Bulletproof Vest Segmentation By Geography
-
1. North America
- 1.1. United States
- 1.2. Canada
- 1.3. Mexico
-
2. South America
- 2.1. Brazil
- 2.2. Argentina
- 2.3. Rest of South America
-
3. Europe
- 3.1. United Kingdom
- 3.2. Germany
- 3.3. France
- 3.4. Italy
- 3.5. Spain
- 3.6. Russia
- 3.7. Benelux
- 3.8. Nordics
- 3.9. Rest of Europe
-
4. Middle East & Africa
- 4.1. Turkey
- 4.2. Israel
- 4.3. GCC
- 4.4. North Africa
- 4.5. South Africa
- 4.6. Rest of Middle East & Africa
-
5. Asia Pacific
- 5.1. China
- 5.2. India
- 5.3. Japan
- 5.4. South Korea
- 5.5. ASEAN
- 5.6. Oceania
- 5.7. Rest of Asia Pacific
Ceramic Bulletproof Vest Regional Market Share
Geographic Coverage of Ceramic Bulletproof Vest
Ceramic Bulletproof Vest REPORT HIGHLIGHTS
| Aspects | Details |
|---|---|
| Study Period | 2020-2034 |
| Base Year | 2025 |
| Estimated Year | 2026 |
| Forecast Period | 2026-2034 |
| Historical Period | 2020-2025 |
| Growth Rate | CAGR of XX% from 2020-2034 |
| Segmentation |
|
Table of Contents
- 1. Introduction
- 1.1. Research Scope
- 1.2. Market Segmentation
- 1.3. Research Methodology
- 1.4. Definitions and Assumptions
- 2. Executive Summary
- 2.1. Introduction
- 3. Market Dynamics
- 3.1. Introduction
- 3.2. Market Drivers
- 3.3. Market Restrains
- 3.4. Market Trends
- 4. Market Factor Analysis
- 4.1. Porters Five Forces
- 4.2. Supply/Value Chain
- 4.3. PESTEL analysis
- 4.4. Market Entropy
- 4.5. Patent/Trademark Analysis
- 5. Global Ceramic Bulletproof Vest Analysis, Insights and Forecast, 2020-2032
- 5.1. Market Analysis, Insights and Forecast - by Application
- 5.1.1. Civil
- 5.1.2. Military
- 5.2. Market Analysis, Insights and Forecast - by Types
- 5.2.1. Hard Body Armor
- 5.2.2. Light Body Armor
- 5.3. Market Analysis, Insights and Forecast - by Region
- 5.3.1. North America
- 5.3.2. South America
- 5.3.3. Europe
- 5.3.4. Middle East & Africa
- 5.3.5. Asia Pacific
- 5.1. Market Analysis, Insights and Forecast - by Application
- 6. North America Ceramic Bulletproof Vest Analysis, Insights and Forecast, 2020-2032
- 6.1. Market Analysis, Insights and Forecast - by Application
- 6.1.1. Civil
- 6.1.2. Military
- 6.2. Market Analysis, Insights and Forecast - by Types
- 6.2.1. Hard Body Armor
- 6.2.2. Light Body Armor
- 6.1. Market Analysis, Insights and Forecast - by Application
- 7. South America Ceramic Bulletproof Vest Analysis, Insights and Forecast, 2020-2032
- 7.1. Market Analysis, Insights and Forecast - by Application
- 7.1.1. Civil
- 7.1.2. Military
- 7.2. Market Analysis, Insights and Forecast - by Types
- 7.2.1. Hard Body Armor
- 7.2.2. Light Body Armor
- 7.1. Market Analysis, Insights and Forecast - by Application
- 8. Europe Ceramic Bulletproof Vest Analysis, Insights and Forecast, 2020-2032
- 8.1. Market Analysis, Insights and Forecast - by Application
- 8.1.1. Civil
- 8.1.2. Military
- 8.2. Market Analysis, Insights and Forecast - by Types
- 8.2.1. Hard Body Armor
- 8.2.2. Light Body Armor
- 8.1. Market Analysis, Insights and Forecast - by Application
- 9. Middle East & Africa Ceramic Bulletproof Vest Analysis, Insights and Forecast, 2020-2032
- 9.1. Market Analysis, Insights and Forecast - by Application
- 9.1.1. Civil
- 9.1.2. Military
- 9.2. Market Analysis, Insights and Forecast - by Types
- 9.2.1. Hard Body Armor
- 9.2.2. Light Body Armor
- 9.1. Market Analysis, Insights and Forecast - by Application
- 10. Asia Pacific Ceramic Bulletproof Vest Analysis, Insights and Forecast, 2020-2032
- 10.1. Market Analysis, Insights and Forecast - by Application
- 10.1.1. Civil
- 10.1.2. Military
- 10.2. Market Analysis, Insights and Forecast - by Types
- 10.2.1. Hard Body Armor
- 10.2.2. Light Body Armor
- 10.1. Market Analysis, Insights and Forecast - by Application
- 11. Competitive Analysis
- 11.1. Global Market Share Analysis 2025
- 11.2. Company Profiles
- 11.2.1 Saint-Gobain
- 11.2.1.1. Overview
- 11.2.1.2. Products
- 11.2.1.3. SWOT Analysis
- 11.2.1.4. Recent Developments
- 11.2.1.5. Financials (Based on Availability)
- 11.2.2 BAE Systems
- 11.2.2.1. Overview
- 11.2.2.2. Products
- 11.2.2.3. SWOT Analysis
- 11.2.2.4. Recent Developments
- 11.2.2.5. Financials (Based on Availability)
- 11.2.3 DuPont
- 11.2.3.1. Overview
- 11.2.3.2. Products
- 11.2.3.3. SWOT Analysis
- 11.2.3.4. Recent Developments
- 11.2.3.5. Financials (Based on Availability)
- 11.2.4 CeramTec
- 11.2.4.1. Overview
- 11.2.4.2. Products
- 11.2.4.3. SWOT Analysis
- 11.2.4.4. Recent Developments
- 11.2.4.5. Financials (Based on Availability)
- 11.2.5 3M Company
- 11.2.5.1. Overview
- 11.2.5.2. Products
- 11.2.5.3. SWOT Analysis
- 11.2.5.4. Recent Developments
- 11.2.5.5. Financials (Based on Availability)
- 11.2.6 SINTX Technologies
- 11.2.6.1. Overview
- 11.2.6.2. Products
- 11.2.6.3. SWOT Analysis
- 11.2.6.4. Recent Developments
- 11.2.6.5. Financials (Based on Availability)
- 11.2.7 Armorworks
- 11.2.7.1. Overview
- 11.2.7.2. Products
- 11.2.7.3. SWOT Analysis
- 11.2.7.4. Recent Developments
- 11.2.7.5. Financials (Based on Availability)
- 11.2.8 Safariland
- 11.2.8.1. Overview
- 11.2.8.2. Products
- 11.2.8.3. SWOT Analysis
- 11.2.8.4. Recent Developments
- 11.2.8.5. Financials (Based on Availability)
- 11.2.9 CoorsTek
- 11.2.9.1. Overview
- 11.2.9.2. Products
- 11.2.9.3. SWOT Analysis
- 11.2.9.4. Recent Developments
- 11.2.9.5. Financials (Based on Availability)
- 11.2.10 KDH Defense
- 11.2.10.1. Overview
- 11.2.10.2. Products
- 11.2.10.3. SWOT Analysis
- 11.2.10.4. Recent Developments
- 11.2.10.5. Financials (Based on Availability)
- 11.2.11 VestGuard
- 11.2.11.1. Overview
- 11.2.11.2. Products
- 11.2.11.3. SWOT Analysis
- 11.2.11.4. Recent Developments
- 11.2.11.5. Financials (Based on Availability)
- 11.2.12 Olbo & Mehler
- 11.2.12.1. Overview
- 11.2.12.2. Products
- 11.2.12.3. SWOT Analysis
- 11.2.12.4. Recent Developments
- 11.2.12.5. Financials (Based on Availability)
- 11.2.13 Sarkar Defense
- 11.2.13.1. Overview
- 11.2.13.2. Products
- 11.2.13.3. SWOT Analysis
- 11.2.13.4. Recent Developments
- 11.2.13.5. Financials (Based on Availability)
- 11.2.14 Cerco Corporation
- 11.2.14.1. Overview
- 11.2.14.2. Products
- 11.2.14.3. SWOT Analysis
- 11.2.14.4. Recent Developments
- 11.2.14.5. Financials (Based on Availability)
- 11.2.15 Ningbo Dacheng
- 11.2.15.1. Overview
- 11.2.15.2. Products
- 11.2.15.3. SWOT Analysis
- 11.2.15.4. Recent Developments
- 11.2.15.5. Financials (Based on Availability)
- 11.2.1 Saint-Gobain
List of Figures
- Figure 1: Global Ceramic Bulletproof Vest Revenue Breakdown (million, %) by Region 2025 & 2033
- Figure 2: Global Ceramic Bulletproof Vest Volume Breakdown (K, %) by Region 2025 & 2033
- Figure 3: North America Ceramic Bulletproof Vest Revenue (million), by Application 2025 & 2033
- Figure 4: North America Ceramic Bulletproof Vest Volume (K), by Application 2025 & 2033
- Figure 5: North America Ceramic Bulletproof Vest Revenue Share (%), by Application 2025 & 2033
- Figure 6: North America Ceramic Bulletproof Vest Volume Share (%), by Application 2025 & 2033
- Figure 7: North America Ceramic Bulletproof Vest Revenue (million), by Types 2025 & 2033
- Figure 8: North America Ceramic Bulletproof Vest Volume (K), by Types 2025 & 2033
- Figure 9: North America Ceramic Bulletproof Vest Revenue Share (%), by Types 2025 & 2033
- Figure 10: North America Ceramic Bulletproof Vest Volume Share (%), by Types 2025 & 2033
- Figure 11: North America Ceramic Bulletproof Vest Revenue (million), by Country 2025 & 2033
- Figure 12: North America Ceramic Bulletproof Vest Volume (K), by Country 2025 & 2033
- Figure 13: North America Ceramic Bulletproof Vest Revenue Share (%), by Country 2025 & 2033
- Figure 14: North America Ceramic Bulletproof Vest Volume Share (%), by Country 2025 & 2033
- Figure 15: South America Ceramic Bulletproof Vest Revenue (million), by Application 2025 & 2033
- Figure 16: South America Ceramic Bulletproof Vest Volume (K), by Application 2025 & 2033
- Figure 17: South America Ceramic Bulletproof Vest Revenue Share (%), by Application 2025 & 2033
- Figure 18: South America Ceramic Bulletproof Vest Volume Share (%), by Application 2025 & 2033
- Figure 19: South America Ceramic Bulletproof Vest Revenue (million), by Types 2025 & 2033
- Figure 20: South America Ceramic Bulletproof Vest Volume (K), by Types 2025 & 2033
- Figure 21: South America Ceramic Bulletproof Vest Revenue Share (%), by Types 2025 & 2033
- Figure 22: South America Ceramic Bulletproof Vest Volume Share (%), by Types 2025 & 2033
- Figure 23: South America Ceramic Bulletproof Vest Revenue (million), by Country 2025 & 2033
- Figure 24: South America Ceramic Bulletproof Vest Volume (K), by Country 2025 & 2033
- Figure 25: South America Ceramic Bulletproof Vest Revenue Share (%), by Country 2025 & 2033
- Figure 26: South America Ceramic Bulletproof Vest Volume Share (%), by Country 2025 & 2033
- Figure 27: Europe Ceramic Bulletproof Vest Revenue (million), by Application 2025 & 2033
- Figure 28: Europe Ceramic Bulletproof Vest Volume (K), by Application 2025 & 2033
- Figure 29: Europe Ceramic Bulletproof Vest Revenue Share (%), by Application 2025 & 2033
- Figure 30: Europe Ceramic Bulletproof Vest Volume Share (%), by Application 2025 & 2033
- Figure 31: Europe Ceramic Bulletproof Vest Revenue (million), by Types 2025 & 2033
- Figure 32: Europe Ceramic Bulletproof Vest Volume (K), by Types 2025 & 2033
- Figure 33: Europe Ceramic Bulletproof Vest Revenue Share (%), by Types 2025 & 2033
- Figure 34: Europe Ceramic Bulletproof Vest Volume Share (%), by Types 2025 & 2033
- Figure 35: Europe Ceramic Bulletproof Vest Revenue (million), by Country 2025 & 2033
- Figure 36: Europe Ceramic Bulletproof Vest Volume (K), by Country 2025 & 2033
- Figure 37: Europe Ceramic Bulletproof Vest Revenue Share (%), by Country 2025 & 2033
- Figure 38: Europe Ceramic Bulletproof Vest Volume Share (%), by Country 2025 & 2033
- Figure 39: Middle East & Africa Ceramic Bulletproof Vest Revenue (million), by Application 2025 & 2033
- Figure 40: Middle East & Africa Ceramic Bulletproof Vest Volume (K), by Application 2025 & 2033
- Figure 41: Middle East & Africa Ceramic Bulletproof Vest Revenue Share (%), by Application 2025 & 2033
- Figure 42: Middle East & Africa Ceramic Bulletproof Vest Volume Share (%), by Application 2025 & 2033
- Figure 43: Middle East & Africa Ceramic Bulletproof Vest Revenue (million), by Types 2025 & 2033
- Figure 44: Middle East & Africa Ceramic Bulletproof Vest Volume (K), by Types 2025 & 2033
- Figure 45: Middle East & Africa Ceramic Bulletproof Vest Revenue Share (%), by Types 2025 & 2033
- Figure 46: Middle East & Africa Ceramic Bulletproof Vest Volume Share (%), by Types 2025 & 2033
- Figure 47: Middle East & Africa Ceramic Bulletproof Vest Revenue (million), by Country 2025 & 2033
- Figure 48: Middle East & Africa Ceramic Bulletproof Vest Volume (K), by Country 2025 & 2033
- Figure 49: Middle East & Africa Ceramic Bulletproof Vest Revenue Share (%), by Country 2025 & 2033
- Figure 50: Middle East & Africa Ceramic Bulletproof Vest Volume Share (%), by Country 2025 & 2033
- Figure 51: Asia Pacific Ceramic Bulletproof Vest Revenue (million), by Application 2025 & 2033
- Figure 52: Asia Pacific Ceramic Bulletproof Vest Volume (K), by Application 2025 & 2033
- Figure 53: Asia Pacific Ceramic Bulletproof Vest Revenue Share (%), by Application 2025 & 2033
- Figure 54: Asia Pacific Ceramic Bulletproof Vest Volume Share (%), by Application 2025 & 2033
- Figure 55: Asia Pacific Ceramic Bulletproof Vest Revenue (million), by Types 2025 & 2033
- Figure 56: Asia Pacific Ceramic Bulletproof Vest Volume (K), by Types 2025 & 2033
- Figure 57: Asia Pacific Ceramic Bulletproof Vest Revenue Share (%), by Types 2025 & 2033
- Figure 58: Asia Pacific Ceramic Bulletproof Vest Volume Share (%), by Types 2025 & 2033
- Figure 59: Asia Pacific Ceramic Bulletproof Vest Revenue (million), by Country 2025 & 2033
- Figure 60: Asia Pacific Ceramic Bulletproof Vest Volume (K), by Country 2025 & 2033
- Figure 61: Asia Pacific Ceramic Bulletproof Vest Revenue Share (%), by Country 2025 & 2033
- Figure 62: Asia Pacific Ceramic Bulletproof Vest Volume Share (%), by Country 2025 & 2033
List of Tables
- Table 1: Global Ceramic Bulletproof Vest Revenue million Forecast, by Application 2020 & 2033
- Table 2: Global Ceramic Bulletproof Vest Volume K Forecast, by Application 2020 & 2033
- Table 3: Global Ceramic Bulletproof Vest Revenue million Forecast, by Types 2020 & 2033
- Table 4: Global Ceramic Bulletproof Vest Volume K Forecast, by Types 2020 & 2033
- Table 5: Global Ceramic Bulletproof Vest Revenue million Forecast, by Region 2020 & 2033
- Table 6: Global Ceramic Bulletproof Vest Volume K Forecast, by Region 2020 & 2033
- Table 7: Global Ceramic Bulletproof Vest Revenue million Forecast, by Application 2020 & 2033
- Table 8: Global Ceramic Bulletproof Vest Volume K Forecast, by Application 2020 & 2033
- Table 9: Global Ceramic Bulletproof Vest Revenue million Forecast, by Types 2020 & 2033
- Table 10: Global Ceramic Bulletproof Vest Volume K Forecast, by Types 2020 & 2033
- Table 11: Global Ceramic Bulletproof Vest Revenue million Forecast, by Country 2020 & 2033
- Table 12: Global Ceramic Bulletproof Vest Volume K Forecast, by Country 2020 & 2033
- Table 13: United States Ceramic Bulletproof Vest Revenue (million) Forecast, by Application 2020 & 2033
- Table 14: United States Ceramic Bulletproof Vest Volume (K) Forecast, by Application 2020 & 2033
- Table 15: Canada Ceramic Bulletproof Vest Revenue (million) Forecast, by Application 2020 & 2033
- Table 16: Canada Ceramic Bulletproof Vest Volume (K) Forecast, by Application 2020 & 2033
- Table 17: Mexico Ceramic Bulletproof Vest Revenue (million) Forecast, by Application 2020 & 2033
- Table 18: Mexico Ceramic Bulletproof Vest Volume (K) Forecast, by Application 2020 & 2033
- Table 19: Global Ceramic Bulletproof Vest Revenue million Forecast, by Application 2020 & 2033
- Table 20: Global Ceramic Bulletproof Vest Volume K Forecast, by Application 2020 & 2033
- Table 21: Global Ceramic Bulletproof Vest Revenue million Forecast, by Types 2020 & 2033
- Table 22: Global Ceramic Bulletproof Vest Volume K Forecast, by Types 2020 & 2033
- Table 23: Global Ceramic Bulletproof Vest Revenue million Forecast, by Country 2020 & 2033
- Table 24: Global Ceramic Bulletproof Vest Volume K Forecast, by Country 2020 & 2033
- Table 25: Brazil Ceramic Bulletproof Vest Revenue (million) Forecast, by Application 2020 & 2033
- Table 26: Brazil Ceramic Bulletproof Vest Volume (K) Forecast, by Application 2020 & 2033
- Table 27: Argentina Ceramic Bulletproof Vest Revenue (million) Forecast, by Application 2020 & 2033
- Table 28: Argentina Ceramic Bulletproof Vest Volume (K) Forecast, by Application 2020 & 2033
- Table 29: Rest of South America Ceramic Bulletproof Vest Revenue (million) Forecast, by Application 2020 & 2033
- Table 30: Rest of South America Ceramic Bulletproof Vest Volume (K) Forecast, by Application 2020 & 2033
- Table 31: Global Ceramic Bulletproof Vest Revenue million Forecast, by Application 2020 & 2033
- Table 32: Global Ceramic Bulletproof Vest Volume K Forecast, by Application 2020 & 2033
- Table 33: Global Ceramic Bulletproof Vest Revenue million Forecast, by Types 2020 & 2033
- Table 34: Global Ceramic Bulletproof Vest Volume K Forecast, by Types 2020 & 2033
- Table 35: Global Ceramic Bulletproof Vest Revenue million Forecast, by Country 2020 & 2033
- Table 36: Global Ceramic Bulletproof Vest Volume K Forecast, by Country 2020 & 2033
- Table 37: United Kingdom Ceramic Bulletproof Vest Revenue (million) Forecast, by Application 2020 & 2033
- Table 38: United Kingdom Ceramic Bulletproof Vest Volume (K) Forecast, by Application 2020 & 2033
- Table 39: Germany Ceramic Bulletproof Vest Revenue (million) Forecast, by Application 2020 & 2033
- Table 40: Germany Ceramic Bulletproof Vest Volume (K) Forecast, by Application 2020 & 2033
- Table 41: France Ceramic Bulletproof Vest Revenue (million) Forecast, by Application 2020 & 2033
- Table 42: France Ceramic Bulletproof Vest Volume (K) Forecast, by Application 2020 & 2033
- Table 43: Italy Ceramic Bulletproof Vest Revenue (million) Forecast, by Application 2020 & 2033
- Table 44: Italy Ceramic Bulletproof Vest Volume (K) Forecast, by Application 2020 & 2033
- Table 45: Spain Ceramic Bulletproof Vest Revenue (million) Forecast, by Application 2020 & 2033
- Table 46: Spain Ceramic Bulletproof Vest Volume (K) Forecast, by Application 2020 & 2033
- Table 47: Russia Ceramic Bulletproof Vest Revenue (million) Forecast, by Application 2020 & 2033
- Table 48: Russia Ceramic Bulletproof Vest Volume (K) Forecast, by Application 2020 & 2033
- Table 49: Benelux Ceramic Bulletproof Vest Revenue (million) Forecast, by Application 2020 & 2033
- Table 50: Benelux Ceramic Bulletproof Vest Volume (K) Forecast, by Application 2020 & 2033
- Table 51: Nordics Ceramic Bulletproof Vest Revenue (million) Forecast, by Application 2020 & 2033
- Table 52: Nordics Ceramic Bulletproof Vest Volume (K) Forecast, by Application 2020 & 2033
- Table 53: Rest of Europe Ceramic Bulletproof Vest Revenue (million) Forecast, by Application 2020 & 2033
- Table 54: Rest of Europe Ceramic Bulletproof Vest Volume (K) Forecast, by Application 2020 & 2033
- Table 55: Global Ceramic Bulletproof Vest Revenue million Forecast, by Application 2020 & 2033
- Table 56: Global Ceramic Bulletproof Vest Volume K Forecast, by Application 2020 & 2033
- Table 57: Global Ceramic Bulletproof Vest Revenue million Forecast, by Types 2020 & 2033
- Table 58: Global Ceramic Bulletproof Vest Volume K Forecast, by Types 2020 & 2033
- Table 59: Global Ceramic Bulletproof Vest Revenue million Forecast, by Country 2020 & 2033
- Table 60: Global Ceramic Bulletproof Vest Volume K Forecast, by Country 2020 & 2033
- Table 61: Turkey Ceramic Bulletproof Vest Revenue (million) Forecast, by Application 2020 & 2033
- Table 62: Turkey Ceramic Bulletproof Vest Volume (K) Forecast, by Application 2020 & 2033
- Table 63: Israel Ceramic Bulletproof Vest Revenue (million) Forecast, by Application 2020 & 2033
- Table 64: Israel Ceramic Bulletproof Vest Volume (K) Forecast, by Application 2020 & 2033
- Table 65: GCC Ceramic Bulletproof Vest Revenue (million) Forecast, by Application 2020 & 2033
- Table 66: GCC Ceramic Bulletproof Vest Volume (K) Forecast, by Application 2020 & 2033
- Table 67: North Africa Ceramic Bulletproof Vest Revenue (million) Forecast, by Application 2020 & 2033
- Table 68: North Africa Ceramic Bulletproof Vest Volume (K) Forecast, by Application 2020 & 2033
- Table 69: South Africa Ceramic Bulletproof Vest Revenue (million) Forecast, by Application 2020 & 2033
- Table 70: South Africa Ceramic Bulletproof Vest Volume (K) Forecast, by Application 2020 & 2033
- Table 71: Rest of Middle East & Africa Ceramic Bulletproof Vest Revenue (million) Forecast, by Application 2020 & 2033
- Table 72: Rest of Middle East & Africa Ceramic Bulletproof Vest Volume (K) Forecast, by Application 2020 & 2033
- Table 73: Global Ceramic Bulletproof Vest Revenue million Forecast, by Application 2020 & 2033
- Table 74: Global Ceramic Bulletproof Vest Volume K Forecast, by Application 2020 & 2033
- Table 75: Global Ceramic Bulletproof Vest Revenue million Forecast, by Types 2020 & 2033
- Table 76: Global Ceramic Bulletproof Vest Volume K Forecast, by Types 2020 & 2033
- Table 77: Global Ceramic Bulletproof Vest Revenue million Forecast, by Country 2020 & 2033
- Table 78: Global Ceramic Bulletproof Vest Volume K Forecast, by Country 2020 & 2033
- Table 79: China Ceramic Bulletproof Vest Revenue (million) Forecast, by Application 2020 & 2033
- Table 80: China Ceramic Bulletproof Vest Volume (K) Forecast, by Application 2020 & 2033
- Table 81: India Ceramic Bulletproof Vest Revenue (million) Forecast, by Application 2020 & 2033
- Table 82: India Ceramic Bulletproof Vest Volume (K) Forecast, by Application 2020 & 2033
- Table 83: Japan Ceramic Bulletproof Vest Revenue (million) Forecast, by Application 2020 & 2033
- Table 84: Japan Ceramic Bulletproof Vest Volume (K) Forecast, by Application 2020 & 2033
- Table 85: South Korea Ceramic Bulletproof Vest Revenue (million) Forecast, by Application 2020 & 2033
- Table 86: South Korea Ceramic Bulletproof Vest Volume (K) Forecast, by Application 2020 & 2033
- Table 87: ASEAN Ceramic Bulletproof Vest Revenue (million) Forecast, by Application 2020 & 2033
- Table 88: ASEAN Ceramic Bulletproof Vest Volume (K) Forecast, by Application 2020 & 2033
- Table 89: Oceania Ceramic Bulletproof Vest Revenue (million) Forecast, by Application 2020 & 2033
- Table 90: Oceania Ceramic Bulletproof Vest Volume (K) Forecast, by Application 2020 & 2033
- Table 91: Rest of Asia Pacific Ceramic Bulletproof Vest Revenue (million) Forecast, by Application 2020 & 2033
- Table 92: Rest of Asia Pacific Ceramic Bulletproof Vest Volume (K) Forecast, by Application 2020 & 2033
Frequently Asked Questions
1. What is the projected Compound Annual Growth Rate (CAGR) of the Ceramic Bulletproof Vest?
The projected CAGR is approximately XX%.
2. Which companies are prominent players in the Ceramic Bulletproof Vest?
Key companies in the market include Saint-Gobain, BAE Systems, DuPont, CeramTec, 3M Company, SINTX Technologies, Armorworks, Safariland, CoorsTek, KDH Defense, VestGuard, Olbo & Mehler, Sarkar Defense, Cerco Corporation, Ningbo Dacheng.
3. What are the main segments of the Ceramic Bulletproof Vest?
The market segments include Application, Types.
4. Can you provide details about the market size?
The market size is estimated to be USD XXX million as of 2022.
5. What are some drivers contributing to market growth?
N/A
6. What are the notable trends driving market growth?
N/A
7. Are there any restraints impacting market growth?
N/A
8. Can you provide examples of recent developments in the market?
N/A
9. What pricing options are available for accessing the report?
Pricing options include single-user, multi-user, and enterprise licenses priced at USD 3350.00, USD 5025.00, and USD 6700.00 respectively.
10. Is the market size provided in terms of value or volume?
The market size is provided in terms of value, measured in million and volume, measured in K.
11. Are there any specific market keywords associated with the report?
Yes, the market keyword associated with the report is "Ceramic Bulletproof Vest," which aids in identifying and referencing the specific market segment covered.
12. How do I determine which pricing option suits my needs best?
The pricing options vary based on user requirements and access needs. Individual users may opt for single-user licenses, while businesses requiring broader access may choose multi-user or enterprise licenses for cost-effective access to the report.
13. Are there any additional resources or data provided in the Ceramic Bulletproof Vest report?
While the report offers comprehensive insights, it's advisable to review the specific contents or supplementary materials provided to ascertain if additional resources or data are available.
14. How can I stay updated on further developments or reports in the Ceramic Bulletproof Vest?
To stay informed about further developments, trends, and reports in the Ceramic Bulletproof Vest, consider subscribing to industry newsletters, following relevant companies and organizations, or regularly checking reputable industry news sources and publications.
Methodology
Step 1 - Identification of Relevant Samples Size from Population Database


Step 2 - Approaches for Defining Global Market Size (Value, Volume* & Price*)

Note*: In applicable scenarios
Step 3 - Data Sources
Primary Research
- Web Analytics
- Survey Reports
- Research Institute
- Latest Research Reports
- Opinion Leaders
Secondary Research
- Annual Reports
- White Paper
- Latest Press Release
- Industry Association
- Paid Database
- Investor Presentations

Step 4 - Data Triangulation
Involves using different sources of information in order to increase the validity of a study
These sources are likely to be stakeholders in a program - participants, other researchers, program staff, other community members, and so on.
Then we put all data in single framework & apply various statistical tools to find out the dynamic on the market.
During the analysis stage, feedback from the stakeholder groups would be compared to determine areas of agreement as well as areas of divergence