

Key Insights
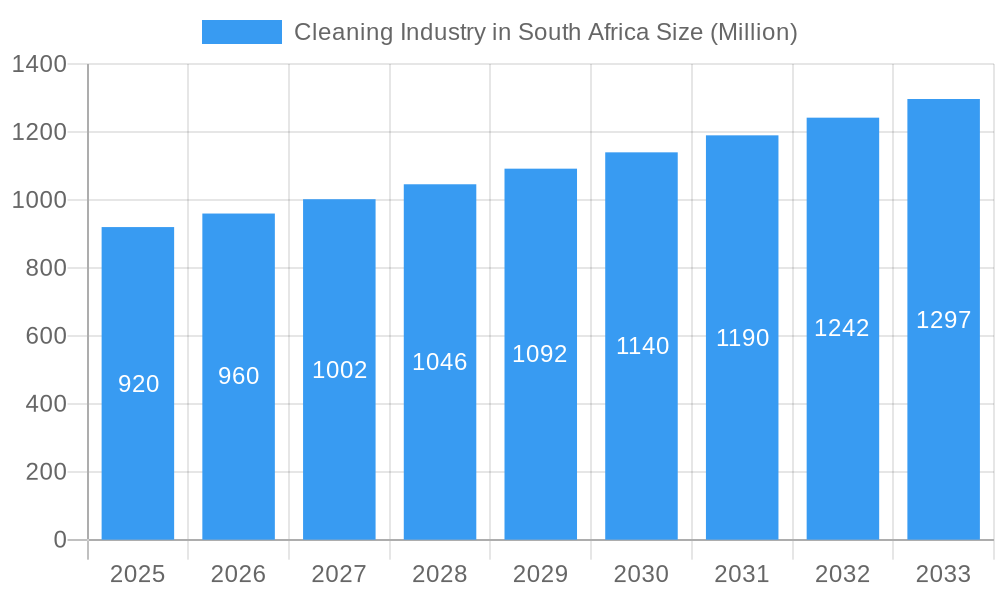
The South African cleaning industry, valued at $0.92 billion in 2025, is projected to experience robust growth, driven by increasing urbanization, rising disposable incomes, and a growing awareness of hygiene and sanitation. This expanding market is segmented by distribution channel (offline and online), product type (cleaning equipment, consumables like chemicals, powders, and gels), and end-user (residential and commercial/industrial). The offline channel currently dominates, but the online segment is experiencing significant growth fueled by e-commerce expansion and increased internet penetration. The demand for sophisticated cleaning equipment, particularly in the commercial and industrial sectors, is a major growth driver, alongside the rising popularity of eco-friendly cleaning products. However, economic fluctuations and potential supply chain disruptions pose challenges to sustained growth. Key players like Tevo (Pty) Ltd, Dyson James Ltd, and Nilfisk Group are actively competing, investing in innovation, and expanding their product portfolios to cater to diverse consumer needs and market segments. The industry's future hinges on adapting to evolving consumer preferences, embracing sustainable practices, and effectively navigating economic uncertainties. Growth is expected to be concentrated in urban areas and key economic hubs within South Africa, reflecting higher purchasing power and increased demand for professional cleaning services. Furthermore, government initiatives promoting hygiene and sanitation in public spaces are likely to positively influence market expansion.
Cleaning Industry in South Africa Market Size (In Million)
The forecast period of 2025-2033 anticipates a compound annual growth rate (CAGR) of 4.38%. This growth trajectory is anticipated to be influenced by a combination of factors, including ongoing urbanization, sustained economic growth (despite potential fluctuations), and a rising middle class with increased disposable income for both household and professional cleaning solutions. While the offline channel will likely retain a significant market share, the online segment will continue to capture a progressively larger share of the market, particularly in metropolitan regions with higher internet penetration. This trend will necessitate investments in e-commerce capabilities and online marketing strategies by established players and emerging businesses alike. The continuing focus on environmentally friendly cleaning solutions will represent a key area of innovation and competition, shaping product development and marketing efforts.
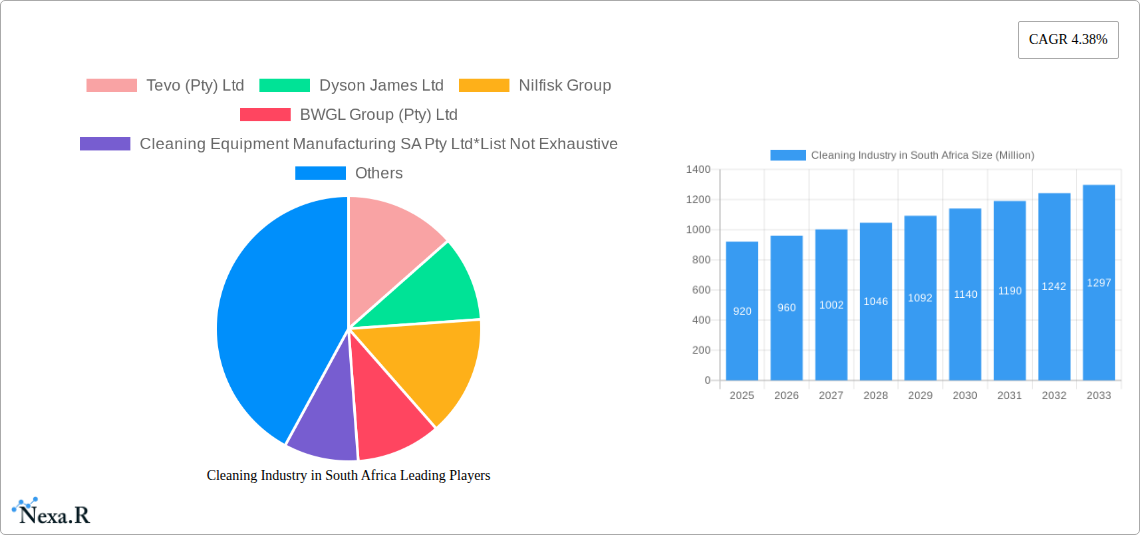
Cleaning Industry in South Africa Company Market Share
Cleaning Industry in South Africa: Market Report 2019-2033
This comprehensive report provides a detailed analysis of the South African cleaning industry, encompassing market dynamics, growth trends, key players, and future outlook. With a study period spanning 2019-2033, a base year of 2025, and an estimated year of 2025, this report is an invaluable resource for industry professionals, investors, and stakeholders seeking to understand and capitalize on opportunities within this dynamic sector. The report utilizes data expressed in millions of units (ZAR).
Cleaning Industry in South Africa Market Dynamics & Structure
The South African cleaning industry is characterized by a moderately concentrated market with several key players competing across various segments. Technological innovation, driven by increasing consumer demand for efficient and sustainable cleaning solutions, is a major driver. Regulatory frameworks concerning environmental protection and worker safety are constantly evolving, impacting product formulations and operational practices. The industry faces competition from substitute products, particularly in the residential segment, where DIY cleaning methods remain prevalent. End-user demographics, influenced by urbanization and rising disposable incomes, are shifting the demand towards specialized cleaning solutions for commercial and industrial applications. M&A activity in the sector remains relatively modest, with a projected xx number of deals during the forecast period (2025-2033), reflecting a trend towards consolidation among larger players.
- Market Concentration: Moderately concentrated, with top 5 players holding an estimated xx% market share in 2025.
- Technological Innovation: Focus on automation, eco-friendly products, and smart cleaning technologies.
- Regulatory Framework: Stringent regulations regarding chemical usage and waste disposal.
- Competitive Substitutes: DIY cleaning methods pose a significant challenge in the residential segment.
- End-User Demographics: Growth in commercial/industrial segment driven by urbanization and economic growth.
- M&A Trends: Consolidation expected, with xx-xx M&A deals projected between 2025 and 2033.
Cleaning Industry in South Africa Growth Trends & Insights
The South African cleaning industry demonstrates consistent growth, propelled by a combination of factors. Market size expanded from xx million in 2019 to an estimated xx million in 2025, with a projected CAGR of xx% during the forecast period (2025-2033). Adoption rates for advanced cleaning technologies, particularly in the commercial and industrial sectors, are steadily increasing. Technological disruptions, such as the introduction of robotic cleaning systems and smart home integration, are reshaping consumer preferences and creating new market opportunities. Consumer behavior is shifting towards eco-friendly and sustainable cleaning products, leading to increased demand for natural and biodegradable solutions.
Dominant Regions, Countries, or Segments in Cleaning Industry in South Africa
The Gauteng province dominates the South African cleaning market, driven by its high population density, significant commercial activity, and robust industrial base. Within the product types, Cleaning Equipment holds the largest market share, followed by Other Cleaning Equipment (Consumables, Chemicals, Powders and Gels). The offline channel continues to be the primary distribution channel, although the online segment is experiencing substantial growth, driven by increased e-commerce penetration. The commercial/industrial segment exhibits the highest growth potential due to sustained economic activity and investments in infrastructure development.
- Leading Region: Gauteng province
- Leading Product Type: Cleaning Equipment
- Leading Distribution Channel: Offline Channel
- Fastest Growing Segment: Commercial/Industrial
- Key Drivers: Urbanization, economic growth, infrastructural development.
Cleaning Industry in South Africa Product Landscape
The South African cleaning industry product landscape is characterized by a diverse range of products, catering to various needs and preferences. Innovation focuses on enhancing efficiency, sustainability, and user-friendliness. Products range from traditional cleaning agents to sophisticated robotic cleaning systems and technologically advanced vacuum cleaners. Key selling points include ease of use, eco-friendly formulations, and advanced cleaning capabilities. Technological advancements such as smart sensors, IoT integration, and advanced filtration systems are increasingly incorporated into new product offerings.
Key Drivers, Barriers & Challenges in Cleaning Industry in South Africa
Key Drivers: Increasing urbanization, rising disposable incomes, heightened awareness of hygiene and sanitation, and government initiatives promoting sustainable practices are significant drivers. Technological advancements like automation and eco-friendly products also fuel market growth.
Key Challenges: Economic instability and fluctuating exchange rates can impact consumer spending and input costs. Supply chain disruptions, particularly concerning raw materials, can constrain production and lead to price increases. Intense competition and the presence of counterfeit products pose challenges to established players.
Emerging Opportunities in Cleaning Industry in South Africa
Emerging opportunities lie in the increasing demand for specialized cleaning services for commercial and industrial applications, such as healthcare facilities and manufacturing plants. The rise of eco-conscious consumers presents opportunities for businesses offering sustainable and biodegradable cleaning products. Expansion into underserved rural areas and leveraging digital marketing channels offer further avenues for growth.
Growth Accelerators in the Cleaning Industry in South Africa Industry
Strategic partnerships between cleaning product manufacturers and service providers can unlock significant growth potential. Investments in research and development to create innovative and sustainable cleaning solutions are crucial. Expansion into new geographical markets within South Africa and leveraging e-commerce platforms to reach a broader consumer base are also key growth catalysts.
Key Players Shaping the Cleaning Industry in South Africa Market
- Tevo (Pty) Ltd
- Dyson James Ltd
- Nilfisk Group
- BWGL Group (Pty) Ltd
- Cleaning Equipment Manufacturing SA Pty Ltd
- Chemstrat
- Robert Bosch GmbH
- Alfred Karcher SE & Co KG
- Miele & Cie KG
- Nu-World Holdings Ltd
Notable Milestones in Cleaning Industry in South Africa Sector
- July 2021: Samsung launched its Samsung Jet cordless stick vacuum cleaner with an all-new clean station.
- October 2021: Unilever SA launched Sunlight dishwashing liquid using captured carbon emissions.
- November 2021: BWGL Group (Pty) Ltd launched a new range of eco-friendly cleaning products under the Lioness brand.
In-Depth Cleaning Industry in South Africa Market Outlook
The South African cleaning industry is poised for continued growth, driven by favorable demographic trends, rising consumer awareness, and technological advancements. Opportunities exist in the development of sustainable and technologically advanced cleaning solutions. Strategic investments in innovation, marketing, and distribution will be crucial for businesses to succeed in this dynamic and competitive market. The projected market size in 2033 is estimated at xx million, demonstrating significant long-term growth potential.
Cleaning Industry in South Africa Segmentation
-
1. Product Type
-
1.1. Cleaning Equipment
- 1.1.1. Vaccum Cleaners
- 1.1.2. Steam Cleaners
- 1.1.3. High-Pressure Cleaners
- 1.1.4. Scrubbers/Polishers
- 1.1.5. Other Cleaning Equipement
- 1.2. Consumables
- 1.3. Chemicals, Powders and Gels
-
1.1. Cleaning Equipment
-
2. End User
- 2.1. Residential
- 2.2. Commercial/Industrial
-
3. Distribution Channel
- 3.1. Offline Channel
- 3.2. Online Channel
Cleaning Industry in South Africa Segmentation By Geography
-
1. North America
- 1.1. United States
- 1.2. Canada
- 1.3. Mexico
-
2. South America
- 2.1. Brazil
- 2.2. Argentina
- 2.3. Rest of South America
-
3. Europe
- 3.1. United Kingdom
- 3.2. Germany
- 3.3. France
- 3.4. Italy
- 3.5. Spain
- 3.6. Russia
- 3.7. Benelux
- 3.8. Nordics
- 3.9. Rest of Europe
-
4. Middle East & Africa
- 4.1. Turkey
- 4.2. Israel
- 4.3. GCC
- 4.4. North Africa
- 4.5. South Africa
- 4.6. Rest of Middle East & Africa
-
5. Asia Pacific
- 5.1. China
- 5.2. India
- 5.3. Japan
- 5.4. South Korea
- 5.5. ASEAN
- 5.6. Oceania
- 5.7. Rest of Asia Pacific
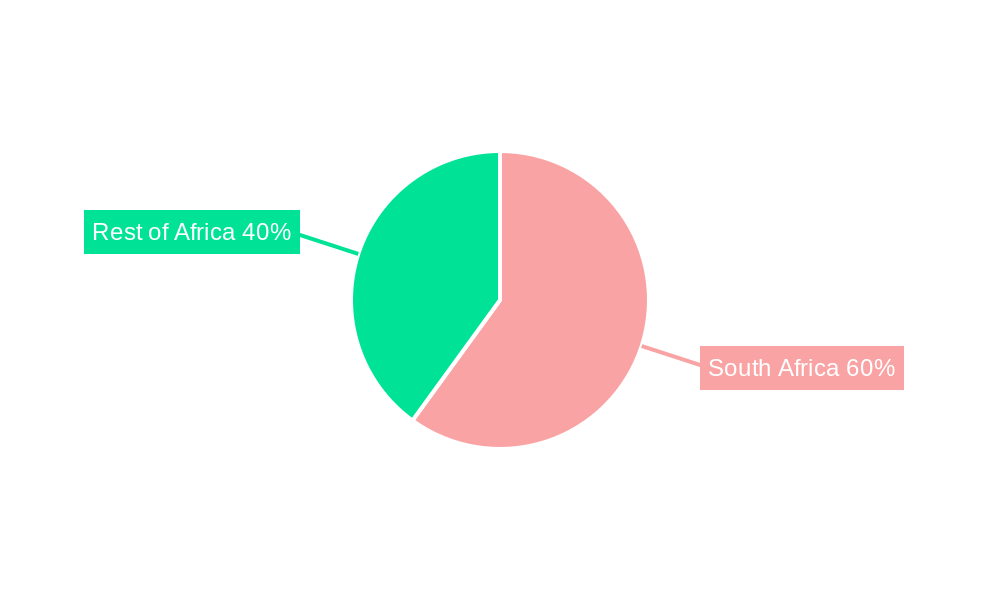
Cleaning Industry in South Africa Regional Market Share
Geographic Coverage of Cleaning Industry in South Africa
Cleaning Industry in South Africa REPORT HIGHLIGHTS
| Aspects | Details |
|---|---|
| Study Period | 2020-2034 |
| Base Year | 2025 |
| Estimated Year | 2026 |
| Forecast Period | 2026-2034 |
| Historical Period | 2020-2025 |
| Growth Rate | CAGR of 4.38% from 2020-2034 |
| Segmentation |
|
Table of Contents
- 1. Introduction
- 1.1. Research Scope
- 1.2. Market Segmentation
- 1.3. Research Objective
- 1.4. Definitions and Assumptions
- 2. Executive Summary
- 2.1. Market Snapshot
- 3. Market Dynamics
- 3.1. Market Drivers
- 3.2. Market Restrains
- 3.3. Market Trends
- 3.4. Market Opportunities
- 4. Market Factor Analysis
- 4.1. Porters Five Forces
- 4.1.1. Bargaining Power of Suppliers
- 4.1.2. Bargaining Power of Buyers
- 4.1.3. Threat of New Entrants
- 4.1.4. Threat of Substitutes
- 4.1.5. Competitive Rivalry
- 4.2. PESTEL analysis
- 4.3. BCG Analysis
- 4.3.1. Stars (High Growth, High Market Share)
- 4.3.2. Cash Cows (Low Growth, High Market Share)
- 4.3.3. Question Mark (High Growth, Low Market Share)
- 4.3.4. Dogs (Low Growth, Low Market Share)
- 4.4. Ansoff Matrix Analysis
- 4.5. Supply Chain Analysis
- 4.6. Regulatory Landscape
- 4.7. Current Market Potential and Opportunity Assessment (TAM–SAM–SOM Framework)
- 4.8. NRP Analyst Note
- 4.1. Porters Five Forces
- 5. Market Analysis, Insights and Forecast 2021-2033
- 5.1. Market Analysis, Insights and Forecast - by Product Type
- 5.1.1. Cleaning Equipment
- 5.1.1.1. Vaccum Cleaners
- 5.1.1.2. Steam Cleaners
- 5.1.1.3. High-Pressure Cleaners
- 5.1.1.4. Scrubbers/Polishers
- 5.1.1.5. Other Cleaning Equipement
- 5.1.2. Consumables
- 5.1.3. Chemicals, Powders and Gels
- 5.1.1. Cleaning Equipment
- 5.2. Market Analysis, Insights and Forecast - by End User
- 5.2.1. Residential
- 5.2.2. Commercial/Industrial
- 5.3. Market Analysis, Insights and Forecast - by Distribution Channel
- 5.3.1. Offline Channel
- 5.3.2. Online Channel
- 5.4. Market Analysis, Insights and Forecast - by Region
- 5.4.1. North America
- 5.4.2. South America
- 5.4.3. Europe
- 5.4.4. Middle East & Africa
- 5.4.5. Asia Pacific
- 5.1. Market Analysis, Insights and Forecast - by Product Type
- 6. Global Cleaning Industry in South Africa Analysis, Insights and Forecast, 2021-2033
- 6.1. Market Analysis, Insights and Forecast - by Product Type
- 6.1.1. Cleaning Equipment
- 6.1.1.1. Vaccum Cleaners
- 6.1.1.2. Steam Cleaners
- 6.1.1.3. High-Pressure Cleaners
- 6.1.1.4. Scrubbers/Polishers
- 6.1.1.5. Other Cleaning Equipement
- 6.1.2. Consumables
- 6.1.3. Chemicals, Powders and Gels
- 6.1.1. Cleaning Equipment
- 6.2. Market Analysis, Insights and Forecast - by End User
- 6.2.1. Residential
- 6.2.2. Commercial/Industrial
- 6.3. Market Analysis, Insights and Forecast - by Distribution Channel
- 6.3.1. Offline Channel
- 6.3.2. Online Channel
- 6.1. Market Analysis, Insights and Forecast - by Product Type
- 7. North America Cleaning Industry in South Africa Analysis, Insights and Forecast, 2020-2032
- 7.1. Market Analysis, Insights and Forecast - by Product Type
- 7.1.1. Cleaning Equipment
- 7.1.1.1. Vaccum Cleaners
- 7.1.1.2. Steam Cleaners
- 7.1.1.3. High-Pressure Cleaners
- 7.1.1.4. Scrubbers/Polishers
- 7.1.1.5. Other Cleaning Equipement
- 7.1.2. Consumables
- 7.1.3. Chemicals, Powders and Gels
- 7.1.1. Cleaning Equipment
- 7.2. Market Analysis, Insights and Forecast - by End User
- 7.2.1. Residential
- 7.2.2. Commercial/Industrial
- 7.3. Market Analysis, Insights and Forecast - by Distribution Channel
- 7.3.1. Offline Channel
- 7.3.2. Online Channel
- 7.1. Market Analysis, Insights and Forecast - by Product Type
- 8. South America Cleaning Industry in South Africa Analysis, Insights and Forecast, 2020-2032
- 8.1. Market Analysis, Insights and Forecast - by Product Type
- 8.1.1. Cleaning Equipment
- 8.1.1.1. Vaccum Cleaners
- 8.1.1.2. Steam Cleaners
- 8.1.1.3. High-Pressure Cleaners
- 8.1.1.4. Scrubbers/Polishers
- 8.1.1.5. Other Cleaning Equipement
- 8.1.2. Consumables
- 8.1.3. Chemicals, Powders and Gels
- 8.1.1. Cleaning Equipment
- 8.2. Market Analysis, Insights and Forecast - by End User
- 8.2.1. Residential
- 8.2.2. Commercial/Industrial
- 8.3. Market Analysis, Insights and Forecast - by Distribution Channel
- 8.3.1. Offline Channel
- 8.3.2. Online Channel
- 8.1. Market Analysis, Insights and Forecast - by Product Type
- 9. Europe Cleaning Industry in South Africa Analysis, Insights and Forecast, 2020-2032
- 9.1. Market Analysis, Insights and Forecast - by Product Type
- 9.1.1. Cleaning Equipment
- 9.1.1.1. Vaccum Cleaners
- 9.1.1.2. Steam Cleaners
- 9.1.1.3. High-Pressure Cleaners
- 9.1.1.4. Scrubbers/Polishers
- 9.1.1.5. Other Cleaning Equipement
- 9.1.2. Consumables
- 9.1.3. Chemicals, Powders and Gels
- 9.1.1. Cleaning Equipment
- 9.2. Market Analysis, Insights and Forecast - by End User
- 9.2.1. Residential
- 9.2.2. Commercial/Industrial
- 9.3. Market Analysis, Insights and Forecast - by Distribution Channel
- 9.3.1. Offline Channel
- 9.3.2. Online Channel
- 9.1. Market Analysis, Insights and Forecast - by Product Type
- 10. Middle East & Africa Cleaning Industry in South Africa Analysis, Insights and Forecast, 2020-2032
- 10.1. Market Analysis, Insights and Forecast - by Product Type
- 10.1.1. Cleaning Equipment
- 10.1.1.1. Vaccum Cleaners
- 10.1.1.2. Steam Cleaners
- 10.1.1.3. High-Pressure Cleaners
- 10.1.1.4. Scrubbers/Polishers
- 10.1.1.5. Other Cleaning Equipement
- 10.1.2. Consumables
- 10.1.3. Chemicals, Powders and Gels
- 10.1.1. Cleaning Equipment
- 10.2. Market Analysis, Insights and Forecast - by End User
- 10.2.1. Residential
- 10.2.2. Commercial/Industrial
- 10.3. Market Analysis, Insights and Forecast - by Distribution Channel
- 10.3.1. Offline Channel
- 10.3.2. Online Channel
- 10.1. Market Analysis, Insights and Forecast - by Product Type
- 11. Asia Pacific Cleaning Industry in South Africa Analysis, Insights and Forecast, 2020-2032
- 11.1. Market Analysis, Insights and Forecast - by Product Type
- 11.1.1. Cleaning Equipment
- 11.1.1.1. Vaccum Cleaners
- 11.1.1.2. Steam Cleaners
- 11.1.1.3. High-Pressure Cleaners
- 11.1.1.4. Scrubbers/Polishers
- 11.1.1.5. Other Cleaning Equipement
- 11.1.2. Consumables
- 11.1.3. Chemicals, Powders and Gels
- 11.1.1. Cleaning Equipment
- 11.2. Market Analysis, Insights and Forecast - by End User
- 11.2.1. Residential
- 11.2.2. Commercial/Industrial
- 11.3. Market Analysis, Insights and Forecast - by Distribution Channel
- 11.3.1. Offline Channel
- 11.3.2. Online Channel
- 11.1. Market Analysis, Insights and Forecast - by Product Type
- 12. Competitive Analysis
- 12.1. Company Profiles
- 12.1.1 Tevo (Pty) Ltd
- 12.1.1.1. Company Overview
- 12.1.1.2. Products
- 12.1.1.3. Company Financials
- 12.1.1.4. SWOT Analysis
- 12.1.2 Dyson James Ltd
- 12.1.2.1. Company Overview
- 12.1.2.2. Products
- 12.1.2.3. Company Financials
- 12.1.2.4. SWOT Analysis
- 12.1.3 Nilfisk Group
- 12.1.3.1. Company Overview
- 12.1.3.2. Products
- 12.1.3.3. Company Financials
- 12.1.3.4. SWOT Analysis
- 12.1.4 BWGL Group (Pty) Ltd
- 12.1.4.1. Company Overview
- 12.1.4.2. Products
- 12.1.4.3. Company Financials
- 12.1.4.4. SWOT Analysis
- 12.1.5 Cleaning Equipment Manufacturing SA Pty Ltd*List Not Exhaustive
- 12.1.5.1. Company Overview
- 12.1.5.2. Products
- 12.1.5.3. Company Financials
- 12.1.5.4. SWOT Analysis
- 12.1.6 Chemstrat
- 12.1.6.1. Company Overview
- 12.1.6.2. Products
- 12.1.6.3. Company Financials
- 12.1.6.4. SWOT Analysis
- 12.1.7 Robert Bosch GmbH
- 12.1.7.1. Company Overview
- 12.1.7.2. Products
- 12.1.7.3. Company Financials
- 12.1.7.4. SWOT Analysis
- 12.1.8 Alfred Karcher SE & Co KG
- 12.1.8.1. Company Overview
- 12.1.8.2. Products
- 12.1.8.3. Company Financials
- 12.1.8.4. SWOT Analysis
- 12.1.9 Miele & Cie KG
- 12.1.9.1. Company Overview
- 12.1.9.2. Products
- 12.1.9.3. Company Financials
- 12.1.9.4. SWOT Analysis
- 12.1.10 Nu-World Holdings Ltd
- 12.1.10.1. Company Overview
- 12.1.10.2. Products
- 12.1.10.3. Company Financials
- 12.1.10.4. SWOT Analysis
- 12.1.1 Tevo (Pty) Ltd
- 12.2. Market Entropy
- 12.2.1 Company's Key Areas Served
- 12.2.2 Recent Developments
- 12.3. Company Market Share Analysis 2025
- 12.3.1 Top 5 Companies Market Share Analysis
- 12.3.2 Top 3 Companies Market Share Analysis
- 12.4. List of Potential Customers
- 13. Research Methodology
List of Figures
- Figure 1: Global Cleaning Industry in South Africa Revenue Breakdown (Million, %) by Region 2025 & 2033
- Figure 2: North America Cleaning Industry in South Africa Revenue (Million), by Product Type 2025 & 2033
- Figure 3: North America Cleaning Industry in South Africa Revenue Share (%), by Product Type 2025 & 2033
- Figure 4: North America Cleaning Industry in South Africa Revenue (Million), by End User 2025 & 2033
- Figure 5: North America Cleaning Industry in South Africa Revenue Share (%), by End User 2025 & 2033
- Figure 6: North America Cleaning Industry in South Africa Revenue (Million), by Distribution Channel 2025 & 2033
- Figure 7: North America Cleaning Industry in South Africa Revenue Share (%), by Distribution Channel 2025 & 2033
- Figure 8: North America Cleaning Industry in South Africa Revenue (Million), by Country 2025 & 2033
- Figure 9: North America Cleaning Industry in South Africa Revenue Share (%), by Country 2025 & 2033
- Figure 10: South America Cleaning Industry in South Africa Revenue (Million), by Product Type 2025 & 2033
- Figure 11: South America Cleaning Industry in South Africa Revenue Share (%), by Product Type 2025 & 2033
- Figure 12: South America Cleaning Industry in South Africa Revenue (Million), by End User 2025 & 2033
- Figure 13: South America Cleaning Industry in South Africa Revenue Share (%), by End User 2025 & 2033
- Figure 14: South America Cleaning Industry in South Africa Revenue (Million), by Distribution Channel 2025 & 2033
- Figure 15: South America Cleaning Industry in South Africa Revenue Share (%), by Distribution Channel 2025 & 2033
- Figure 16: South America Cleaning Industry in South Africa Revenue (Million), by Country 2025 & 2033
- Figure 17: South America Cleaning Industry in South Africa Revenue Share (%), by Country 2025 & 2033
- Figure 18: Europe Cleaning Industry in South Africa Revenue (Million), by Product Type 2025 & 2033
- Figure 19: Europe Cleaning Industry in South Africa Revenue Share (%), by Product Type 2025 & 2033
- Figure 20: Europe Cleaning Industry in South Africa Revenue (Million), by End User 2025 & 2033
- Figure 21: Europe Cleaning Industry in South Africa Revenue Share (%), by End User 2025 & 2033
- Figure 22: Europe Cleaning Industry in South Africa Revenue (Million), by Distribution Channel 2025 & 2033
- Figure 23: Europe Cleaning Industry in South Africa Revenue Share (%), by Distribution Channel 2025 & 2033
- Figure 24: Europe Cleaning Industry in South Africa Revenue (Million), by Country 2025 & 2033
- Figure 25: Europe Cleaning Industry in South Africa Revenue Share (%), by Country 2025 & 2033
- Figure 26: Middle East & Africa Cleaning Industry in South Africa Revenue (Million), by Product Type 2025 & 2033
- Figure 27: Middle East & Africa Cleaning Industry in South Africa Revenue Share (%), by Product Type 2025 & 2033
- Figure 28: Middle East & Africa Cleaning Industry in South Africa Revenue (Million), by End User 2025 & 2033
- Figure 29: Middle East & Africa Cleaning Industry in South Africa Revenue Share (%), by End User 2025 & 2033
- Figure 30: Middle East & Africa Cleaning Industry in South Africa Revenue (Million), by Distribution Channel 2025 & 2033
- Figure 31: Middle East & Africa Cleaning Industry in South Africa Revenue Share (%), by Distribution Channel 2025 & 2033
- Figure 32: Middle East & Africa Cleaning Industry in South Africa Revenue (Million), by Country 2025 & 2033
- Figure 33: Middle East & Africa Cleaning Industry in South Africa Revenue Share (%), by Country 2025 & 2033
- Figure 34: Asia Pacific Cleaning Industry in South Africa Revenue (Million), by Product Type 2025 & 2033
- Figure 35: Asia Pacific Cleaning Industry in South Africa Revenue Share (%), by Product Type 2025 & 2033
- Figure 36: Asia Pacific Cleaning Industry in South Africa Revenue (Million), by End User 2025 & 2033
- Figure 37: Asia Pacific Cleaning Industry in South Africa Revenue Share (%), by End User 2025 & 2033
- Figure 38: Asia Pacific Cleaning Industry in South Africa Revenue (Million), by Distribution Channel 2025 & 2033
- Figure 39: Asia Pacific Cleaning Industry in South Africa Revenue Share (%), by Distribution Channel 2025 & 2033
- Figure 40: Asia Pacific Cleaning Industry in South Africa Revenue (Million), by Country 2025 & 2033
- Figure 41: Asia Pacific Cleaning Industry in South Africa Revenue Share (%), by Country 2025 & 2033
List of Tables
- Table 1: Global Cleaning Industry in South Africa Revenue Million Forecast, by Product Type 2020 & 2033
- Table 2: Global Cleaning Industry in South Africa Revenue Million Forecast, by End User 2020 & 2033
- Table 3: Global Cleaning Industry in South Africa Revenue Million Forecast, by Distribution Channel 2020 & 2033
- Table 4: Global Cleaning Industry in South Africa Revenue Million Forecast, by Region 2020 & 2033
- Table 5: Global Cleaning Industry in South Africa Revenue Million Forecast, by Product Type 2020 & 2033
- Table 6: Global Cleaning Industry in South Africa Revenue Million Forecast, by End User 2020 & 2033
- Table 7: Global Cleaning Industry in South Africa Revenue Million Forecast, by Distribution Channel 2020 & 2033
- Table 8: Global Cleaning Industry in South Africa Revenue Million Forecast, by Country 2020 & 2033
- Table 9: United States Cleaning Industry in South Africa Revenue (Million) Forecast, by Application 2020 & 2033
- Table 10: Canada Cleaning Industry in South Africa Revenue (Million) Forecast, by Application 2020 & 2033
- Table 11: Mexico Cleaning Industry in South Africa Revenue (Million) Forecast, by Application 2020 & 2033
- Table 12: Global Cleaning Industry in South Africa Revenue Million Forecast, by Product Type 2020 & 2033
- Table 13: Global Cleaning Industry in South Africa Revenue Million Forecast, by End User 2020 & 2033
- Table 14: Global Cleaning Industry in South Africa Revenue Million Forecast, by Distribution Channel 2020 & 2033
- Table 15: Global Cleaning Industry in South Africa Revenue Million Forecast, by Country 2020 & 2033
- Table 16: Brazil Cleaning Industry in South Africa Revenue (Million) Forecast, by Application 2020 & 2033
- Table 17: Argentina Cleaning Industry in South Africa Revenue (Million) Forecast, by Application 2020 & 2033
- Table 18: Rest of South America Cleaning Industry in South Africa Revenue (Million) Forecast, by Application 2020 & 2033
- Table 19: Global Cleaning Industry in South Africa Revenue Million Forecast, by Product Type 2020 & 2033
- Table 20: Global Cleaning Industry in South Africa Revenue Million Forecast, by End User 2020 & 2033
- Table 21: Global Cleaning Industry in South Africa Revenue Million Forecast, by Distribution Channel 2020 & 2033
- Table 22: Global Cleaning Industry in South Africa Revenue Million Forecast, by Country 2020 & 2033
- Table 23: United Kingdom Cleaning Industry in South Africa Revenue (Million) Forecast, by Application 2020 & 2033
- Table 24: Germany Cleaning Industry in South Africa Revenue (Million) Forecast, by Application 2020 & 2033
- Table 25: France Cleaning Industry in South Africa Revenue (Million) Forecast, by Application 2020 & 2033
- Table 26: Italy Cleaning Industry in South Africa Revenue (Million) Forecast, by Application 2020 & 2033
- Table 27: Spain Cleaning Industry in South Africa Revenue (Million) Forecast, by Application 2020 & 2033
- Table 28: Russia Cleaning Industry in South Africa Revenue (Million) Forecast, by Application 2020 & 2033
- Table 29: Benelux Cleaning Industry in South Africa Revenue (Million) Forecast, by Application 2020 & 2033
- Table 30: Nordics Cleaning Industry in South Africa Revenue (Million) Forecast, by Application 2020 & 2033
- Table 31: Rest of Europe Cleaning Industry in South Africa Revenue (Million) Forecast, by Application 2020 & 2033
- Table 32: Global Cleaning Industry in South Africa Revenue Million Forecast, by Product Type 2020 & 2033
- Table 33: Global Cleaning Industry in South Africa Revenue Million Forecast, by End User 2020 & 2033
- Table 34: Global Cleaning Industry in South Africa Revenue Million Forecast, by Distribution Channel 2020 & 2033
- Table 35: Global Cleaning Industry in South Africa Revenue Million Forecast, by Country 2020 & 2033
- Table 36: Turkey Cleaning Industry in South Africa Revenue (Million) Forecast, by Application 2020 & 2033
- Table 37: Israel Cleaning Industry in South Africa Revenue (Million) Forecast, by Application 2020 & 2033
- Table 38: GCC Cleaning Industry in South Africa Revenue (Million) Forecast, by Application 2020 & 2033
- Table 39: North Africa Cleaning Industry in South Africa Revenue (Million) Forecast, by Application 2020 & 2033
- Table 40: South Africa Cleaning Industry in South Africa Revenue (Million) Forecast, by Application 2020 & 2033
- Table 41: Rest of Middle East & Africa Cleaning Industry in South Africa Revenue (Million) Forecast, by Application 2020 & 2033
- Table 42: Global Cleaning Industry in South Africa Revenue Million Forecast, by Product Type 2020 & 2033
- Table 43: Global Cleaning Industry in South Africa Revenue Million Forecast, by End User 2020 & 2033
- Table 44: Global Cleaning Industry in South Africa Revenue Million Forecast, by Distribution Channel 2020 & 2033
- Table 45: Global Cleaning Industry in South Africa Revenue Million Forecast, by Country 2020 & 2033
- Table 46: China Cleaning Industry in South Africa Revenue (Million) Forecast, by Application 2020 & 2033
- Table 47: India Cleaning Industry in South Africa Revenue (Million) Forecast, by Application 2020 & 2033
- Table 48: Japan Cleaning Industry in South Africa Revenue (Million) Forecast, by Application 2020 & 2033
- Table 49: South Korea Cleaning Industry in South Africa Revenue (Million) Forecast, by Application 2020 & 2033
- Table 50: ASEAN Cleaning Industry in South Africa Revenue (Million) Forecast, by Application 2020 & 2033
- Table 51: Oceania Cleaning Industry in South Africa Revenue (Million) Forecast, by Application 2020 & 2033
- Table 52: Rest of Asia Pacific Cleaning Industry in South Africa Revenue (Million) Forecast, by Application 2020 & 2033
Frequently Asked Questions
1. What is the projected Compound Annual Growth Rate (CAGR) of the Cleaning Industry in South Africa?
The projected CAGR is approximately 4.38%.
2. Which companies are prominent players in the Cleaning Industry in South Africa?
Key companies in the market include Tevo (Pty) Ltd, Dyson James Ltd, Nilfisk Group, BWGL Group (Pty) Ltd, Cleaning Equipment Manufacturing SA Pty Ltd*List Not Exhaustive, Chemstrat, Robert Bosch GmbH, Alfred Karcher SE & Co KG, Miele & Cie KG, Nu-World Holdings Ltd.
3. What are the main segments of the Cleaning Industry in South Africa?
The market segments include Product Type, End User, Distribution Channel.
4. Can you provide details about the market size?
The market size is estimated to be USD 0.92 Million as of 2022.
5. What are some drivers contributing to market growth?
Rising Diabetic Population Across the Globe; Innovative and Fashionable Footwear.
6. What are the notable trends driving market growth?
Growing Penetration of Cleaning Products in Households.
7. Are there any restraints impacting market growth?
Enhanced Presence of Counterfeit and Poor-Quality Products.
8. Can you provide examples of recent developments in the market?
November 2021: South Africa's BWGL Group (Pty) Ltd, Lioness, launched a new range of natural and environmentally friendly cleaning products.
9. What pricing options are available for accessing the report?
Pricing options include single-user, multi-user, and enterprise licenses priced at USD 3800, USD 4500, and USD 5800 respectively.
10. Is the market size provided in terms of value or volume?
The market size is provided in terms of value, measured in Million.
11. Are there any specific market keywords associated with the report?
Yes, the market keyword associated with the report is "Cleaning Industry in South Africa," which aids in identifying and referencing the specific market segment covered.
12. How do I determine which pricing option suits my needs best?
The pricing options vary based on user requirements and access needs. Individual users may opt for single-user licenses, while businesses requiring broader access may choose multi-user or enterprise licenses for cost-effective access to the report.
13. Are there any additional resources or data provided in the Cleaning Industry in South Africa report?
While the report offers comprehensive insights, it's advisable to review the specific contents or supplementary materials provided to ascertain if additional resources or data are available.
14. How can I stay updated on further developments or reports in the Cleaning Industry in South Africa?
To stay informed about further developments, trends, and reports in the Cleaning Industry in South Africa, consider subscribing to industry newsletters, following relevant companies and organizations, or regularly checking reputable industry news sources and publications.
Methodology
Step 1 - Identification of Relevant Samples Size from Population Database


Step 2 - Approaches for Defining Global Market Size (Value, Volume* & Price*)

Note*: In applicable scenarios
Step 3 - Data Sources
Primary Research
- Web Analytics
- Survey Reports
- Research Institute
- Latest Research Reports
- Opinion Leaders
Secondary Research
- Annual Reports
- White Paper
- Latest Press Release
- Industry Association
- Paid Database
- Investor Presentations

Step 4 - Data Triangulation
Involves using different sources of information in order to increase the validity of a study
These sources are likely to be stakeholders in a program - participants, other researchers, program staff, other community members, and so on.
Then we put all data in single framework & apply various statistical tools to find out the dynamic on the market.
During the analysis stage, feedback from the stakeholder groups would be compared to determine areas of agreement as well as areas of divergence