

Key Insights
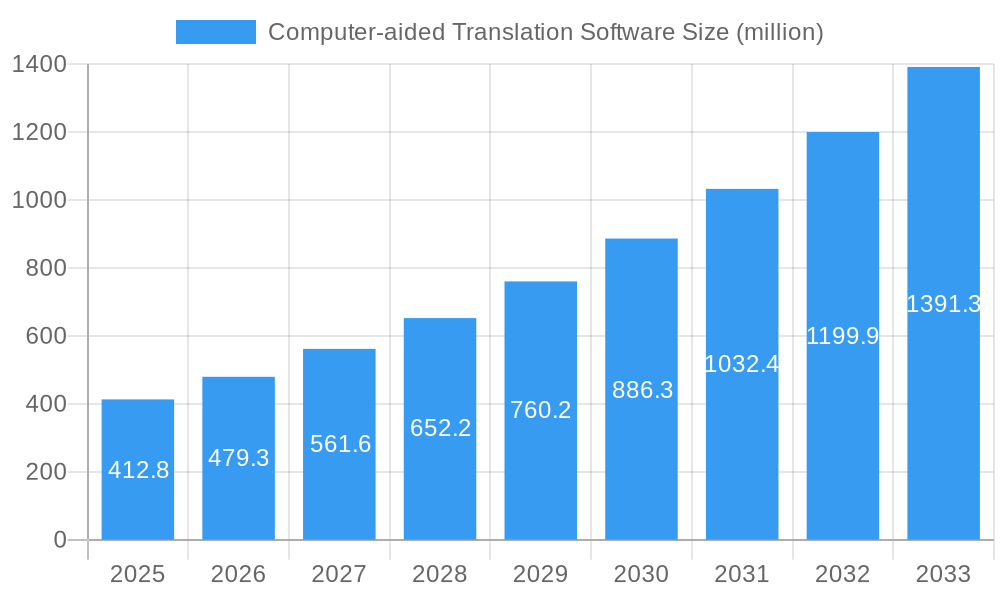
The Computer-aided Translation (CAT) software market is experiencing robust growth, projected to reach $412.8 million in 2025 and exhibiting a Compound Annual Growth Rate (CAGR) of 16.5% from 2025 to 2033. This expansion is fueled by several key factors. The increasing globalization of businesses necessitates efficient and accurate translation of diverse content, driving demand for CAT tools that streamline the translation process and reduce costs. Furthermore, advancements in Artificial Intelligence (AI) and Machine Learning (ML) are integrating seamlessly into CAT software, enhancing translation quality, speed, and consistency. This integration offers features such as automated translation suggestions, terminology management, and quality assurance checks, making the software increasingly indispensable for businesses operating internationally. The rising adoption of cloud-based CAT tools also contributes to market growth, offering scalability, accessibility, and collaboration features that benefit both small and large translation agencies and enterprises. Competitive pressures are stimulating innovation within the industry, leading to the development of more sophisticated and user-friendly software solutions. While data limitations prevent precise regional breakdowns, it's reasonable to assume that regions with significant global business activity, such as North America and Europe, will hold substantial market shares.
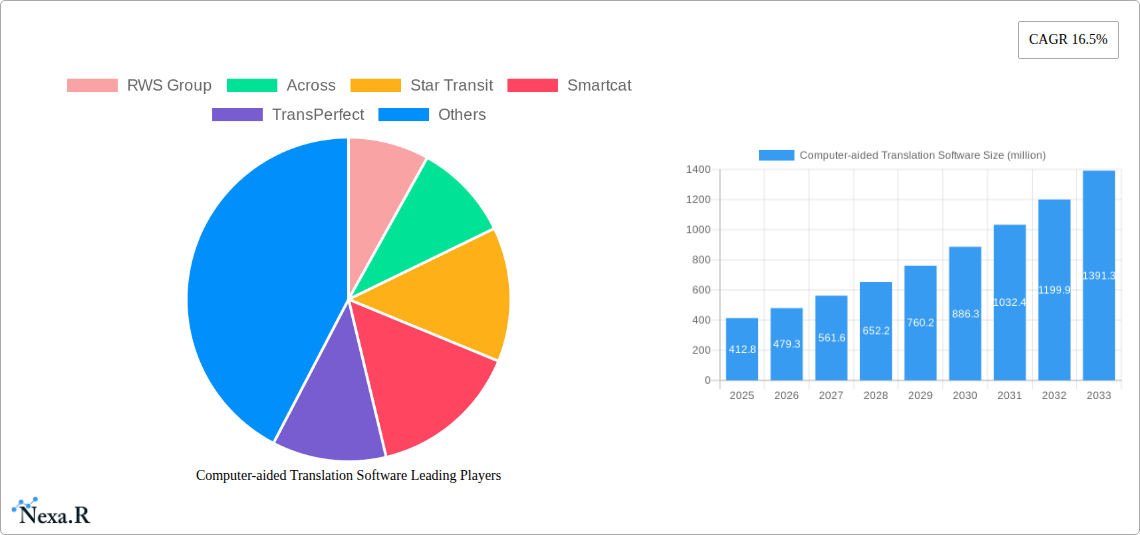
Computer-aided Translation Software Market Size (In Million)
The market's growth trajectory is expected to continue throughout the forecast period (2025-2033), driven by ongoing technological advancements, increased global trade, and the rising demand for multilingual content across various industries. Key players like RWS Group, SDL, and others are investing significantly in research and development, further enhancing the capabilities and functionalities of their CAT software offerings. The competitive landscape is characterized by a mix of established players and emerging startups, fostering innovation and providing diverse choices for users. While challenges such as data security concerns and the need for skilled professionals to effectively utilize these tools remain, the overall market outlook for CAT software is undeniably positive, indicating sustained expansion in the coming years.
Computer-aided Translation Software Company Market Share
Computer-aided Translation Software Market Report: 2019-2033
This comprehensive report provides an in-depth analysis of the Computer-aided Translation (CAT) software market, encompassing market dynamics, growth trends, regional analysis, competitive landscape, and future outlook. The study period covers 2019-2033, with 2025 as the base and estimated year. The forecast period is 2025-2033, and the historical period is 2019-2024. This report is invaluable for industry professionals, investors, and anyone seeking a detailed understanding of this rapidly evolving market. The total market size in 2025 is estimated at $xx million.
Computer-aided Translation Software Market Dynamics & Structure
The CAT software market is characterized by moderate concentration, with key players holding significant market share. Technological innovation, particularly in areas like Neural Machine Translation (NMT) and AI-powered features, is a major driver. Regulatory frameworks concerning data privacy and security increasingly influence market practices. The market witnesses continuous development of competitive product substitutes, pushing companies to innovate. The end-user demographic is expanding to include diverse industries and freelancers, influencing market demand. M&A activity remains a prominent feature, reflecting consolidation and expansion strategies.
- Market Concentration: The top 5 players hold approximately xx% of the market share in 2025.
- Technological Innovation: NMT adoption is driving growth, but integration challenges and data quality concerns remain.
- Regulatory Frameworks: GDPR and similar regulations impact data handling and security, shaping vendor strategies.
- Competitive Substitutes: General-purpose translation tools and human translation services present competitive pressures.
- End-User Demographics: Growth is driven by increasing demand from diverse sectors, including technology, healthcare, and finance.
- M&A Trends: An estimated xx M&A deals occurred within the market during 2019-2024, indicating consolidation trends.
Computer-aided Translation Software Growth Trends & Insights
The CAT software market has experienced steady growth, with a Compound Annual Growth Rate (CAGR) of xx% during the historical period (2019-2024). Market size is projected to reach $xx million by 2033, driven by increasing globalization, demand for multilingual content, and advancements in AI-powered translation technologies. Adoption rates are rising across various industries, with larger enterprises leading the trend. Technological disruptions, especially the rise of NMT, are reshaping market dynamics, prompting a shift towards cloud-based solutions and subscription models. Consumer behavior reveals a preference for user-friendly interfaces and seamless integration with other business tools. Market penetration is expected to reach xx% by 2033.
Dominant Regions, Countries, or Segments in Computer-aided Translation Software
North America currently holds the largest market share, driven by robust technological infrastructure, high adoption rates, and significant presence of key players. Europe follows as a major market, while Asia-Pacific shows significant growth potential. The key drivers vary regionally. North America's growth is fuelled by technological advancements and a well-established IT sector. Europe benefits from a multilingual environment and strong regulatory frameworks. Asia-Pacific's growth is driven by increasing digitization and rising demand for multilingual content in emerging economies.
- North America: High adoption rates, strong technological infrastructure, and significant presence of key players.
- Europe: Multilingual environment, robust regulatory landscape, and high demand for translation services.
- Asia-Pacific: Rapid digitization, increasing demand for multilingual content in emerging economies, and cost-effective labor.
Computer-aided Translation Software Product Landscape
CAT software solutions range from basic translation memory (TM) systems to sophisticated platforms incorporating NMT, terminology management, and quality assurance features. Products are differentiated by their user interfaces, integration capabilities, and specialized functionalities catering to various industry needs. Key innovations focus on improving translation accuracy, speed, and efficiency, while emphasizing user experience and seamless workflows.
Key Drivers, Barriers & Challenges in Computer-aided Translation Software
Key Drivers:
- Increasing globalization and the demand for multilingual content across industries.
- Advancements in NMT and AI technologies, improving translation accuracy and speed.
- Growing adoption of cloud-based solutions and subscription models.
- Increasing demand for translation services from businesses of all sizes.
Key Barriers & Challenges:
- Data security and privacy concerns, particularly with sensitive information.
- The need for high-quality training data for NMT systems.
- Integration complexities with existing workflows and systems.
- Price sensitivity and budget constraints, particularly among smaller businesses. The cost of implementing and maintaining CAT tools can be a significant barrier for some companies, leading to a xx% reduction in adoption in some segments.
Emerging Opportunities in Computer-aided Translation Software
- Growing demand for specialized translation solutions for specific industries (e.g., legal, medical).
- Expansion into untapped markets in developing economies.
- Integration of CAT software with other business tools and platforms.
- Development of new features leveraging AI and machine learning.
Growth Accelerators in the Computer-aided Translation Software Industry
Long-term growth will be fueled by continuous technological advancements, such as improved NMT algorithms and enhanced AI features. Strategic partnerships between CAT software providers and language service providers will expand market reach and adoption. Market expansion into new geographic regions, particularly developing economies, will also contribute significantly to future growth.
Key Players Shaping the Computer-aided Translation Software Market
- RWS Group
- Across
- Star Transit
- Smartcat
- TransPerfect
- Lionbridge
- LanguageWire
- XTM Cloud
- MemoQ
- Memsource
- Wordfast
- UEDRIVE
- Heartsome
- Déjà Vu
- Xueren CAT
Notable Milestones in Computer-aided Translation Software Sector
- 2020: Significant advancements in NMT technology lead to improved accuracy and fluency.
- 2021: Several key players launch cloud-based CAT solutions with enhanced collaboration features.
- 2022: Increased focus on integrating AI-powered features for improved quality assurance.
- 2023: Several mergers and acquisitions consolidate market share among leading players.
- 2024: Launch of new CAT tools with improved user interfaces and enhanced functionalities.
In-Depth Computer-aided Translation Software Market Outlook
The future of the CAT software market is promising, driven by the continued growth of globalization, increasing demand for multilingual content, and ongoing advancements in AI-powered translation technology. Strategic partnerships, expansion into new markets, and continuous innovation will further fuel market growth, creating lucrative opportunities for both established players and new entrants. The market is poised for sustained growth, with significant potential for market expansion and innovation in the coming years.
Computer-aided Translation Software Segmentation
-
1. Application
- 1.1. Large Enterprises
- 1.2. Middle and Small-sized Enterprises
- 1.3. Others
-
2. Types
- 2.1. Subscription License
- 2.2. Perpetual License
Computer-aided Translation Software Segmentation By Geography
-
1. North America
- 1.1. United States
- 1.2. Canada
- 1.3. Mexico
-
2. South America
- 2.1. Brazil
- 2.2. Argentina
- 2.3. Rest of South America
-
3. Europe
- 3.1. United Kingdom
- 3.2. Germany
- 3.3. France
- 3.4. Italy
- 3.5. Spain
- 3.6. Russia
- 3.7. Benelux
- 3.8. Nordics
- 3.9. Rest of Europe
-
4. Middle East & Africa
- 4.1. Turkey
- 4.2. Israel
- 4.3. GCC
- 4.4. North Africa
- 4.5. South Africa
- 4.6. Rest of Middle East & Africa
-
5. Asia Pacific
- 5.1. China
- 5.2. India
- 5.3. Japan
- 5.4. South Korea
- 5.5. ASEAN
- 5.6. Oceania
- 5.7. Rest of Asia Pacific

Computer-aided Translation Software Regional Market Share
Geographic Coverage of Computer-aided Translation Software
Computer-aided Translation Software REPORT HIGHLIGHTS
| Aspects | Details |
|---|---|
| Study Period | 2020-2034 |
| Base Year | 2025 |
| Estimated Year | 2026 |
| Forecast Period | 2026-2034 |
| Historical Period | 2020-2025 |
| Growth Rate | CAGR of 16.5% from 2020-2034 |
| Segmentation |
|
Table of Contents
- 1. Introduction
- 1.1. Research Scope
- 1.2. Market Segmentation
- 1.3. Research Methodology
- 1.4. Definitions and Assumptions
- 2. Executive Summary
- 2.1. Introduction
- 3. Market Dynamics
- 3.1. Introduction
- 3.2. Market Drivers
- 3.3. Market Restrains
- 3.4. Market Trends
- 4. Market Factor Analysis
- 4.1. Porters Five Forces
- 4.2. Supply/Value Chain
- 4.3. PESTEL analysis
- 4.4. Market Entropy
- 4.5. Patent/Trademark Analysis
- 5. Global Computer-aided Translation Software Analysis, Insights and Forecast, 2020-2032
- 5.1. Market Analysis, Insights and Forecast - by Application
- 5.1.1. Large Enterprises
- 5.1.2. Middle and Small-sized Enterprises
- 5.1.3. Others
- 5.2. Market Analysis, Insights and Forecast - by Types
- 5.2.1. Subscription License
- 5.2.2. Perpetual License
- 5.3. Market Analysis, Insights and Forecast - by Region
- 5.3.1. North America
- 5.3.2. South America
- 5.3.3. Europe
- 5.3.4. Middle East & Africa
- 5.3.5. Asia Pacific
- 5.1. Market Analysis, Insights and Forecast - by Application
- 6. North America Computer-aided Translation Software Analysis, Insights and Forecast, 2020-2032
- 6.1. Market Analysis, Insights and Forecast - by Application
- 6.1.1. Large Enterprises
- 6.1.2. Middle and Small-sized Enterprises
- 6.1.3. Others
- 6.2. Market Analysis, Insights and Forecast - by Types
- 6.2.1. Subscription License
- 6.2.2. Perpetual License
- 6.1. Market Analysis, Insights and Forecast - by Application
- 7. South America Computer-aided Translation Software Analysis, Insights and Forecast, 2020-2032
- 7.1. Market Analysis, Insights and Forecast - by Application
- 7.1.1. Large Enterprises
- 7.1.2. Middle and Small-sized Enterprises
- 7.1.3. Others
- 7.2. Market Analysis, Insights and Forecast - by Types
- 7.2.1. Subscription License
- 7.2.2. Perpetual License
- 7.1. Market Analysis, Insights and Forecast - by Application
- 8. Europe Computer-aided Translation Software Analysis, Insights and Forecast, 2020-2032
- 8.1. Market Analysis, Insights and Forecast - by Application
- 8.1.1. Large Enterprises
- 8.1.2. Middle and Small-sized Enterprises
- 8.1.3. Others
- 8.2. Market Analysis, Insights and Forecast - by Types
- 8.2.1. Subscription License
- 8.2.2. Perpetual License
- 8.1. Market Analysis, Insights and Forecast - by Application
- 9. Middle East & Africa Computer-aided Translation Software Analysis, Insights and Forecast, 2020-2032
- 9.1. Market Analysis, Insights and Forecast - by Application
- 9.1.1. Large Enterprises
- 9.1.2. Middle and Small-sized Enterprises
- 9.1.3. Others
- 9.2. Market Analysis, Insights and Forecast - by Types
- 9.2.1. Subscription License
- 9.2.2. Perpetual License
- 9.1. Market Analysis, Insights and Forecast - by Application
- 10. Asia Pacific Computer-aided Translation Software Analysis, Insights and Forecast, 2020-2032
- 10.1. Market Analysis, Insights and Forecast - by Application
- 10.1.1. Large Enterprises
- 10.1.2. Middle and Small-sized Enterprises
- 10.1.3. Others
- 10.2. Market Analysis, Insights and Forecast - by Types
- 10.2.1. Subscription License
- 10.2.2. Perpetual License
- 10.1. Market Analysis, Insights and Forecast - by Application
- 11. Competitive Analysis
- 11.1. Global Market Share Analysis 2025
- 11.2. Company Profiles
- 11.2.1 RWS Group
- 11.2.1.1. Overview
- 11.2.1.2. Products
- 11.2.1.3. SWOT Analysis
- 11.2.1.4. Recent Developments
- 11.2.1.5. Financials (Based on Availability)
- 11.2.2 Across
- 11.2.2.1. Overview
- 11.2.2.2. Products
- 11.2.2.3. SWOT Analysis
- 11.2.2.4. Recent Developments
- 11.2.2.5. Financials (Based on Availability)
- 11.2.3 Star Transit
- 11.2.3.1. Overview
- 11.2.3.2. Products
- 11.2.3.3. SWOT Analysis
- 11.2.3.4. Recent Developments
- 11.2.3.5. Financials (Based on Availability)
- 11.2.4 Smartcat
- 11.2.4.1. Overview
- 11.2.4.2. Products
- 11.2.4.3. SWOT Analysis
- 11.2.4.4. Recent Developments
- 11.2.4.5. Financials (Based on Availability)
- 11.2.5 TransPerfect
- 11.2.5.1. Overview
- 11.2.5.2. Products
- 11.2.5.3. SWOT Analysis
- 11.2.5.4. Recent Developments
- 11.2.5.5. Financials (Based on Availability)
- 11.2.6 Lionbridge
- 11.2.6.1. Overview
- 11.2.6.2. Products
- 11.2.6.3. SWOT Analysis
- 11.2.6.4. Recent Developments
- 11.2.6.5. Financials (Based on Availability)
- 11.2.7 LanguageWire
- 11.2.7.1. Overview
- 11.2.7.2. Products
- 11.2.7.3. SWOT Analysis
- 11.2.7.4. Recent Developments
- 11.2.7.5. Financials (Based on Availability)
- 11.2.8 XTM Cloud
- 11.2.8.1. Overview
- 11.2.8.2. Products
- 11.2.8.3. SWOT Analysis
- 11.2.8.4. Recent Developments
- 11.2.8.5. Financials (Based on Availability)
- 11.2.9 MemoQ
- 11.2.9.1. Overview
- 11.2.9.2. Products
- 11.2.9.3. SWOT Analysis
- 11.2.9.4. Recent Developments
- 11.2.9.5. Financials (Based on Availability)
- 11.2.10 Memsource
- 11.2.10.1. Overview
- 11.2.10.2. Products
- 11.2.10.3. SWOT Analysis
- 11.2.10.4. Recent Developments
- 11.2.10.5. Financials (Based on Availability)
- 11.2.11 Wordfast
- 11.2.11.1. Overview
- 11.2.11.2. Products
- 11.2.11.3. SWOT Analysis
- 11.2.11.4. Recent Developments
- 11.2.11.5. Financials (Based on Availability)
- 11.2.12 UEDRIVE
- 11.2.12.1. Overview
- 11.2.12.2. Products
- 11.2.12.3. SWOT Analysis
- 11.2.12.4. Recent Developments
- 11.2.12.5. Financials (Based on Availability)
- 11.2.13 Heartsome
- 11.2.13.1. Overview
- 11.2.13.2. Products
- 11.2.13.3. SWOT Analysis
- 11.2.13.4. Recent Developments
- 11.2.13.5. Financials (Based on Availability)
- 11.2.14 Déjà Vu
- 11.2.14.1. Overview
- 11.2.14.2. Products
- 11.2.14.3. SWOT Analysis
- 11.2.14.4. Recent Developments
- 11.2.14.5. Financials (Based on Availability)
- 11.2.15 Xueren CAT
- 11.2.15.1. Overview
- 11.2.15.2. Products
- 11.2.15.3. SWOT Analysis
- 11.2.15.4. Recent Developments
- 11.2.15.5. Financials (Based on Availability)
- 11.2.1 RWS Group
List of Figures
- Figure 1: Global Computer-aided Translation Software Revenue Breakdown (million, %) by Region 2025 & 2033
- Figure 2: North America Computer-aided Translation Software Revenue (million), by Application 2025 & 2033
- Figure 3: North America Computer-aided Translation Software Revenue Share (%), by Application 2025 & 2033
- Figure 4: North America Computer-aided Translation Software Revenue (million), by Types 2025 & 2033
- Figure 5: North America Computer-aided Translation Software Revenue Share (%), by Types 2025 & 2033
- Figure 6: North America Computer-aided Translation Software Revenue (million), by Country 2025 & 2033
- Figure 7: North America Computer-aided Translation Software Revenue Share (%), by Country 2025 & 2033
- Figure 8: South America Computer-aided Translation Software Revenue (million), by Application 2025 & 2033
- Figure 9: South America Computer-aided Translation Software Revenue Share (%), by Application 2025 & 2033
- Figure 10: South America Computer-aided Translation Software Revenue (million), by Types 2025 & 2033
- Figure 11: South America Computer-aided Translation Software Revenue Share (%), by Types 2025 & 2033
- Figure 12: South America Computer-aided Translation Software Revenue (million), by Country 2025 & 2033
- Figure 13: South America Computer-aided Translation Software Revenue Share (%), by Country 2025 & 2033
- Figure 14: Europe Computer-aided Translation Software Revenue (million), by Application 2025 & 2033
- Figure 15: Europe Computer-aided Translation Software Revenue Share (%), by Application 2025 & 2033
- Figure 16: Europe Computer-aided Translation Software Revenue (million), by Types 2025 & 2033
- Figure 17: Europe Computer-aided Translation Software Revenue Share (%), by Types 2025 & 2033
- Figure 18: Europe Computer-aided Translation Software Revenue (million), by Country 2025 & 2033
- Figure 19: Europe Computer-aided Translation Software Revenue Share (%), by Country 2025 & 2033
- Figure 20: Middle East & Africa Computer-aided Translation Software Revenue (million), by Application 2025 & 2033
- Figure 21: Middle East & Africa Computer-aided Translation Software Revenue Share (%), by Application 2025 & 2033
- Figure 22: Middle East & Africa Computer-aided Translation Software Revenue (million), by Types 2025 & 2033
- Figure 23: Middle East & Africa Computer-aided Translation Software Revenue Share (%), by Types 2025 & 2033
- Figure 24: Middle East & Africa Computer-aided Translation Software Revenue (million), by Country 2025 & 2033
- Figure 25: Middle East & Africa Computer-aided Translation Software Revenue Share (%), by Country 2025 & 2033
- Figure 26: Asia Pacific Computer-aided Translation Software Revenue (million), by Application 2025 & 2033
- Figure 27: Asia Pacific Computer-aided Translation Software Revenue Share (%), by Application 2025 & 2033
- Figure 28: Asia Pacific Computer-aided Translation Software Revenue (million), by Types 2025 & 2033
- Figure 29: Asia Pacific Computer-aided Translation Software Revenue Share (%), by Types 2025 & 2033
- Figure 30: Asia Pacific Computer-aided Translation Software Revenue (million), by Country 2025 & 2033
- Figure 31: Asia Pacific Computer-aided Translation Software Revenue Share (%), by Country 2025 & 2033
List of Tables
- Table 1: Global Computer-aided Translation Software Revenue million Forecast, by Application 2020 & 2033
- Table 2: Global Computer-aided Translation Software Revenue million Forecast, by Types 2020 & 2033
- Table 3: Global Computer-aided Translation Software Revenue million Forecast, by Region 2020 & 2033
- Table 4: Global Computer-aided Translation Software Revenue million Forecast, by Application 2020 & 2033
- Table 5: Global Computer-aided Translation Software Revenue million Forecast, by Types 2020 & 2033
- Table 6: Global Computer-aided Translation Software Revenue million Forecast, by Country 2020 & 2033
- Table 7: United States Computer-aided Translation Software Revenue (million) Forecast, by Application 2020 & 2033
- Table 8: Canada Computer-aided Translation Software Revenue (million) Forecast, by Application 2020 & 2033
- Table 9: Mexico Computer-aided Translation Software Revenue (million) Forecast, by Application 2020 & 2033
- Table 10: Global Computer-aided Translation Software Revenue million Forecast, by Application 2020 & 2033
- Table 11: Global Computer-aided Translation Software Revenue million Forecast, by Types 2020 & 2033
- Table 12: Global Computer-aided Translation Software Revenue million Forecast, by Country 2020 & 2033
- Table 13: Brazil Computer-aided Translation Software Revenue (million) Forecast, by Application 2020 & 2033
- Table 14: Argentina Computer-aided Translation Software Revenue (million) Forecast, by Application 2020 & 2033
- Table 15: Rest of South America Computer-aided Translation Software Revenue (million) Forecast, by Application 2020 & 2033
- Table 16: Global Computer-aided Translation Software Revenue million Forecast, by Application 2020 & 2033
- Table 17: Global Computer-aided Translation Software Revenue million Forecast, by Types 2020 & 2033
- Table 18: Global Computer-aided Translation Software Revenue million Forecast, by Country 2020 & 2033
- Table 19: United Kingdom Computer-aided Translation Software Revenue (million) Forecast, by Application 2020 & 2033
- Table 20: Germany Computer-aided Translation Software Revenue (million) Forecast, by Application 2020 & 2033
- Table 21: France Computer-aided Translation Software Revenue (million) Forecast, by Application 2020 & 2033
- Table 22: Italy Computer-aided Translation Software Revenue (million) Forecast, by Application 2020 & 2033
- Table 23: Spain Computer-aided Translation Software Revenue (million) Forecast, by Application 2020 & 2033
- Table 24: Russia Computer-aided Translation Software Revenue (million) Forecast, by Application 2020 & 2033
- Table 25: Benelux Computer-aided Translation Software Revenue (million) Forecast, by Application 2020 & 2033
- Table 26: Nordics Computer-aided Translation Software Revenue (million) Forecast, by Application 2020 & 2033
- Table 27: Rest of Europe Computer-aided Translation Software Revenue (million) Forecast, by Application 2020 & 2033
- Table 28: Global Computer-aided Translation Software Revenue million Forecast, by Application 2020 & 2033
- Table 29: Global Computer-aided Translation Software Revenue million Forecast, by Types 2020 & 2033
- Table 30: Global Computer-aided Translation Software Revenue million Forecast, by Country 2020 & 2033
- Table 31: Turkey Computer-aided Translation Software Revenue (million) Forecast, by Application 2020 & 2033
- Table 32: Israel Computer-aided Translation Software Revenue (million) Forecast, by Application 2020 & 2033
- Table 33: GCC Computer-aided Translation Software Revenue (million) Forecast, by Application 2020 & 2033
- Table 34: North Africa Computer-aided Translation Software Revenue (million) Forecast, by Application 2020 & 2033
- Table 35: South Africa Computer-aided Translation Software Revenue (million) Forecast, by Application 2020 & 2033
- Table 36: Rest of Middle East & Africa Computer-aided Translation Software Revenue (million) Forecast, by Application 2020 & 2033
- Table 37: Global Computer-aided Translation Software Revenue million Forecast, by Application 2020 & 2033
- Table 38: Global Computer-aided Translation Software Revenue million Forecast, by Types 2020 & 2033
- Table 39: Global Computer-aided Translation Software Revenue million Forecast, by Country 2020 & 2033
- Table 40: China Computer-aided Translation Software Revenue (million) Forecast, by Application 2020 & 2033
- Table 41: India Computer-aided Translation Software Revenue (million) Forecast, by Application 2020 & 2033
- Table 42: Japan Computer-aided Translation Software Revenue (million) Forecast, by Application 2020 & 2033
- Table 43: South Korea Computer-aided Translation Software Revenue (million) Forecast, by Application 2020 & 2033
- Table 44: ASEAN Computer-aided Translation Software Revenue (million) Forecast, by Application 2020 & 2033
- Table 45: Oceania Computer-aided Translation Software Revenue (million) Forecast, by Application 2020 & 2033
- Table 46: Rest of Asia Pacific Computer-aided Translation Software Revenue (million) Forecast, by Application 2020 & 2033
Frequently Asked Questions
1. What is the projected Compound Annual Growth Rate (CAGR) of the Computer-aided Translation Software?
The projected CAGR is approximately 16.5%.
2. Which companies are prominent players in the Computer-aided Translation Software?
Key companies in the market include RWS Group, Across, Star Transit, Smartcat, TransPerfect, Lionbridge, LanguageWire, XTM Cloud, MemoQ, Memsource, Wordfast, UEDRIVE, Heartsome, Déjà Vu, Xueren CAT.
3. What are the main segments of the Computer-aided Translation Software?
The market segments include Application, Types.
4. Can you provide details about the market size?
The market size is estimated to be USD 412.8 million as of 2022.
5. What are some drivers contributing to market growth?
N/A
6. What are the notable trends driving market growth?
N/A
7. Are there any restraints impacting market growth?
N/A
8. Can you provide examples of recent developments in the market?
N/A
9. What pricing options are available for accessing the report?
Pricing options include single-user, multi-user, and enterprise licenses priced at USD 3950.00, USD 5925.00, and USD 7900.00 respectively.
10. Is the market size provided in terms of value or volume?
The market size is provided in terms of value, measured in million.
11. Are there any specific market keywords associated with the report?
Yes, the market keyword associated with the report is "Computer-aided Translation Software," which aids in identifying and referencing the specific market segment covered.
12. How do I determine which pricing option suits my needs best?
The pricing options vary based on user requirements and access needs. Individual users may opt for single-user licenses, while businesses requiring broader access may choose multi-user or enterprise licenses for cost-effective access to the report.
13. Are there any additional resources or data provided in the Computer-aided Translation Software report?
While the report offers comprehensive insights, it's advisable to review the specific contents or supplementary materials provided to ascertain if additional resources or data are available.
14. How can I stay updated on further developments or reports in the Computer-aided Translation Software?
To stay informed about further developments, trends, and reports in the Computer-aided Translation Software, consider subscribing to industry newsletters, following relevant companies and organizations, or regularly checking reputable industry news sources and publications.
Methodology
Step 1 - Identification of Relevant Samples Size from Population Database


Step 2 - Approaches for Defining Global Market Size (Value, Volume* & Price*)

Note*: In applicable scenarios
Step 3 - Data Sources
Primary Research
- Web Analytics
- Survey Reports
- Research Institute
- Latest Research Reports
- Opinion Leaders
Secondary Research
- Annual Reports
- White Paper
- Latest Press Release
- Industry Association
- Paid Database
- Investor Presentations

Step 4 - Data Triangulation
Involves using different sources of information in order to increase the validity of a study
These sources are likely to be stakeholders in a program - participants, other researchers, program staff, other community members, and so on.
Then we put all data in single framework & apply various statistical tools to find out the dynamic on the market.
During the analysis stage, feedback from the stakeholder groups would be compared to determine areas of agreement as well as areas of divergence