

Key Insights
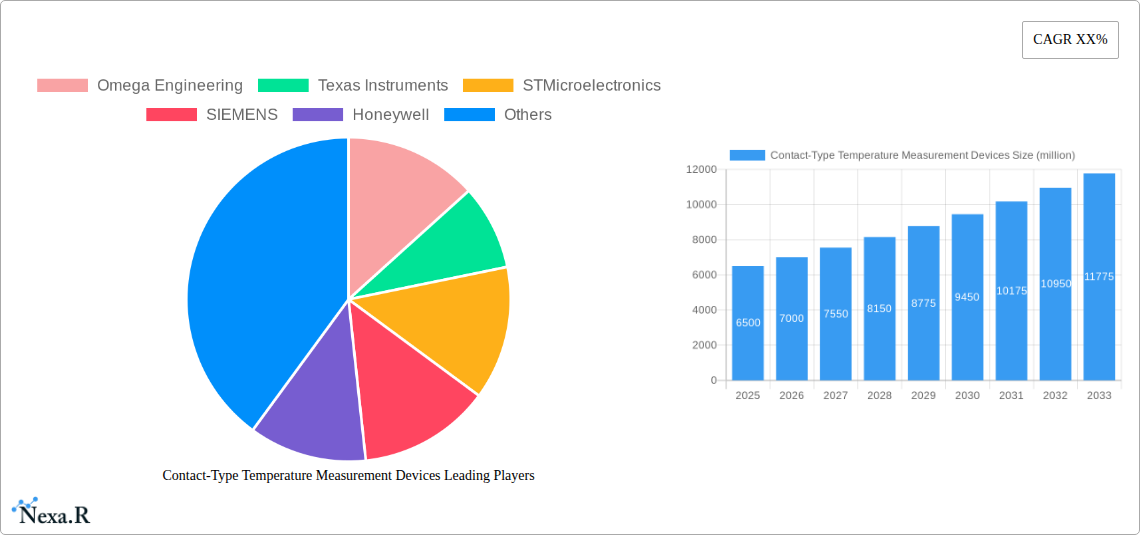
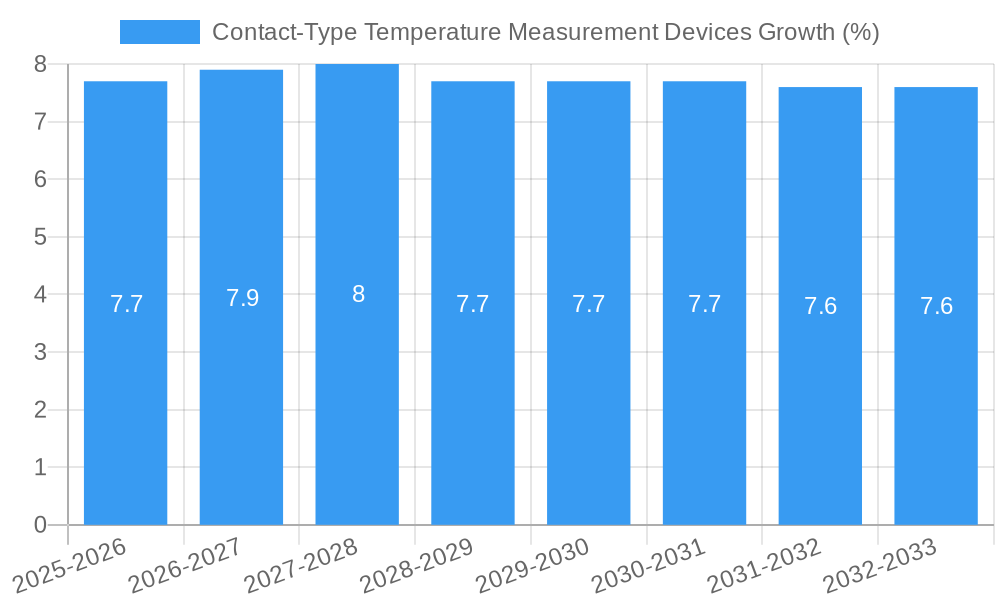
The global market for Contact-Type Temperature Measurement Devices is projected to experience robust growth, driven by increasing demand across a spectrum of industrial applications. With a current market size estimated at approximately $6,500 million and a projected Compound Annual Growth Rate (CAGR) of 7.5%, the market is expected to reach around $12,500 million by 2033. This expansion is fueled by critical sectors such as the medical industry, where precise temperature monitoring is paramount for patient care and diagnostic accuracy, and the oil and mining sectors, requiring reliable temperature data for operational efficiency and safety. The automotive industry's increasing adoption of advanced thermal management systems and the growing reliance on HVAC systems for comfort and industrial processes further contribute to market momentum. Renewable energy installations, particularly solar and wind, also necessitate accurate temperature sensing for optimal performance and maintenance, while the stringent requirements of glass making and chemical processing underscore the indispensable role of these devices.
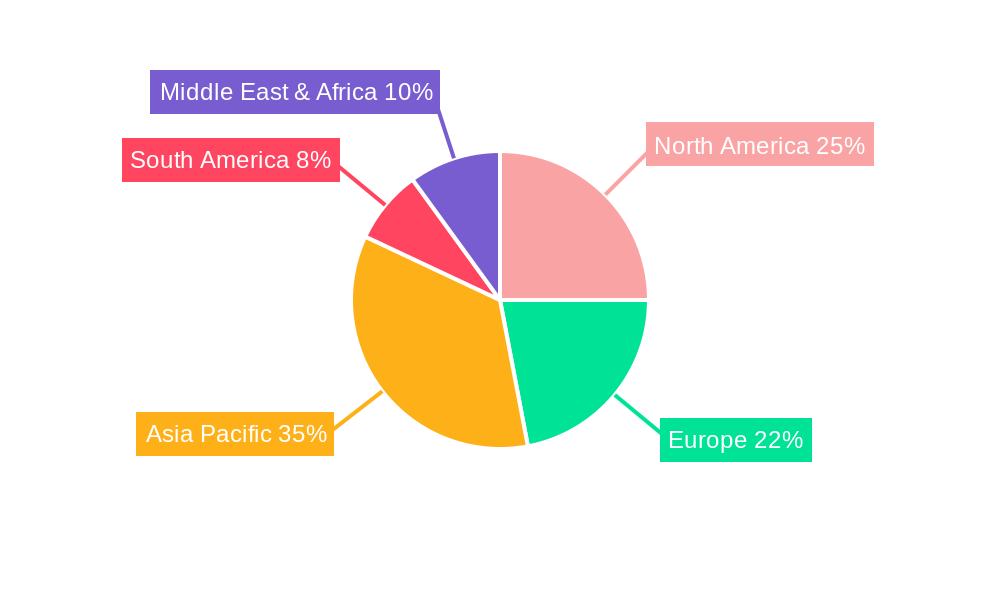
Key trends shaping the market include the continuous innovation in sensor technology, leading to more accurate, durable, and cost-effective solutions. The integration of smart features and IoT connectivity is enabling real-time data acquisition and remote monitoring, enhancing predictive maintenance capabilities and operational insights. Thermocouples and resistance thermometers remain dominant types, but the development of advanced thermistors with higher sensitivity and faster response times is gaining traction. However, the market faces certain restraints, including the high initial cost of sophisticated systems in some applications and the need for regular calibration and maintenance, which can impact adoption rates in cost-sensitive segments. Geographically, the Asia Pacific region, particularly China and India, is anticipated to lead growth due to rapid industrialization and increasing investments in infrastructure and manufacturing. North America and Europe will continue to be significant markets, driven by technological advancements and stringent regulatory standards.
Contact-Type Temperature Measurement Devices Market Dynamics & Structure
The global contact-type temperature measurement devices market is characterized by a moderately concentrated structure, with key players like SIEMENS, Honeywell, and Endress+Hauser holding significant market share. Technological innovation is a primary driver, fueled by advancements in sensor technology and miniaturization, enabling more accurate and reliable temperature monitoring across diverse applications. Regulatory frameworks, particularly those related to industrial safety and medical device certifications, play a crucial role in shaping product development and market entry. Competitive product substitutes, such as non-contact infrared thermometers, present a challenge, especially in applications where direct contact is not feasible or preferred. End-user demographics are shifting, with an increasing demand for smart and connected temperature sensing solutions in industries like HVAC, renewable energy, and medical applications. Mergers and acquisitions (M&A) trends are observed as larger companies seek to consolidate their market position and acquire innovative technologies. For instance, the historical period saw an average of 5-8 significant M&A deals annually, indicating strategic consolidation. Barriers to innovation include the high cost of R&D for next-generation sensors and the stringent validation processes required for critical applications.
- Market Concentration: Moderately concentrated, with top 5 players accounting for approximately 45-55% of the market share in the base year 2025.
- Technological Innovation Drivers: Miniaturization, enhanced accuracy, IoT integration, and advanced material science in sensor design.
- Regulatory Frameworks: ISO certifications (e.g., ISO 9001), FDA approvals for medical devices, ATEX directives for hazardous environments.
- Competitive Product Substitutes: Infrared thermometers, thermal cameras, and fiber optic sensors.
- End-User Demographics: Growing demand from industrial automation, healthcare, automotive, and smart building sectors.
- M&A Trends: Focus on acquiring companies with expertise in IoT connectivity and specialized sensor technologies.
Contact-Type Temperature Measurement Devices Growth Trends & Insights
The global contact-type temperature measurement devices market is projected to witness robust growth throughout the forecast period. The market size, valued at approximately $8,500 million in the base year 2025, is anticipated to expand at a Compound Annual Growth Rate (CAGR) of around 6.5% from 2025 to 2033, reaching an estimated $14,200 million by the end of the forecast period. This expansion is driven by a confluence of factors, including increasing industrial automation, stringent quality control requirements across various sectors, and the growing adoption of smart technologies. The push for energy efficiency in buildings and industrial processes is significantly boosting the demand for advanced HVAC system temperature monitoring solutions. In the medical application segment, the need for precise temperature control in critical care, pharmaceutical manufacturing, and diagnostic equipment is a key growth enabler. The oil and mining sector, despite its cyclical nature, continues to rely on robust temperature monitoring for operational safety and efficiency, contributing to market demand. Furthermore, the burgeoning renewable energy sector, particularly solar and wind power, necessitates reliable temperature measurement for performance optimization and equipment longevity.
Technological disruptions are reshaping the market landscape. The integration of Internet of Things (IoT) capabilities into contact-type temperature sensors is a significant trend, enabling real-time data collection, remote monitoring, and predictive maintenance. This shift towards connected devices is enhancing operational efficiency and reducing downtime for end-users. The development of more sensitive and durable sensor materials, such as advanced alloys and ceramics, is improving the performance and lifespan of these devices, even in harsh environments. Consumer behavior is also evolving; end-users are increasingly seeking integrated solutions that offer not just temperature data but also analytics and actionable insights. This demand is pushing manufacturers to develop smart sensors that can communicate seamlessly with existing control systems and cloud platforms. The historical period from 2019 to 2024 saw a steady market expansion, with an average annual growth rate of approximately 5.8%, laying a strong foundation for future growth. The estimated market size in 2025 reflects this consistent upward trajectory. The adoption rate of advanced contact-type temperature measurement devices is accelerating, particularly among large enterprises investing in digital transformation initiatives. The integration of artificial intelligence (AI) and machine learning (ML) in data analysis from these sensors is further augmenting their value proposition.
Dominant Regions, Countries, or Segments in Contact-Type Temperature Measurement Devices
The North America region is emerging as a dominant force in the global contact-type temperature measurement devices market, driven by a potent combination of advanced industrial infrastructure, robust technological innovation, and significant investments in key application sectors. Within North America, the United States stands out as a primary contributor, fueled by its expansive manufacturing base, leading healthcare industry, and substantial investments in renewable energy projects. The demand for precise and reliable temperature monitoring is critical across various segments in the US, including the advanced automotive sector, the sophisticated HVAC systems of commercial and residential buildings, and the highly regulated medical application field. For example, the increasing adoption of smart thermostats and building management systems in commercial real estate, coupled with stringent temperature control requirements for cold chain logistics in the pharmaceutical industry, significantly bolsters market growth.
In terms of specific Application segments, HVAC Systems and Medical Application are exhibiting particularly strong growth trajectories, often leading the market in terms of adoption and revenue. The HVAC segment benefits from global trends towards energy efficiency, smart buildings, and improved indoor air quality, driving demand for accurate temperature sensors in climate control systems. The medical application segment is propelled by the continuous need for sterile and precise temperature monitoring in hospitals, laboratories, pharmaceutical manufacturing, and medical devices, including incubators, sterilization equipment, and diagnostic tools. The market share for these segments in the base year 2025 is estimated to be around 20-25% for HVAC and 18-22% for Medical Applications, respectively.
Furthermore, the Types of devices, specifically Resistance Thermometers (RTDs) and Thermistors, are experiencing high adoption rates due to their superior accuracy, stability, and cost-effectiveness in a wide range of applications. RTDs, in particular, are favored in industrial settings requiring high precision and long-term reliability, such as in chemical processing and advanced manufacturing. Thermistors, on the other hand, are widely used in consumer electronics, automotive, and medical devices owing to their sensitivity and rapid response time. The growth of these specific sensor types is directly correlated with the expansion of the end-use industries that rely on them. Economic policies promoting industrial modernization and technological advancement, coupled with substantial government funding for R&D in areas like precision manufacturing and healthcare technology, provide significant tailwinds for the North American market and the dominant segments within it.
- Dominant Region: North America, with the United States as the leading country.
- Key Application Drivers: Industrial automation, energy efficiency, healthcare advancements, and smart building technologies.
- Leading Application Segments: HVAC Systems, Medical Application, Vehicle, and Integrated Circuit.
- Dominant Device Types: Resistance Thermometers (RTDs) and Thermistors.
- Market Share (Estimated Base Year 2025): HVAC Systems: 20-25%, Medical Application: 18-22%.
- Growth Potential: High, driven by technological integration and increasing demand for precision.
Contact-Type Temperature Measurement Devices Product Landscape
The product landscape for contact-type temperature measurement devices is characterized by continuous innovation aimed at enhancing accuracy, durability, and connectivity. Manufacturers are actively developing advanced sensors incorporating novel materials and miniaturized designs for improved performance in challenging environments. For instance, new thermocouple alloys offer extended temperature ranges and superior resistance to corrosion, while advanced RTD elements provide increased stability and faster response times. The integration of digital interfaces and wireless communication capabilities, such as Bluetooth and LoRaWAN, is a prominent trend, enabling seamless data transfer and IoT integration. This allows for remote monitoring, predictive maintenance, and sophisticated data analytics, adding significant value for end-users across industries like chemical processing, oil and gas, and medical equipment manufacturing. Unique selling propositions often lie in a device's ability to withstand extreme temperatures, resist harsh chemicals, or offer unparalleled accuracy in critical applications.
Key Drivers, Barriers & Challenges in Contact-Type Temperature Measurement Devices
Key Drivers: The primary forces propelling the contact-type temperature measurement devices market include the escalating demand for industrial automation and process control, stringent quality and safety regulations across industries, and the pervasive trend of IoT integration for enhanced monitoring and data analytics. Technological advancements in sensor accuracy and miniaturization, coupled with the growing need for energy efficiency solutions in buildings and industrial operations, also serve as significant growth catalysts.
Key Barriers & Challenges: Supply chain disruptions and raw material price volatility present considerable challenges, impacting production costs and lead times. The high cost of research and development for cutting-edge sensor technologies and the rigorous validation processes required for critical applications, such as medical devices, can hinder market entry for new players. Intense competition from both established manufacturers and emerging innovators, alongside the increasing adoption of non-contact temperature measurement alternatives in certain niches, also pose significant competitive pressures. Regulatory hurdles and the need for adherence to evolving international standards can add complexity and cost to product development and market access.
Emerging Opportunities in Contact-Type Temperature Measurement Devices
Emerging opportunities lie in the development of highly specialized sensors for extreme environments, such as deep-sea oil exploration or advanced aerospace applications. The growing demand for smart, self-calibrating sensors with embedded AI capabilities presents a significant untapped market. Furthermore, the expansion of the electric vehicle (EV) market necessitates sophisticated thermal management systems, creating a burgeoning demand for precise and robust temperature sensors in batteries, powertrains, and charging infrastructure. The increasing focus on personalized medicine and home healthcare also opens avenues for miniaturized, cost-effective temperature sensors integrated into wearable medical devices and patient monitoring systems.
Growth Accelerators in the Contact-Type Temperature Measurement Devices Industry
Long-term growth in the contact-type temperature measurement devices industry will be accelerated by continued breakthroughs in materials science, leading to sensors with enhanced performance characteristics and greater longevity. Strategic partnerships between sensor manufacturers and industrial automation or IoT platform providers will foster the development of integrated solutions, expanding market reach. The growing global emphasis on sustainability and energy efficiency will continue to drive demand for accurate temperature monitoring in renewable energy generation, industrial processes, and building management. Furthermore, market expansion into emerging economies, driven by industrialization and infrastructure development, will offer significant growth potential.
Key Players Shaping the Contact-Type Temperature Measurement Devices Market
- Omega Engineering
- Texas Instruments
- STMicroelectronics
- SIEMENS
- Honeywell
- TE Connectivity
- Wika
- Endress+Hauser
- Analog Devices
- Amphenol
- Murata
- Mitsubishi Electric
- KYOCERA AVX
- Panasonic
- Danfoss
- ABB
- TDK
- IHI Corporation
- SEMITEC
- Vishay Intertechnology
- Bourns
Notable Milestones in Contact-Type Temperature Measurement Devices Sector
- 2019-2020: Increased integration of IoT capabilities into industrial temperature sensors, enabling remote monitoring and predictive maintenance.
- 2020-2021: Advancements in MEMS (Micro-Electro-Mechanical Systems) technology leading to smaller, more energy-efficient thermistors.
- 2021-2022: Growing demand for highly accurate temperature sensors in vaccine cold chain logistics due to the global pandemic.
- 2022-2023: Introduction of novel sensor materials offering enhanced resistance to extreme temperatures and corrosive environments.
- 2023-2024: Focus on developing smart sensors with on-board AI for advanced data analysis and anomaly detection.
In-Depth Contact-Type Temperature Measurement Devices Market Outlook
The future outlook for the contact-type temperature measurement devices market is exceptionally promising, driven by ongoing technological advancements and expanding application horizons. Growth accelerators such as the relentless pursuit of industrial automation, stringent quality control mandates, and the ubiquitous adoption of the Internet of Things will continue to fuel market expansion. The burgeoning demand from renewable energy sectors, the sophisticated requirements of the medical industry, and the evolving needs of the automotive sector, particularly in electric vehicle thermal management, present substantial strategic opportunities for market participants. The market is poised for sustained growth, with innovation in sensor materials, miniaturization, and intelligent connectivity being key determinants of future success.
Contact-Type Temperature Measurement Devices Segmentation
-
1. Application
- 1.1. Medical Application
- 1.2. Oil Mining
- 1.3. Vehicle
- 1.4. HVAC System
- 1.5. Renewable Energy
- 1.6. Glass Making
- 1.7. Chemical
- 1.8. Integrated Circuit
-
2. Types
- 2.1. Thermocouples
- 2.2. Resistance Thermometers
- 2.3. Thermistors
- 2.4. Others
Contact-Type Temperature Measurement Devices Segmentation By Geography
-
1. North America
- 1.1. United States
- 1.2. Canada
- 1.3. Mexico
-
2. South America
- 2.1. Brazil
- 2.2. Argentina
- 2.3. Rest of South America
-
3. Europe
- 3.1. United Kingdom
- 3.2. Germany
- 3.3. France
- 3.4. Italy
- 3.5. Spain
- 3.6. Russia
- 3.7. Benelux
- 3.8. Nordics
- 3.9. Rest of Europe
-
4. Middle East & Africa
- 4.1. Turkey
- 4.2. Israel
- 4.3. GCC
- 4.4. North Africa
- 4.5. South Africa
- 4.6. Rest of Middle East & Africa
-
5. Asia Pacific
- 5.1. China
- 5.2. India
- 5.3. Japan
- 5.4. South Korea
- 5.5. ASEAN
- 5.6. Oceania
- 5.7. Rest of Asia Pacific
Contact-Type Temperature Measurement Devices REPORT HIGHLIGHTS
| Aspects | Details |
|---|---|
| Study Period | 2019-2033 |
| Base Year | 2024 |
| Estimated Year | 2025 |
| Forecast Period | 2025-2033 |
| Historical Period | 2019-2024 |
| Growth Rate | CAGR of XX% from 2019-2033 |
| Segmentation |
|
Table of Contents
- 1. Introduction
- 1.1. Research Scope
- 1.2. Market Segmentation
- 1.3. Research Methodology
- 1.4. Definitions and Assumptions
- 2. Executive Summary
- 2.1. Introduction
- 3. Market Dynamics
- 3.1. Introduction
- 3.2. Market Drivers
- 3.3. Market Restrains
- 3.4. Market Trends
- 4. Market Factor Analysis
- 4.1. Porters Five Forces
- 4.2. Supply/Value Chain
- 4.3. PESTEL analysis
- 4.4. Market Entropy
- 4.5. Patent/Trademark Analysis
- 5. Global Contact-Type Temperature Measurement Devices Analysis, Insights and Forecast, 2019-2031
- 5.1. Market Analysis, Insights and Forecast - by Application
- 5.1.1. Medical Application
- 5.1.2. Oil Mining
- 5.1.3. Vehicle
- 5.1.4. HVAC System
- 5.1.5. Renewable Energy
- 5.1.6. Glass Making
- 5.1.7. Chemical
- 5.1.8. Integrated Circuit
- 5.2. Market Analysis, Insights and Forecast - by Types
- 5.2.1. Thermocouples
- 5.2.2. Resistance Thermometers
- 5.2.3. Thermistors
- 5.2.4. Others
- 5.3. Market Analysis, Insights and Forecast - by Region
- 5.3.1. North America
- 5.3.2. South America
- 5.3.3. Europe
- 5.3.4. Middle East & Africa
- 5.3.5. Asia Pacific
- 5.1. Market Analysis, Insights and Forecast - by Application
- 6. North America Contact-Type Temperature Measurement Devices Analysis, Insights and Forecast, 2019-2031
- 6.1. Market Analysis, Insights and Forecast - by Application
- 6.1.1. Medical Application
- 6.1.2. Oil Mining
- 6.1.3. Vehicle
- 6.1.4. HVAC System
- 6.1.5. Renewable Energy
- 6.1.6. Glass Making
- 6.1.7. Chemical
- 6.1.8. Integrated Circuit
- 6.2. Market Analysis, Insights and Forecast - by Types
- 6.2.1. Thermocouples
- 6.2.2. Resistance Thermometers
- 6.2.3. Thermistors
- 6.2.4. Others
- 6.1. Market Analysis, Insights and Forecast - by Application
- 7. South America Contact-Type Temperature Measurement Devices Analysis, Insights and Forecast, 2019-2031
- 7.1. Market Analysis, Insights and Forecast - by Application
- 7.1.1. Medical Application
- 7.1.2. Oil Mining
- 7.1.3. Vehicle
- 7.1.4. HVAC System
- 7.1.5. Renewable Energy
- 7.1.6. Glass Making
- 7.1.7. Chemical
- 7.1.8. Integrated Circuit
- 7.2. Market Analysis, Insights and Forecast - by Types
- 7.2.1. Thermocouples
- 7.2.2. Resistance Thermometers
- 7.2.3. Thermistors
- 7.2.4. Others
- 7.1. Market Analysis, Insights and Forecast - by Application
- 8. Europe Contact-Type Temperature Measurement Devices Analysis, Insights and Forecast, 2019-2031
- 8.1. Market Analysis, Insights and Forecast - by Application
- 8.1.1. Medical Application
- 8.1.2. Oil Mining
- 8.1.3. Vehicle
- 8.1.4. HVAC System
- 8.1.5. Renewable Energy
- 8.1.6. Glass Making
- 8.1.7. Chemical
- 8.1.8. Integrated Circuit
- 8.2. Market Analysis, Insights and Forecast - by Types
- 8.2.1. Thermocouples
- 8.2.2. Resistance Thermometers
- 8.2.3. Thermistors
- 8.2.4. Others
- 8.1. Market Analysis, Insights and Forecast - by Application
- 9. Middle East & Africa Contact-Type Temperature Measurement Devices Analysis, Insights and Forecast, 2019-2031
- 9.1. Market Analysis, Insights and Forecast - by Application
- 9.1.1. Medical Application
- 9.1.2. Oil Mining
- 9.1.3. Vehicle
- 9.1.4. HVAC System
- 9.1.5. Renewable Energy
- 9.1.6. Glass Making
- 9.1.7. Chemical
- 9.1.8. Integrated Circuit
- 9.2. Market Analysis, Insights and Forecast - by Types
- 9.2.1. Thermocouples
- 9.2.2. Resistance Thermometers
- 9.2.3. Thermistors
- 9.2.4. Others
- 9.1. Market Analysis, Insights and Forecast - by Application
- 10. Asia Pacific Contact-Type Temperature Measurement Devices Analysis, Insights and Forecast, 2019-2031
- 10.1. Market Analysis, Insights and Forecast - by Application
- 10.1.1. Medical Application
- 10.1.2. Oil Mining
- 10.1.3. Vehicle
- 10.1.4. HVAC System
- 10.1.5. Renewable Energy
- 10.1.6. Glass Making
- 10.1.7. Chemical
- 10.1.8. Integrated Circuit
- 10.2. Market Analysis, Insights and Forecast - by Types
- 10.2.1. Thermocouples
- 10.2.2. Resistance Thermometers
- 10.2.3. Thermistors
- 10.2.4. Others
- 10.1. Market Analysis, Insights and Forecast - by Application
- 11. Competitive Analysis
- 11.1. Global Market Share Analysis 2024
- 11.2. Company Profiles
- 11.2.1 Omega Engineering
- 11.2.1.1. Overview
- 11.2.1.2. Products
- 11.2.1.3. SWOT Analysis
- 11.2.1.4. Recent Developments
- 11.2.1.5. Financials (Based on Availability)
- 11.2.2 Texas Instruments
- 11.2.2.1. Overview
- 11.2.2.2. Products
- 11.2.2.3. SWOT Analysis
- 11.2.2.4. Recent Developments
- 11.2.2.5. Financials (Based on Availability)
- 11.2.3 STMicroelectronics
- 11.2.3.1. Overview
- 11.2.3.2. Products
- 11.2.3.3. SWOT Analysis
- 11.2.3.4. Recent Developments
- 11.2.3.5. Financials (Based on Availability)
- 11.2.4 SIEMENS
- 11.2.4.1. Overview
- 11.2.4.2. Products
- 11.2.4.3. SWOT Analysis
- 11.2.4.4. Recent Developments
- 11.2.4.5. Financials (Based on Availability)
- 11.2.5 Honeywell
- 11.2.5.1. Overview
- 11.2.5.2. Products
- 11.2.5.3. SWOT Analysis
- 11.2.5.4. Recent Developments
- 11.2.5.5. Financials (Based on Availability)
- 11.2.6 TE Connectivity
- 11.2.6.1. Overview
- 11.2.6.2. Products
- 11.2.6.3. SWOT Analysis
- 11.2.6.4. Recent Developments
- 11.2.6.5. Financials (Based on Availability)
- 11.2.7 Wika
- 11.2.7.1. Overview
- 11.2.7.2. Products
- 11.2.7.3. SWOT Analysis
- 11.2.7.4. Recent Developments
- 11.2.7.5. Financials (Based on Availability)
- 11.2.8 Endress+Hauser
- 11.2.8.1. Overview
- 11.2.8.2. Products
- 11.2.8.3. SWOT Analysis
- 11.2.8.4. Recent Developments
- 11.2.8.5. Financials (Based on Availability)
- 11.2.9 Analog Devices
- 11.2.9.1. Overview
- 11.2.9.2. Products
- 11.2.9.3. SWOT Analysis
- 11.2.9.4. Recent Developments
- 11.2.9.5. Financials (Based on Availability)
- 11.2.10 Amphenol
- 11.2.10.1. Overview
- 11.2.10.2. Products
- 11.2.10.3. SWOT Analysis
- 11.2.10.4. Recent Developments
- 11.2.10.5. Financials (Based on Availability)
- 11.2.11 Murata
- 11.2.11.1. Overview
- 11.2.11.2. Products
- 11.2.11.3. SWOT Analysis
- 11.2.11.4. Recent Developments
- 11.2.11.5. Financials (Based on Availability)
- 11.2.12 Mitsubishi Electric
- 11.2.12.1. Overview
- 11.2.12.2. Products
- 11.2.12.3. SWOT Analysis
- 11.2.12.4. Recent Developments
- 11.2.12.5. Financials (Based on Availability)
- 11.2.13 KYOCERA AVX
- 11.2.13.1. Overview
- 11.2.13.2. Products
- 11.2.13.3. SWOT Analysis
- 11.2.13.4. Recent Developments
- 11.2.13.5. Financials (Based on Availability)
- 11.2.14 Panasonic
- 11.2.14.1. Overview
- 11.2.14.2. Products
- 11.2.14.3. SWOT Analysis
- 11.2.14.4. Recent Developments
- 11.2.14.5. Financials (Based on Availability)
- 11.2.15 Danfoss
- 11.2.15.1. Overview
- 11.2.15.2. Products
- 11.2.15.3. SWOT Analysis
- 11.2.15.4. Recent Developments
- 11.2.15.5. Financials (Based on Availability)
- 11.2.16 ABB
- 11.2.16.1. Overview
- 11.2.16.2. Products
- 11.2.16.3. SWOT Analysis
- 11.2.16.4. Recent Developments
- 11.2.16.5. Financials (Based on Availability)
- 11.2.17 TDK
- 11.2.17.1. Overview
- 11.2.17.2. Products
- 11.2.17.3. SWOT Analysis
- 11.2.17.4. Recent Developments
- 11.2.17.5. Financials (Based on Availability)
- 11.2.18 IHI Corporation
- 11.2.18.1. Overview
- 11.2.18.2. Products
- 11.2.18.3. SWOT Analysis
- 11.2.18.4. Recent Developments
- 11.2.18.5. Financials (Based on Availability)
- 11.2.19 SEMITEC
- 11.2.19.1. Overview
- 11.2.19.2. Products
- 11.2.19.3. SWOT Analysis
- 11.2.19.4. Recent Developments
- 11.2.19.5. Financials (Based on Availability)
- 11.2.20 Vishay Intertechnology
- 11.2.20.1. Overview
- 11.2.20.2. Products
- 11.2.20.3. SWOT Analysis
- 11.2.20.4. Recent Developments
- 11.2.20.5. Financials (Based on Availability)
- 11.2.21 Bourns
- 11.2.21.1. Overview
- 11.2.21.2. Products
- 11.2.21.3. SWOT Analysis
- 11.2.21.4. Recent Developments
- 11.2.21.5. Financials (Based on Availability)
- 11.2.1 Omega Engineering
List of Figures
- Figure 1: Global Contact-Type Temperature Measurement Devices Revenue Breakdown (million, %) by Region 2024 & 2032
- Figure 2: Global Contact-Type Temperature Measurement Devices Volume Breakdown (K, %) by Region 2024 & 2032
- Figure 3: North America Contact-Type Temperature Measurement Devices Revenue (million), by Application 2024 & 2032
- Figure 4: North America Contact-Type Temperature Measurement Devices Volume (K), by Application 2024 & 2032
- Figure 5: North America Contact-Type Temperature Measurement Devices Revenue Share (%), by Application 2024 & 2032
- Figure 6: North America Contact-Type Temperature Measurement Devices Volume Share (%), by Application 2024 & 2032
- Figure 7: North America Contact-Type Temperature Measurement Devices Revenue (million), by Types 2024 & 2032
- Figure 8: North America Contact-Type Temperature Measurement Devices Volume (K), by Types 2024 & 2032
- Figure 9: North America Contact-Type Temperature Measurement Devices Revenue Share (%), by Types 2024 & 2032
- Figure 10: North America Contact-Type Temperature Measurement Devices Volume Share (%), by Types 2024 & 2032
- Figure 11: North America Contact-Type Temperature Measurement Devices Revenue (million), by Country 2024 & 2032
- Figure 12: North America Contact-Type Temperature Measurement Devices Volume (K), by Country 2024 & 2032
- Figure 13: North America Contact-Type Temperature Measurement Devices Revenue Share (%), by Country 2024 & 2032
- Figure 14: North America Contact-Type Temperature Measurement Devices Volume Share (%), by Country 2024 & 2032
- Figure 15: South America Contact-Type Temperature Measurement Devices Revenue (million), by Application 2024 & 2032
- Figure 16: South America Contact-Type Temperature Measurement Devices Volume (K), by Application 2024 & 2032
- Figure 17: South America Contact-Type Temperature Measurement Devices Revenue Share (%), by Application 2024 & 2032
- Figure 18: South America Contact-Type Temperature Measurement Devices Volume Share (%), by Application 2024 & 2032
- Figure 19: South America Contact-Type Temperature Measurement Devices Revenue (million), by Types 2024 & 2032
- Figure 20: South America Contact-Type Temperature Measurement Devices Volume (K), by Types 2024 & 2032
- Figure 21: South America Contact-Type Temperature Measurement Devices Revenue Share (%), by Types 2024 & 2032
- Figure 22: South America Contact-Type Temperature Measurement Devices Volume Share (%), by Types 2024 & 2032
- Figure 23: South America Contact-Type Temperature Measurement Devices Revenue (million), by Country 2024 & 2032
- Figure 24: South America Contact-Type Temperature Measurement Devices Volume (K), by Country 2024 & 2032
- Figure 25: South America Contact-Type Temperature Measurement Devices Revenue Share (%), by Country 2024 & 2032
- Figure 26: South America Contact-Type Temperature Measurement Devices Volume Share (%), by Country 2024 & 2032
- Figure 27: Europe Contact-Type Temperature Measurement Devices Revenue (million), by Application 2024 & 2032
- Figure 28: Europe Contact-Type Temperature Measurement Devices Volume (K), by Application 2024 & 2032
- Figure 29: Europe Contact-Type Temperature Measurement Devices Revenue Share (%), by Application 2024 & 2032
- Figure 30: Europe Contact-Type Temperature Measurement Devices Volume Share (%), by Application 2024 & 2032
- Figure 31: Europe Contact-Type Temperature Measurement Devices Revenue (million), by Types 2024 & 2032
- Figure 32: Europe Contact-Type Temperature Measurement Devices Volume (K), by Types 2024 & 2032
- Figure 33: Europe Contact-Type Temperature Measurement Devices Revenue Share (%), by Types 2024 & 2032
- Figure 34: Europe Contact-Type Temperature Measurement Devices Volume Share (%), by Types 2024 & 2032
- Figure 35: Europe Contact-Type Temperature Measurement Devices Revenue (million), by Country 2024 & 2032
- Figure 36: Europe Contact-Type Temperature Measurement Devices Volume (K), by Country 2024 & 2032
- Figure 37: Europe Contact-Type Temperature Measurement Devices Revenue Share (%), by Country 2024 & 2032
- Figure 38: Europe Contact-Type Temperature Measurement Devices Volume Share (%), by Country 2024 & 2032
- Figure 39: Middle East & Africa Contact-Type Temperature Measurement Devices Revenue (million), by Application 2024 & 2032
- Figure 40: Middle East & Africa Contact-Type Temperature Measurement Devices Volume (K), by Application 2024 & 2032
- Figure 41: Middle East & Africa Contact-Type Temperature Measurement Devices Revenue Share (%), by Application 2024 & 2032
- Figure 42: Middle East & Africa Contact-Type Temperature Measurement Devices Volume Share (%), by Application 2024 & 2032
- Figure 43: Middle East & Africa Contact-Type Temperature Measurement Devices Revenue (million), by Types 2024 & 2032
- Figure 44: Middle East & Africa Contact-Type Temperature Measurement Devices Volume (K), by Types 2024 & 2032
- Figure 45: Middle East & Africa Contact-Type Temperature Measurement Devices Revenue Share (%), by Types 2024 & 2032
- Figure 46: Middle East & Africa Contact-Type Temperature Measurement Devices Volume Share (%), by Types 2024 & 2032
- Figure 47: Middle East & Africa Contact-Type Temperature Measurement Devices Revenue (million), by Country 2024 & 2032
- Figure 48: Middle East & Africa Contact-Type Temperature Measurement Devices Volume (K), by Country 2024 & 2032
- Figure 49: Middle East & Africa Contact-Type Temperature Measurement Devices Revenue Share (%), by Country 2024 & 2032
- Figure 50: Middle East & Africa Contact-Type Temperature Measurement Devices Volume Share (%), by Country 2024 & 2032
- Figure 51: Asia Pacific Contact-Type Temperature Measurement Devices Revenue (million), by Application 2024 & 2032
- Figure 52: Asia Pacific Contact-Type Temperature Measurement Devices Volume (K), by Application 2024 & 2032
- Figure 53: Asia Pacific Contact-Type Temperature Measurement Devices Revenue Share (%), by Application 2024 & 2032
- Figure 54: Asia Pacific Contact-Type Temperature Measurement Devices Volume Share (%), by Application 2024 & 2032
- Figure 55: Asia Pacific Contact-Type Temperature Measurement Devices Revenue (million), by Types 2024 & 2032
- Figure 56: Asia Pacific Contact-Type Temperature Measurement Devices Volume (K), by Types 2024 & 2032
- Figure 57: Asia Pacific Contact-Type Temperature Measurement Devices Revenue Share (%), by Types 2024 & 2032
- Figure 58: Asia Pacific Contact-Type Temperature Measurement Devices Volume Share (%), by Types 2024 & 2032
- Figure 59: Asia Pacific Contact-Type Temperature Measurement Devices Revenue (million), by Country 2024 & 2032
- Figure 60: Asia Pacific Contact-Type Temperature Measurement Devices Volume (K), by Country 2024 & 2032
- Figure 61: Asia Pacific Contact-Type Temperature Measurement Devices Revenue Share (%), by Country 2024 & 2032
- Figure 62: Asia Pacific Contact-Type Temperature Measurement Devices Volume Share (%), by Country 2024 & 2032
List of Tables
- Table 1: Global Contact-Type Temperature Measurement Devices Revenue million Forecast, by Region 2019 & 2032
- Table 2: Global Contact-Type Temperature Measurement Devices Volume K Forecast, by Region 2019 & 2032
- Table 3: Global Contact-Type Temperature Measurement Devices Revenue million Forecast, by Application 2019 & 2032
- Table 4: Global Contact-Type Temperature Measurement Devices Volume K Forecast, by Application 2019 & 2032
- Table 5: Global Contact-Type Temperature Measurement Devices Revenue million Forecast, by Types 2019 & 2032
- Table 6: Global Contact-Type Temperature Measurement Devices Volume K Forecast, by Types 2019 & 2032
- Table 7: Global Contact-Type Temperature Measurement Devices Revenue million Forecast, by Region 2019 & 2032
- Table 8: Global Contact-Type Temperature Measurement Devices Volume K Forecast, by Region 2019 & 2032
- Table 9: Global Contact-Type Temperature Measurement Devices Revenue million Forecast, by Application 2019 & 2032
- Table 10: Global Contact-Type Temperature Measurement Devices Volume K Forecast, by Application 2019 & 2032
- Table 11: Global Contact-Type Temperature Measurement Devices Revenue million Forecast, by Types 2019 & 2032
- Table 12: Global Contact-Type Temperature Measurement Devices Volume K Forecast, by Types 2019 & 2032
- Table 13: Global Contact-Type Temperature Measurement Devices Revenue million Forecast, by Country 2019 & 2032
- Table 14: Global Contact-Type Temperature Measurement Devices Volume K Forecast, by Country 2019 & 2032
- Table 15: United States Contact-Type Temperature Measurement Devices Revenue (million) Forecast, by Application 2019 & 2032
- Table 16: United States Contact-Type Temperature Measurement Devices Volume (K) Forecast, by Application 2019 & 2032
- Table 17: Canada Contact-Type Temperature Measurement Devices Revenue (million) Forecast, by Application 2019 & 2032
- Table 18: Canada Contact-Type Temperature Measurement Devices Volume (K) Forecast, by Application 2019 & 2032
- Table 19: Mexico Contact-Type Temperature Measurement Devices Revenue (million) Forecast, by Application 2019 & 2032
- Table 20: Mexico Contact-Type Temperature Measurement Devices Volume (K) Forecast, by Application 2019 & 2032
- Table 21: Global Contact-Type Temperature Measurement Devices Revenue million Forecast, by Application 2019 & 2032
- Table 22: Global Contact-Type Temperature Measurement Devices Volume K Forecast, by Application 2019 & 2032
- Table 23: Global Contact-Type Temperature Measurement Devices Revenue million Forecast, by Types 2019 & 2032
- Table 24: Global Contact-Type Temperature Measurement Devices Volume K Forecast, by Types 2019 & 2032
- Table 25: Global Contact-Type Temperature Measurement Devices Revenue million Forecast, by Country 2019 & 2032
- Table 26: Global Contact-Type Temperature Measurement Devices Volume K Forecast, by Country 2019 & 2032
- Table 27: Brazil Contact-Type Temperature Measurement Devices Revenue (million) Forecast, by Application 2019 & 2032
- Table 28: Brazil Contact-Type Temperature Measurement Devices Volume (K) Forecast, by Application 2019 & 2032
- Table 29: Argentina Contact-Type Temperature Measurement Devices Revenue (million) Forecast, by Application 2019 & 2032
- Table 30: Argentina Contact-Type Temperature Measurement Devices Volume (K) Forecast, by Application 2019 & 2032
- Table 31: Rest of South America Contact-Type Temperature Measurement Devices Revenue (million) Forecast, by Application 2019 & 2032
- Table 32: Rest of South America Contact-Type Temperature Measurement Devices Volume (K) Forecast, by Application 2019 & 2032
- Table 33: Global Contact-Type Temperature Measurement Devices Revenue million Forecast, by Application 2019 & 2032
- Table 34: Global Contact-Type Temperature Measurement Devices Volume K Forecast, by Application 2019 & 2032
- Table 35: Global Contact-Type Temperature Measurement Devices Revenue million Forecast, by Types 2019 & 2032
- Table 36: Global Contact-Type Temperature Measurement Devices Volume K Forecast, by Types 2019 & 2032
- Table 37: Global Contact-Type Temperature Measurement Devices Revenue million Forecast, by Country 2019 & 2032
- Table 38: Global Contact-Type Temperature Measurement Devices Volume K Forecast, by Country 2019 & 2032
- Table 39: United Kingdom Contact-Type Temperature Measurement Devices Revenue (million) Forecast, by Application 2019 & 2032
- Table 40: United Kingdom Contact-Type Temperature Measurement Devices Volume (K) Forecast, by Application 2019 & 2032
- Table 41: Germany Contact-Type Temperature Measurement Devices Revenue (million) Forecast, by Application 2019 & 2032
- Table 42: Germany Contact-Type Temperature Measurement Devices Volume (K) Forecast, by Application 2019 & 2032
- Table 43: France Contact-Type Temperature Measurement Devices Revenue (million) Forecast, by Application 2019 & 2032
- Table 44: France Contact-Type Temperature Measurement Devices Volume (K) Forecast, by Application 2019 & 2032
- Table 45: Italy Contact-Type Temperature Measurement Devices Revenue (million) Forecast, by Application 2019 & 2032
- Table 46: Italy Contact-Type Temperature Measurement Devices Volume (K) Forecast, by Application 2019 & 2032
- Table 47: Spain Contact-Type Temperature Measurement Devices Revenue (million) Forecast, by Application 2019 & 2032
- Table 48: Spain Contact-Type Temperature Measurement Devices Volume (K) Forecast, by Application 2019 & 2032
- Table 49: Russia Contact-Type Temperature Measurement Devices Revenue (million) Forecast, by Application 2019 & 2032
- Table 50: Russia Contact-Type Temperature Measurement Devices Volume (K) Forecast, by Application 2019 & 2032
- Table 51: Benelux Contact-Type Temperature Measurement Devices Revenue (million) Forecast, by Application 2019 & 2032
- Table 52: Benelux Contact-Type Temperature Measurement Devices Volume (K) Forecast, by Application 2019 & 2032
- Table 53: Nordics Contact-Type Temperature Measurement Devices Revenue (million) Forecast, by Application 2019 & 2032
- Table 54: Nordics Contact-Type Temperature Measurement Devices Volume (K) Forecast, by Application 2019 & 2032
- Table 55: Rest of Europe Contact-Type Temperature Measurement Devices Revenue (million) Forecast, by Application 2019 & 2032
- Table 56: Rest of Europe Contact-Type Temperature Measurement Devices Volume (K) Forecast, by Application 2019 & 2032
- Table 57: Global Contact-Type Temperature Measurement Devices Revenue million Forecast, by Application 2019 & 2032
- Table 58: Global Contact-Type Temperature Measurement Devices Volume K Forecast, by Application 2019 & 2032
- Table 59: Global Contact-Type Temperature Measurement Devices Revenue million Forecast, by Types 2019 & 2032
- Table 60: Global Contact-Type Temperature Measurement Devices Volume K Forecast, by Types 2019 & 2032
- Table 61: Global Contact-Type Temperature Measurement Devices Revenue million Forecast, by Country 2019 & 2032
- Table 62: Global Contact-Type Temperature Measurement Devices Volume K Forecast, by Country 2019 & 2032
- Table 63: Turkey Contact-Type Temperature Measurement Devices Revenue (million) Forecast, by Application 2019 & 2032
- Table 64: Turkey Contact-Type Temperature Measurement Devices Volume (K) Forecast, by Application 2019 & 2032
- Table 65: Israel Contact-Type Temperature Measurement Devices Revenue (million) Forecast, by Application 2019 & 2032
- Table 66: Israel Contact-Type Temperature Measurement Devices Volume (K) Forecast, by Application 2019 & 2032
- Table 67: GCC Contact-Type Temperature Measurement Devices Revenue (million) Forecast, by Application 2019 & 2032
- Table 68: GCC Contact-Type Temperature Measurement Devices Volume (K) Forecast, by Application 2019 & 2032
- Table 69: North Africa Contact-Type Temperature Measurement Devices Revenue (million) Forecast, by Application 2019 & 2032
- Table 70: North Africa Contact-Type Temperature Measurement Devices Volume (K) Forecast, by Application 2019 & 2032
- Table 71: South Africa Contact-Type Temperature Measurement Devices Revenue (million) Forecast, by Application 2019 & 2032
- Table 72: South Africa Contact-Type Temperature Measurement Devices Volume (K) Forecast, by Application 2019 & 2032
- Table 73: Rest of Middle East & Africa Contact-Type Temperature Measurement Devices Revenue (million) Forecast, by Application 2019 & 2032
- Table 74: Rest of Middle East & Africa Contact-Type Temperature Measurement Devices Volume (K) Forecast, by Application 2019 & 2032
- Table 75: Global Contact-Type Temperature Measurement Devices Revenue million Forecast, by Application 2019 & 2032
- Table 76: Global Contact-Type Temperature Measurement Devices Volume K Forecast, by Application 2019 & 2032
- Table 77: Global Contact-Type Temperature Measurement Devices Revenue million Forecast, by Types 2019 & 2032
- Table 78: Global Contact-Type Temperature Measurement Devices Volume K Forecast, by Types 2019 & 2032
- Table 79: Global Contact-Type Temperature Measurement Devices Revenue million Forecast, by Country 2019 & 2032
- Table 80: Global Contact-Type Temperature Measurement Devices Volume K Forecast, by Country 2019 & 2032
- Table 81: China Contact-Type Temperature Measurement Devices Revenue (million) Forecast, by Application 2019 & 2032
- Table 82: China Contact-Type Temperature Measurement Devices Volume (K) Forecast, by Application 2019 & 2032
- Table 83: India Contact-Type Temperature Measurement Devices Revenue (million) Forecast, by Application 2019 & 2032
- Table 84: India Contact-Type Temperature Measurement Devices Volume (K) Forecast, by Application 2019 & 2032
- Table 85: Japan Contact-Type Temperature Measurement Devices Revenue (million) Forecast, by Application 2019 & 2032
- Table 86: Japan Contact-Type Temperature Measurement Devices Volume (K) Forecast, by Application 2019 & 2032
- Table 87: South Korea Contact-Type Temperature Measurement Devices Revenue (million) Forecast, by Application 2019 & 2032
- Table 88: South Korea Contact-Type Temperature Measurement Devices Volume (K) Forecast, by Application 2019 & 2032
- Table 89: ASEAN Contact-Type Temperature Measurement Devices Revenue (million) Forecast, by Application 2019 & 2032
- Table 90: ASEAN Contact-Type Temperature Measurement Devices Volume (K) Forecast, by Application 2019 & 2032
- Table 91: Oceania Contact-Type Temperature Measurement Devices Revenue (million) Forecast, by Application 2019 & 2032
- Table 92: Oceania Contact-Type Temperature Measurement Devices Volume (K) Forecast, by Application 2019 & 2032
- Table 93: Rest of Asia Pacific Contact-Type Temperature Measurement Devices Revenue (million) Forecast, by Application 2019 & 2032
- Table 94: Rest of Asia Pacific Contact-Type Temperature Measurement Devices Volume (K) Forecast, by Application 2019 & 2032
Frequently Asked Questions
1. What is the projected Compound Annual Growth Rate (CAGR) of the Contact-Type Temperature Measurement Devices?
The projected CAGR is approximately XX%.
2. Which companies are prominent players in the Contact-Type Temperature Measurement Devices?
Key companies in the market include Omega Engineering, Texas Instruments, STMicroelectronics, SIEMENS, Honeywell, TE Connectivity, Wika, Endress+Hauser, Analog Devices, Amphenol, Murata, Mitsubishi Electric, KYOCERA AVX, Panasonic, Danfoss, ABB, TDK, IHI Corporation, SEMITEC, Vishay Intertechnology, Bourns.
3. What are the main segments of the Contact-Type Temperature Measurement Devices?
The market segments include Application, Types.
4. Can you provide details about the market size?
The market size is estimated to be USD XXX million as of 2022.
5. What are some drivers contributing to market growth?
N/A
6. What are the notable trends driving market growth?
N/A
7. Are there any restraints impacting market growth?
N/A
8. Can you provide examples of recent developments in the market?
N/A
9. What pricing options are available for accessing the report?
Pricing options include single-user, multi-user, and enterprise licenses priced at USD 4350.00, USD 6525.00, and USD 8700.00 respectively.
10. Is the market size provided in terms of value or volume?
The market size is provided in terms of value, measured in million and volume, measured in K.
11. Are there any specific market keywords associated with the report?
Yes, the market keyword associated with the report is "Contact-Type Temperature Measurement Devices," which aids in identifying and referencing the specific market segment covered.
12. How do I determine which pricing option suits my needs best?
The pricing options vary based on user requirements and access needs. Individual users may opt for single-user licenses, while businesses requiring broader access may choose multi-user or enterprise licenses for cost-effective access to the report.
13. Are there any additional resources or data provided in the Contact-Type Temperature Measurement Devices report?
While the report offers comprehensive insights, it's advisable to review the specific contents or supplementary materials provided to ascertain if additional resources or data are available.
14. How can I stay updated on further developments or reports in the Contact-Type Temperature Measurement Devices?
To stay informed about further developments, trends, and reports in the Contact-Type Temperature Measurement Devices, consider subscribing to industry newsletters, following relevant companies and organizations, or regularly checking reputable industry news sources and publications.
Methodology
Step 1 - Identification of Relevant Samples Size from Population Database


Step 2 - Approaches for Defining Global Market Size (Value, Volume* & Price*)

Note*: In applicable scenarios
Step 3 - Data Sources
Primary Research
- Web Analytics
- Survey Reports
- Research Institute
- Latest Research Reports
- Opinion Leaders
Secondary Research
- Annual Reports
- White Paper
- Latest Press Release
- Industry Association
- Paid Database
- Investor Presentations

Step 4 - Data Triangulation
Involves using different sources of information in order to increase the validity of a study
These sources are likely to be stakeholders in a program - participants, other researchers, program staff, other community members, and so on.
Then we put all data in single framework & apply various statistical tools to find out the dynamic on the market.
During the analysis stage, feedback from the stakeholder groups would be compared to determine areas of agreement as well as areas of divergence
