

Key Insights
The global down and feather market is experiencing robust growth, driven by increasing demand from the bedding and apparel industries. The market's expansion is fueled by several factors, including rising disposable incomes in developing economies leading to increased consumer spending on premium comfort products, a surge in popularity of eco-friendly and sustainable materials (with down and feather, when responsibly sourced, fitting this criteria), and the ongoing growth of the e-commerce sector providing easier access to these products for consumers worldwide. While the market faces challenges such as fluctuating raw material prices and ethical sourcing concerns, these are being addressed by industry players through initiatives focused on traceability and sustainable practices. The market is segmented by product type (down, feathers, and down-feather blends), application (bedding, apparel, and others), and geography, with North America and Europe currently holding significant market share. The strong growth trajectory is expected to continue throughout the forecast period, driven by innovation in product design and manufacturing, coupled with a greater emphasis on product quality and consumer awareness regarding the advantages of natural fillings.
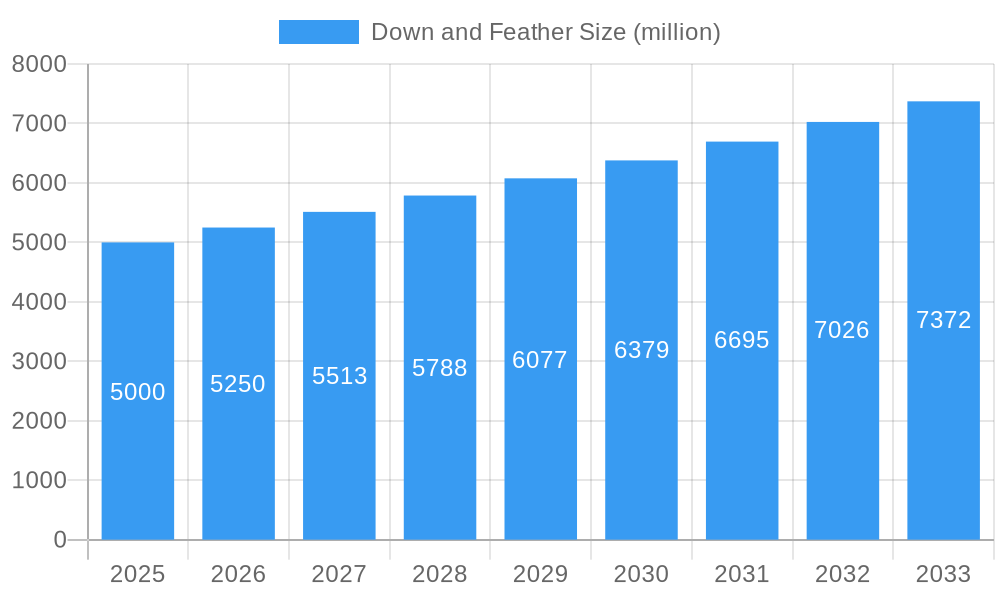
Down and Feather Market Size (In Billion)
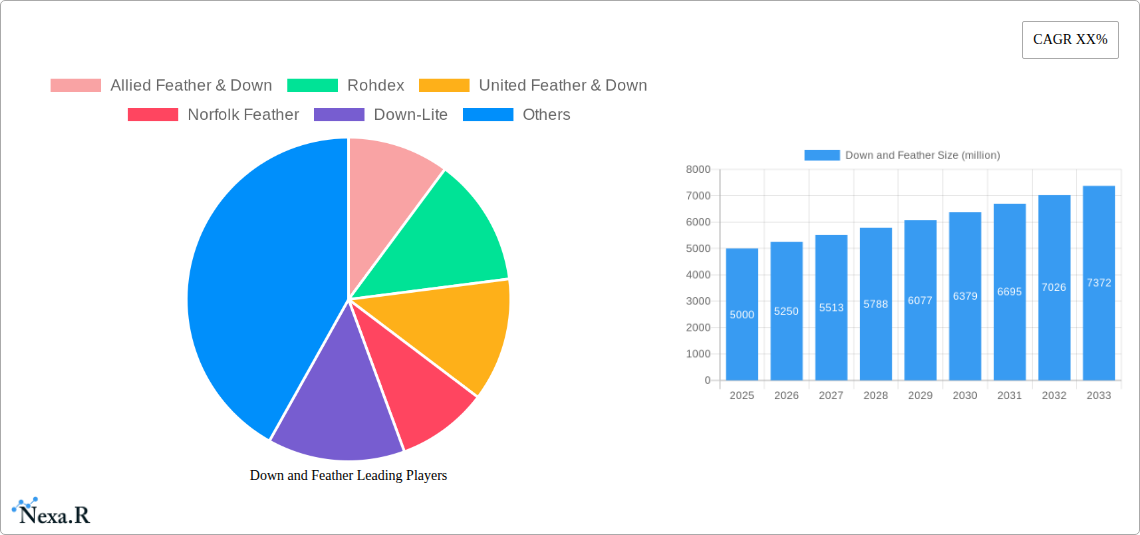
The competitive landscape is relatively consolidated, with key players like Allied Feather & Down, Rohdex, United Feather & Down, and others focusing on product diversification, strategic partnerships, and geographical expansion to maintain their market positions. Future growth will hinge on companies’ ability to innovate in sustainable sourcing, processing, and production, aligning with growing consumer demand for ethically and environmentally responsible products. This includes implementing robust traceability systems to ensure the humane treatment of animals and minimizing the environmental impact of down and feather production. Market players are also focusing on developing high-performance products with enhanced thermal properties and durability, catering to the evolving needs of consumers. The market is poised for substantial growth, driven by a combination of economic, social, and technological factors, presenting lucrative opportunities for industry participants.
Down and Feather Company Market Share
Down and Feather Market Report: 2019-2033
This comprehensive report provides an in-depth analysis of the global down and feather market, encompassing historical data (2019-2024), current estimations (2025), and future forecasts (2025-2033). It examines market dynamics, growth trends, key players, and emerging opportunities across various segments, including bedding, apparel, and outerwear. This report is essential for industry professionals, investors, and anyone seeking a comprehensive understanding of this dynamic market. The study period covers 2019-2033, with 2025 as the base and estimated year.
Down and Feather Market Dynamics & Structure
The global down and feather market exhibits a moderately consolidated structure, with key players like Allied Feather & Down, Rohdex, and United Feather & Down holding significant market shares. Technological innovations, particularly in processing and treatment technologies, are crucial drivers, alongside evolving consumer preferences for sustainable and ethically sourced products. Regulatory frameworks concerning animal welfare and environmental impact are increasingly influential, shaping industry practices and product development. Competitive substitutes, such as synthetic fill materials, pose a challenge, particularly in price-sensitive segments. The market is further influenced by M&A activities, with a xx million units estimated deal volume in the past five years, primarily driven by companies seeking to expand their geographical reach and product portfolios. End-user demographics demonstrate a preference shift toward premium, high-quality down and feather products, boosting the market for specialized and luxury items.
- Market Concentration: Moderately consolidated, with top 3 players holding xx% market share in 2025.
- Technological Innovation: Focus on improved processing, hygiene, and sustainability.
- Regulatory Framework: Increasing focus on animal welfare and traceability.
- Competitive Substitutes: Synthetic fills are a growing challenge, especially in budget segments.
- M&A Activity: xx million units deal volume (2020-2024), driven by expansion and diversification.
- End-User Demographics: Growing demand for premium and ethically sourced products.
Down and Feather Growth Trends & Insights
The global down and feather market experienced a CAGR of xx% during the historical period (2019-2024), reaching a market size of xx million units in 2024. This growth is attributed to several factors, including rising disposable incomes in developing economies, increased consumer awareness of the superior thermal properties of down and feather products, and the growing popularity of outdoor activities. Technological disruptions, such as advancements in down processing and sterilization techniques, have improved product quality and hygiene, further driving market expansion. Consumer behavior shifts towards eco-conscious and ethically produced goods are increasingly impacting sourcing and production practices. The market is projected to maintain a healthy growth trajectory, with a forecast CAGR of xx% during 2025-2033, driven by continued consumer demand and technological advancements. Market penetration in emerging markets remains relatively low, presenting significant growth opportunities.
Dominant Regions, Countries, or Segments in Down and Feather
The North American region dominates the global down and feather market, accounting for xx% of the total market share in 2025. This dominance is driven by factors such as high per capita income, strong consumer preference for premium bedding and apparel, and a robust retail infrastructure. European markets also hold significant shares, with Germany and France being major consumers, showcasing a similar trend of higher disposable incomes and interest in high-quality bedding and outerwear. The Asia-Pacific region is experiencing rapid growth, driven by increasing urbanization, rising middle-class incomes, and changing lifestyles.
- Key Drivers in North America: High disposable income, established retail infrastructure, strong demand for luxury goods.
- Key Drivers in Europe: Well-developed market with a preference for high-quality products, strong environmental regulations.
- Key Drivers in Asia-Pacific: Rapid economic growth, urbanization, rising disposable incomes.
- Market Share: North America (xx%), Europe (xx%), Asia-Pacific (xx%).
- Growth Potential: Highest growth expected in Asia-Pacific region.
Down and Feather Product Landscape
The down and feather product landscape encompasses a wide range of products, including bedding (pillows, duvets, comforters), apparel (jackets, coats), and outerwear. Product innovation focuses on enhancing performance attributes like warmth-to-weight ratio, water resistance, and durability. Technological advancements involve improving down cleaning and processing techniques, resulting in hypoallergenic and more sustainable products. Key features driving product differentiation include fill power, traceability, ethical sourcing certifications, and innovative fabric technologies. Unique selling propositions often center around enhanced comfort, breathability, and sustainability aspects.
Key Drivers, Barriers & Challenges in Down and Feather
Key Drivers: Rising consumer disposable income, growth in outdoor recreational activities, increasing awareness of down and feather's superior thermal properties, and technological advancements in processing and treatment are boosting market growth. Furthermore, the growing preference for natural and sustainable products significantly impacts the industry.
Key Challenges & Restraints: Fluctuations in raw material supply and price, concerns regarding animal welfare and ethical sourcing practices, and the competitive threat from synthetic alternatives are major constraints. Regulatory hurdles related to product labeling and environmental standards add further complexity. Supply chain disruptions can significantly affect production and pricing. These challenges collectively impact profitability and market stability. Approximately xx million units of potential production was lost due to supply chain issues in 2024, estimated.
Emerging Opportunities in Down and Feather
Untapped markets in developing economies, the increasing demand for sustainable and ethically sourced products, and the growing popularity of outdoor recreation present lucrative opportunities. Innovative applications of down and feather in niche segments (e.g., luxury sleepwear, specialized apparel) are expanding market reach. Evolving consumer preferences for high-quality, comfortable, and eco-friendly products drive innovation and market expansion.
Growth Accelerators in the Down and Feather Industry
Technological breakthroughs in down processing, improving hygiene and sustainability, are key drivers of growth. Strategic partnerships between manufacturers and retailers improve distribution and brand recognition. Expansion into new geographic markets and diversification into new product segments are major catalysts for long-term market growth.
Key Players Shaping the Down and Feather Market
- Allied Feather & Down
- Rohdex
- United Feather & Down
- Norfolk Feather
- Down-Lite
- Hans Kruchen
- Feather Industries
- KL DOWN
Notable Milestones in Down and Feather Sector
- 2021: Increased focus on sustainable sourcing and ethical practices across major players.
- 2022: Several companies launched new product lines with enhanced durability and water resistance.
- 2023: A major industry association published updated standards for down and feather processing.
- 2024: Significant investment in technological upgrades by key manufacturers.
In-Depth Down and Feather Market Outlook
The future of the down and feather market looks promising, driven by continued innovation, growing consumer demand, and expansion into new markets. Strategic opportunities lie in sustainable sourcing, improved traceability, and development of high-performance products targeting niche segments. The market is poised for continued growth, driven by consumer preference for comfort and sustainability. The focus on ethical sourcing and transparency will be critical for long-term success.
Down and Feather Segmentation
-
1. Application
- 1.1. Online
- 1.2. Offline (Specialty Stores, Hypermarkets, Supermarkets)
-
2. Types
- 2.1. Duck
- 2.2. Goose
Down and Feather Segmentation By Geography
-
1. North America
- 1.1. United States
- 1.2. Canada
- 1.3. Mexico
-
2. South America
- 2.1. Brazil
- 2.2. Argentina
- 2.3. Rest of South America
-
3. Europe
- 3.1. United Kingdom
- 3.2. Germany
- 3.3. France
- 3.4. Italy
- 3.5. Spain
- 3.6. Russia
- 3.7. Benelux
- 3.8. Nordics
- 3.9. Rest of Europe
-
4. Middle East & Africa
- 4.1. Turkey
- 4.2. Israel
- 4.3. GCC
- 4.4. North Africa
- 4.5. South Africa
- 4.6. Rest of Middle East & Africa
-
5. Asia Pacific
- 5.1. China
- 5.2. India
- 5.3. Japan
- 5.4. South Korea
- 5.5. ASEAN
- 5.6. Oceania
- 5.7. Rest of Asia Pacific

Down and Feather Regional Market Share
Geographic Coverage of Down and Feather
Down and Feather REPORT HIGHLIGHTS
| Aspects | Details |
|---|---|
| Study Period | 2020-2034 |
| Base Year | 2025 |
| Estimated Year | 2026 |
| Forecast Period | 2026-2034 |
| Historical Period | 2020-2025 |
| Growth Rate | CAGR of XX% from 2020-2034 |
| Segmentation |
|
Table of Contents
- 1. Introduction
- 1.1. Research Scope
- 1.2. Market Segmentation
- 1.3. Research Methodology
- 1.4. Definitions and Assumptions
- 2. Executive Summary
- 2.1. Introduction
- 3. Market Dynamics
- 3.1. Introduction
- 3.2. Market Drivers
- 3.3. Market Restrains
- 3.4. Market Trends
- 4. Market Factor Analysis
- 4.1. Porters Five Forces
- 4.2. Supply/Value Chain
- 4.3. PESTEL analysis
- 4.4. Market Entropy
- 4.5. Patent/Trademark Analysis
- 5. Global Down and Feather Analysis, Insights and Forecast, 2020-2032
- 5.1. Market Analysis, Insights and Forecast - by Application
- 5.1.1. Online
- 5.1.2. Offline (Specialty Stores, Hypermarkets, Supermarkets)
- 5.2. Market Analysis, Insights and Forecast - by Types
- 5.2.1. Duck
- 5.2.2. Goose
- 5.3. Market Analysis, Insights and Forecast - by Region
- 5.3.1. North America
- 5.3.2. South America
- 5.3.3. Europe
- 5.3.4. Middle East & Africa
- 5.3.5. Asia Pacific
- 5.1. Market Analysis, Insights and Forecast - by Application
- 6. North America Down and Feather Analysis, Insights and Forecast, 2020-2032
- 6.1. Market Analysis, Insights and Forecast - by Application
- 6.1.1. Online
- 6.1.2. Offline (Specialty Stores, Hypermarkets, Supermarkets)
- 6.2. Market Analysis, Insights and Forecast - by Types
- 6.2.1. Duck
- 6.2.2. Goose
- 6.1. Market Analysis, Insights and Forecast - by Application
- 7. South America Down and Feather Analysis, Insights and Forecast, 2020-2032
- 7.1. Market Analysis, Insights and Forecast - by Application
- 7.1.1. Online
- 7.1.2. Offline (Specialty Stores, Hypermarkets, Supermarkets)
- 7.2. Market Analysis, Insights and Forecast - by Types
- 7.2.1. Duck
- 7.2.2. Goose
- 7.1. Market Analysis, Insights and Forecast - by Application
- 8. Europe Down and Feather Analysis, Insights and Forecast, 2020-2032
- 8.1. Market Analysis, Insights and Forecast - by Application
- 8.1.1. Online
- 8.1.2. Offline (Specialty Stores, Hypermarkets, Supermarkets)
- 8.2. Market Analysis, Insights and Forecast - by Types
- 8.2.1. Duck
- 8.2.2. Goose
- 8.1. Market Analysis, Insights and Forecast - by Application
- 9. Middle East & Africa Down and Feather Analysis, Insights and Forecast, 2020-2032
- 9.1. Market Analysis, Insights and Forecast - by Application
- 9.1.1. Online
- 9.1.2. Offline (Specialty Stores, Hypermarkets, Supermarkets)
- 9.2. Market Analysis, Insights and Forecast - by Types
- 9.2.1. Duck
- 9.2.2. Goose
- 9.1. Market Analysis, Insights and Forecast - by Application
- 10. Asia Pacific Down and Feather Analysis, Insights and Forecast, 2020-2032
- 10.1. Market Analysis, Insights and Forecast - by Application
- 10.1.1. Online
- 10.1.2. Offline (Specialty Stores, Hypermarkets, Supermarkets)
- 10.2. Market Analysis, Insights and Forecast - by Types
- 10.2.1. Duck
- 10.2.2. Goose
- 10.1. Market Analysis, Insights and Forecast - by Application
- 11. Competitive Analysis
- 11.1. Global Market Share Analysis 2025
- 11.2. Company Profiles
- 11.2.1 Allied Feather & Down
- 11.2.1.1. Overview
- 11.2.1.2. Products
- 11.2.1.3. SWOT Analysis
- 11.2.1.4. Recent Developments
- 11.2.1.5. Financials (Based on Availability)
- 11.2.2 Rohdex
- 11.2.2.1. Overview
- 11.2.2.2. Products
- 11.2.2.3. SWOT Analysis
- 11.2.2.4. Recent Developments
- 11.2.2.5. Financials (Based on Availability)
- 11.2.3 United Feather & Down
- 11.2.3.1. Overview
- 11.2.3.2. Products
- 11.2.3.3. SWOT Analysis
- 11.2.3.4. Recent Developments
- 11.2.3.5. Financials (Based on Availability)
- 11.2.4 Norfolk Feather
- 11.2.4.1. Overview
- 11.2.4.2. Products
- 11.2.4.3. SWOT Analysis
- 11.2.4.4. Recent Developments
- 11.2.4.5. Financials (Based on Availability)
- 11.2.5 Down-Lite
- 11.2.5.1. Overview
- 11.2.5.2. Products
- 11.2.5.3. SWOT Analysis
- 11.2.5.4. Recent Developments
- 11.2.5.5. Financials (Based on Availability)
- 11.2.6 Hans Kruchen
- 11.2.6.1. Overview
- 11.2.6.2. Products
- 11.2.6.3. SWOT Analysis
- 11.2.6.4. Recent Developments
- 11.2.6.5. Financials (Based on Availability)
- 11.2.7 Feather Industries
- 11.2.7.1. Overview
- 11.2.7.2. Products
- 11.2.7.3. SWOT Analysis
- 11.2.7.4. Recent Developments
- 11.2.7.5. Financials (Based on Availability)
- 11.2.8 KL DOWN
- 11.2.8.1. Overview
- 11.2.8.2. Products
- 11.2.8.3. SWOT Analysis
- 11.2.8.4. Recent Developments
- 11.2.8.5. Financials (Based on Availability)
- 11.2.1 Allied Feather & Down
List of Figures
- Figure 1: Global Down and Feather Revenue Breakdown (million, %) by Region 2025 & 2033
- Figure 2: Global Down and Feather Volume Breakdown (K, %) by Region 2025 & 2033
- Figure 3: North America Down and Feather Revenue (million), by Application 2025 & 2033
- Figure 4: North America Down and Feather Volume (K), by Application 2025 & 2033
- Figure 5: North America Down and Feather Revenue Share (%), by Application 2025 & 2033
- Figure 6: North America Down and Feather Volume Share (%), by Application 2025 & 2033
- Figure 7: North America Down and Feather Revenue (million), by Types 2025 & 2033
- Figure 8: North America Down and Feather Volume (K), by Types 2025 & 2033
- Figure 9: North America Down and Feather Revenue Share (%), by Types 2025 & 2033
- Figure 10: North America Down and Feather Volume Share (%), by Types 2025 & 2033
- Figure 11: North America Down and Feather Revenue (million), by Country 2025 & 2033
- Figure 12: North America Down and Feather Volume (K), by Country 2025 & 2033
- Figure 13: North America Down and Feather Revenue Share (%), by Country 2025 & 2033
- Figure 14: North America Down and Feather Volume Share (%), by Country 2025 & 2033
- Figure 15: South America Down and Feather Revenue (million), by Application 2025 & 2033
- Figure 16: South America Down and Feather Volume (K), by Application 2025 & 2033
- Figure 17: South America Down and Feather Revenue Share (%), by Application 2025 & 2033
- Figure 18: South America Down and Feather Volume Share (%), by Application 2025 & 2033
- Figure 19: South America Down and Feather Revenue (million), by Types 2025 & 2033
- Figure 20: South America Down and Feather Volume (K), by Types 2025 & 2033
- Figure 21: South America Down and Feather Revenue Share (%), by Types 2025 & 2033
- Figure 22: South America Down and Feather Volume Share (%), by Types 2025 & 2033
- Figure 23: South America Down and Feather Revenue (million), by Country 2025 & 2033
- Figure 24: South America Down and Feather Volume (K), by Country 2025 & 2033
- Figure 25: South America Down and Feather Revenue Share (%), by Country 2025 & 2033
- Figure 26: South America Down and Feather Volume Share (%), by Country 2025 & 2033
- Figure 27: Europe Down and Feather Revenue (million), by Application 2025 & 2033
- Figure 28: Europe Down and Feather Volume (K), by Application 2025 & 2033
- Figure 29: Europe Down and Feather Revenue Share (%), by Application 2025 & 2033
- Figure 30: Europe Down and Feather Volume Share (%), by Application 2025 & 2033
- Figure 31: Europe Down and Feather Revenue (million), by Types 2025 & 2033
- Figure 32: Europe Down and Feather Volume (K), by Types 2025 & 2033
- Figure 33: Europe Down and Feather Revenue Share (%), by Types 2025 & 2033
- Figure 34: Europe Down and Feather Volume Share (%), by Types 2025 & 2033
- Figure 35: Europe Down and Feather Revenue (million), by Country 2025 & 2033
- Figure 36: Europe Down and Feather Volume (K), by Country 2025 & 2033
- Figure 37: Europe Down and Feather Revenue Share (%), by Country 2025 & 2033
- Figure 38: Europe Down and Feather Volume Share (%), by Country 2025 & 2033
- Figure 39: Middle East & Africa Down and Feather Revenue (million), by Application 2025 & 2033
- Figure 40: Middle East & Africa Down and Feather Volume (K), by Application 2025 & 2033
- Figure 41: Middle East & Africa Down and Feather Revenue Share (%), by Application 2025 & 2033
- Figure 42: Middle East & Africa Down and Feather Volume Share (%), by Application 2025 & 2033
- Figure 43: Middle East & Africa Down and Feather Revenue (million), by Types 2025 & 2033
- Figure 44: Middle East & Africa Down and Feather Volume (K), by Types 2025 & 2033
- Figure 45: Middle East & Africa Down and Feather Revenue Share (%), by Types 2025 & 2033
- Figure 46: Middle East & Africa Down and Feather Volume Share (%), by Types 2025 & 2033
- Figure 47: Middle East & Africa Down and Feather Revenue (million), by Country 2025 & 2033
- Figure 48: Middle East & Africa Down and Feather Volume (K), by Country 2025 & 2033
- Figure 49: Middle East & Africa Down and Feather Revenue Share (%), by Country 2025 & 2033
- Figure 50: Middle East & Africa Down and Feather Volume Share (%), by Country 2025 & 2033
- Figure 51: Asia Pacific Down and Feather Revenue (million), by Application 2025 & 2033
- Figure 52: Asia Pacific Down and Feather Volume (K), by Application 2025 & 2033
- Figure 53: Asia Pacific Down and Feather Revenue Share (%), by Application 2025 & 2033
- Figure 54: Asia Pacific Down and Feather Volume Share (%), by Application 2025 & 2033
- Figure 55: Asia Pacific Down and Feather Revenue (million), by Types 2025 & 2033
- Figure 56: Asia Pacific Down and Feather Volume (K), by Types 2025 & 2033
- Figure 57: Asia Pacific Down and Feather Revenue Share (%), by Types 2025 & 2033
- Figure 58: Asia Pacific Down and Feather Volume Share (%), by Types 2025 & 2033
- Figure 59: Asia Pacific Down and Feather Revenue (million), by Country 2025 & 2033
- Figure 60: Asia Pacific Down and Feather Volume (K), by Country 2025 & 2033
- Figure 61: Asia Pacific Down and Feather Revenue Share (%), by Country 2025 & 2033
- Figure 62: Asia Pacific Down and Feather Volume Share (%), by Country 2025 & 2033
List of Tables
- Table 1: Global Down and Feather Revenue million Forecast, by Application 2020 & 2033
- Table 2: Global Down and Feather Volume K Forecast, by Application 2020 & 2033
- Table 3: Global Down and Feather Revenue million Forecast, by Types 2020 & 2033
- Table 4: Global Down and Feather Volume K Forecast, by Types 2020 & 2033
- Table 5: Global Down and Feather Revenue million Forecast, by Region 2020 & 2033
- Table 6: Global Down and Feather Volume K Forecast, by Region 2020 & 2033
- Table 7: Global Down and Feather Revenue million Forecast, by Application 2020 & 2033
- Table 8: Global Down and Feather Volume K Forecast, by Application 2020 & 2033
- Table 9: Global Down and Feather Revenue million Forecast, by Types 2020 & 2033
- Table 10: Global Down and Feather Volume K Forecast, by Types 2020 & 2033
- Table 11: Global Down and Feather Revenue million Forecast, by Country 2020 & 2033
- Table 12: Global Down and Feather Volume K Forecast, by Country 2020 & 2033
- Table 13: United States Down and Feather Revenue (million) Forecast, by Application 2020 & 2033
- Table 14: United States Down and Feather Volume (K) Forecast, by Application 2020 & 2033
- Table 15: Canada Down and Feather Revenue (million) Forecast, by Application 2020 & 2033
- Table 16: Canada Down and Feather Volume (K) Forecast, by Application 2020 & 2033
- Table 17: Mexico Down and Feather Revenue (million) Forecast, by Application 2020 & 2033
- Table 18: Mexico Down and Feather Volume (K) Forecast, by Application 2020 & 2033
- Table 19: Global Down and Feather Revenue million Forecast, by Application 2020 & 2033
- Table 20: Global Down and Feather Volume K Forecast, by Application 2020 & 2033
- Table 21: Global Down and Feather Revenue million Forecast, by Types 2020 & 2033
- Table 22: Global Down and Feather Volume K Forecast, by Types 2020 & 2033
- Table 23: Global Down and Feather Revenue million Forecast, by Country 2020 & 2033
- Table 24: Global Down and Feather Volume K Forecast, by Country 2020 & 2033
- Table 25: Brazil Down and Feather Revenue (million) Forecast, by Application 2020 & 2033
- Table 26: Brazil Down and Feather Volume (K) Forecast, by Application 2020 & 2033
- Table 27: Argentina Down and Feather Revenue (million) Forecast, by Application 2020 & 2033
- Table 28: Argentina Down and Feather Volume (K) Forecast, by Application 2020 & 2033
- Table 29: Rest of South America Down and Feather Revenue (million) Forecast, by Application 2020 & 2033
- Table 30: Rest of South America Down and Feather Volume (K) Forecast, by Application 2020 & 2033
- Table 31: Global Down and Feather Revenue million Forecast, by Application 2020 & 2033
- Table 32: Global Down and Feather Volume K Forecast, by Application 2020 & 2033
- Table 33: Global Down and Feather Revenue million Forecast, by Types 2020 & 2033
- Table 34: Global Down and Feather Volume K Forecast, by Types 2020 & 2033
- Table 35: Global Down and Feather Revenue million Forecast, by Country 2020 & 2033
- Table 36: Global Down and Feather Volume K Forecast, by Country 2020 & 2033
- Table 37: United Kingdom Down and Feather Revenue (million) Forecast, by Application 2020 & 2033
- Table 38: United Kingdom Down and Feather Volume (K) Forecast, by Application 2020 & 2033
- Table 39: Germany Down and Feather Revenue (million) Forecast, by Application 2020 & 2033
- Table 40: Germany Down and Feather Volume (K) Forecast, by Application 2020 & 2033
- Table 41: France Down and Feather Revenue (million) Forecast, by Application 2020 & 2033
- Table 42: France Down and Feather Volume (K) Forecast, by Application 2020 & 2033
- Table 43: Italy Down and Feather Revenue (million) Forecast, by Application 2020 & 2033
- Table 44: Italy Down and Feather Volume (K) Forecast, by Application 2020 & 2033
- Table 45: Spain Down and Feather Revenue (million) Forecast, by Application 2020 & 2033
- Table 46: Spain Down and Feather Volume (K) Forecast, by Application 2020 & 2033
- Table 47: Russia Down and Feather Revenue (million) Forecast, by Application 2020 & 2033
- Table 48: Russia Down and Feather Volume (K) Forecast, by Application 2020 & 2033
- Table 49: Benelux Down and Feather Revenue (million) Forecast, by Application 2020 & 2033
- Table 50: Benelux Down and Feather Volume (K) Forecast, by Application 2020 & 2033
- Table 51: Nordics Down and Feather Revenue (million) Forecast, by Application 2020 & 2033
- Table 52: Nordics Down and Feather Volume (K) Forecast, by Application 2020 & 2033
- Table 53: Rest of Europe Down and Feather Revenue (million) Forecast, by Application 2020 & 2033
- Table 54: Rest of Europe Down and Feather Volume (K) Forecast, by Application 2020 & 2033
- Table 55: Global Down and Feather Revenue million Forecast, by Application 2020 & 2033
- Table 56: Global Down and Feather Volume K Forecast, by Application 2020 & 2033
- Table 57: Global Down and Feather Revenue million Forecast, by Types 2020 & 2033
- Table 58: Global Down and Feather Volume K Forecast, by Types 2020 & 2033
- Table 59: Global Down and Feather Revenue million Forecast, by Country 2020 & 2033
- Table 60: Global Down and Feather Volume K Forecast, by Country 2020 & 2033
- Table 61: Turkey Down and Feather Revenue (million) Forecast, by Application 2020 & 2033
- Table 62: Turkey Down and Feather Volume (K) Forecast, by Application 2020 & 2033
- Table 63: Israel Down and Feather Revenue (million) Forecast, by Application 2020 & 2033
- Table 64: Israel Down and Feather Volume (K) Forecast, by Application 2020 & 2033
- Table 65: GCC Down and Feather Revenue (million) Forecast, by Application 2020 & 2033
- Table 66: GCC Down and Feather Volume (K) Forecast, by Application 2020 & 2033
- Table 67: North Africa Down and Feather Revenue (million) Forecast, by Application 2020 & 2033
- Table 68: North Africa Down and Feather Volume (K) Forecast, by Application 2020 & 2033
- Table 69: South Africa Down and Feather Revenue (million) Forecast, by Application 2020 & 2033
- Table 70: South Africa Down and Feather Volume (K) Forecast, by Application 2020 & 2033
- Table 71: Rest of Middle East & Africa Down and Feather Revenue (million) Forecast, by Application 2020 & 2033
- Table 72: Rest of Middle East & Africa Down and Feather Volume (K) Forecast, by Application 2020 & 2033
- Table 73: Global Down and Feather Revenue million Forecast, by Application 2020 & 2033
- Table 74: Global Down and Feather Volume K Forecast, by Application 2020 & 2033
- Table 75: Global Down and Feather Revenue million Forecast, by Types 2020 & 2033
- Table 76: Global Down and Feather Volume K Forecast, by Types 2020 & 2033
- Table 77: Global Down and Feather Revenue million Forecast, by Country 2020 & 2033
- Table 78: Global Down and Feather Volume K Forecast, by Country 2020 & 2033
- Table 79: China Down and Feather Revenue (million) Forecast, by Application 2020 & 2033
- Table 80: China Down and Feather Volume (K) Forecast, by Application 2020 & 2033
- Table 81: India Down and Feather Revenue (million) Forecast, by Application 2020 & 2033
- Table 82: India Down and Feather Volume (K) Forecast, by Application 2020 & 2033
- Table 83: Japan Down and Feather Revenue (million) Forecast, by Application 2020 & 2033
- Table 84: Japan Down and Feather Volume (K) Forecast, by Application 2020 & 2033
- Table 85: South Korea Down and Feather Revenue (million) Forecast, by Application 2020 & 2033
- Table 86: South Korea Down and Feather Volume (K) Forecast, by Application 2020 & 2033
- Table 87: ASEAN Down and Feather Revenue (million) Forecast, by Application 2020 & 2033
- Table 88: ASEAN Down and Feather Volume (K) Forecast, by Application 2020 & 2033
- Table 89: Oceania Down and Feather Revenue (million) Forecast, by Application 2020 & 2033
- Table 90: Oceania Down and Feather Volume (K) Forecast, by Application 2020 & 2033
- Table 91: Rest of Asia Pacific Down and Feather Revenue (million) Forecast, by Application 2020 & 2033
- Table 92: Rest of Asia Pacific Down and Feather Volume (K) Forecast, by Application 2020 & 2033
Frequently Asked Questions
1. What is the projected Compound Annual Growth Rate (CAGR) of the Down and Feather?
The projected CAGR is approximately XX%.
2. Which companies are prominent players in the Down and Feather?
Key companies in the market include Allied Feather & Down, Rohdex, United Feather & Down, Norfolk Feather, Down-Lite, Hans Kruchen, Feather Industries, KL DOWN.
3. What are the main segments of the Down and Feather?
The market segments include Application, Types.
4. Can you provide details about the market size?
The market size is estimated to be USD XXX million as of 2022.
5. What are some drivers contributing to market growth?
N/A
6. What are the notable trends driving market growth?
N/A
7. Are there any restraints impacting market growth?
N/A
8. Can you provide examples of recent developments in the market?
N/A
9. What pricing options are available for accessing the report?
Pricing options include single-user, multi-user, and enterprise licenses priced at USD 3350.00, USD 5025.00, and USD 6700.00 respectively.
10. Is the market size provided in terms of value or volume?
The market size is provided in terms of value, measured in million and volume, measured in K.
11. Are there any specific market keywords associated with the report?
Yes, the market keyword associated with the report is "Down and Feather," which aids in identifying and referencing the specific market segment covered.
12. How do I determine which pricing option suits my needs best?
The pricing options vary based on user requirements and access needs. Individual users may opt for single-user licenses, while businesses requiring broader access may choose multi-user or enterprise licenses for cost-effective access to the report.
13. Are there any additional resources or data provided in the Down and Feather report?
While the report offers comprehensive insights, it's advisable to review the specific contents or supplementary materials provided to ascertain if additional resources or data are available.
14. How can I stay updated on further developments or reports in the Down and Feather?
To stay informed about further developments, trends, and reports in the Down and Feather, consider subscribing to industry newsletters, following relevant companies and organizations, or regularly checking reputable industry news sources and publications.
Methodology
Step 1 - Identification of Relevant Samples Size from Population Database


Step 2 - Approaches for Defining Global Market Size (Value, Volume* & Price*)

Note*: In applicable scenarios
Step 3 - Data Sources
Primary Research
- Web Analytics
- Survey Reports
- Research Institute
- Latest Research Reports
- Opinion Leaders
Secondary Research
- Annual Reports
- White Paper
- Latest Press Release
- Industry Association
- Paid Database
- Investor Presentations

Step 4 - Data Triangulation
Involves using different sources of information in order to increase the validity of a study
These sources are likely to be stakeholders in a program - participants, other researchers, program staff, other community members, and so on.
Then we put all data in single framework & apply various statistical tools to find out the dynamic on the market.
During the analysis stage, feedback from the stakeholder groups would be compared to determine areas of agreement as well as areas of divergence